Gold is about to make an upward breakthrough!- Descending Triangle as an corrective pattern in Short Time Frame
- Break of Structure
- S / R Level
- Change of Characteristics
- Completed " 12345 " Impulsive Waves and " ABC " Corrective Waves
GOLD trade ideas

Gold depends on GDP numbersTechnical analysis: Gold naturally found Buyers as Buying pressure is evident on the charts from DX on Selling sequence. It is important to note that #3,300.80 is new / old Resistance, which was near Weekly High’s as Price-action could find strong rejection there and deny the Buying response in extension. If broken, Price-action will be calling for #3,327.80 extension once again which represents local Top's for current fractal. I will engage my orders accordingly and wait for suitable entry even though I have closed my order ahead of the final push above the Resistance. However, Gold re-tested and was again rejected on the Hourly 4 chart’s Support keeping the Bullish bias alive. The Engulfing candle Bearish reversal candle on Hourly 1 chart succeeded at rejecting the Price-action and catching already the #32% Fibonacci level. I expect the last Daily chart’s candle to test again the #3,272.80 former Resistance now turned to Support when DX finds the Support zone and engages relief rally.
My position: As mentioned above, Gold is ranging and Scalpers are getting most of the returns out of this Price-action. I will await GDP numbers and only then make my move.

GOLD WEEKLY CHART MID/LONG TERM ROUTE MAPHey Everyone,
Quick update on our weekly chart idea, it's been playing out beautifully, helping us track the move down and catch the move back up.
After hitting our final channel top target at 3281, we mentioned we would look for support forming above the channel. That’s exactly what happened, with price finding support outside the channel and giving us the bounce we anticipated.
We also got a body close above 3281, which completed the gap up to 3387. From here, we'll be watching for continued support above the channel, a retest of 3387, and a close above it to confirm the continuation higher.
If we fail to retest and close above 3387, we’ll likely see a reset back to the channel top. Should that support fail, we would expect a break of the EMA5 back into the channel, resetting the play inside the channel with all previous levels back in play.
This is the beauty of our Goldturn channels, drawn using weighted averages instead of pure price action. This unique approach helps us clearly identify fake-outs and real breakouts, cutting out much of the noise that usually confuses traders.
Moving forward, we’ll focus on smaller timeframes (1H and 4H) to buy dips off the weighted Goldturns, aiming for clean 30–40 pip moves. Ranging markets are perfect for this style, allowing us to capitalize on quick moves without getting caught in the chop of larger swings.
Thanks again for all your likes, comments, and follows, we really appreciate the support!
Mr Gold
GoldViewFX

Potential HSNot confirmed yet but I'm jumping in anyways. I bought some puts of GLD for May 23 strike 304. My SL triggers if the price breaks up the resistance shown and closes above in the daily timeframe. Might be some turbulence, bulls will try to push the price higher. too much noise in the political arena, but Gold is overbought and needs a healthy correction.

GOLD (XAUUSD): Market Outlook & Short Update
Regarding Gold.
I received multiple requests to provide the update after
the price bounced to a target level, as I predicted earlier on Sunday.
At the moment, we see a perfect example of a consolidation.
The price is trading within a horizontal parallel channel - range.
As always, the market will most likely continue staying within that till the release
of important high impact news.
The closest ones we can find in the economic calendar.
Tomorrow we are expecting US GDP and Personal Spending Data.
For now, probabilities will be high that a consolidation will continue.
Consider looking for trading opportunities from the boundaries of the range.
After a news release, a breakout of the range will provide a strong confirmation
and accurately indicate the future direction of the market.
❤️Please, support my work with like, thank you!❤️
I am part of Trade Nation's Influencer program and receive a monthly fee for using their TradingView charts in my analysis.

The downside risk of gold increases!📌Fundamentals:
1. The conflict between India and Pakistan shows signs of escalation
2. US-Houthi ceasefire agreement
3. The Fed’s interest rate decision dominates this week’s market
4. International trade situation disturbs market sentiment
5. Market sentiment and capital flow
📊Technical aspects:
At present, on the hourly basis, gold is still under pressure at the small range resistance of 3400, and the current tariff crisis has cooled down. The data of the Fed's interest rate decision will cause a series of fluctuations in gold in the short term. At the same time, the market is betting that there will be further trend corrections, which may cause capital outflows in the market, which will further hit gold bulls!
There is actually a new round of operation opportunities in the short term. The short-term resistance should be around 3400, but since the game between major powers has not stopped, there will be no big negative factors. However, if the data layout does not fluctuate much, the market may not have a big dive. At present, we will temporarily play at the 3360-3400 level. If it breaks, we will make new adjustments!
🎯Practical strategy:
Gold: Short around 3390-3400 on the rebound, and the target is 3370-3360!

Non-agricultural prospective data analysis Operation suggestions📌Fundamentals:
📊Technical aspects:
Technically, spot gold is in a downward trend in the short term, and there is a certain rebound or shock at the key support level. At the 4-hour level, the gold price is running above the lower track of the Bollinger Band, and the opening shows signs of contraction. The MACD indicator dead cross is gradually closing, and the RSI indicator is running in the 35-45 range, showing that the long and short forces are relatively balanced.
🎯Practical strategy:
3260-3270 light position short, target 3225-3200. When it reaches 3225-3200 and stabilizes, try to go long, target 3250-3270.

Gold fluctuates before Fed decisionFrom a technical perspective, the international gold price encountered strong resistance at the 3500 integer psychological barrier on a daily basis and then started a technical correction. However, the first two trading days of this week were closed with long positive candlesticks, forming a strong rebound pattern, basically recovering the previous retracement space, indicating that bullish momentum continued to accumulate. It is worth noting that the moving average system presents a bullish arrangement: the 5-day and 10-day moving averages are bonded together to form a golden cross pattern, the upward slope of the medium-term moving average group is steeper, and the resonance of technical indicators shows that the upward momentum is repaired.
Technically, gold showed a violent shock trend during the Asian session, which is in line with the technical characteristics of the recent overnight consolidation, but we need to be alert to the possibility of a deep retracement after a continuous mild upward trend. This pattern may indicate that the bullish buying power is weakening. If the key pressure level of 3404 is not effectively broken during the day, the probability of a short-term top will increase significantly. At the strategic level, it is recommended that you avoid chasing highs and focus on the transmission effect of the Federal Reserve's interest rate meeting on the real interest rate curve and the US dollar index. If the policy tone is dovish, precious metals may continue to rebound technically; if the statement is hawkish, it is necessary to guard against the risk of a correction. The current upper pressure range focuses on the 3397-3407 area, and the lower support band is in the 3360-3350 range. It is recommended to take the buying on dips strategy as the main strategy, and cooperate with the rebound high point short selling operation as a risk hedge.
Operation strategy:
1. It is recommended to go long in the 3366-3361 area for gold, with a stop loss at 3356 and a target of 3381-3411.
2. For gold, it is recommended to short in the 3415-3420 area, with a stop loss at 3427 and a target of 3355-3385.

GOLD UPDATEHello friends✌
As you can see, after a sharp price drop, gold has entered a range that has formed a double top pattern that warns us of a continued price drop, so be careful🔊📈
*Trade safely with us*

The volatile decline in gold is in line with expectations!Technical analysis of gold: After rising and falling, gold has a large downward space, from 3438 to the current 3360, up and down close to 78 US dollars. Under this change, we should pay attention to whether the long and short changes of gold will continue. From the perspective of cyclical performance, after three consecutive positive lines on the daily line, there is a high probability of a wave of adjustment space, and the intensity of this adjustment will not be small, and it is possible that the big negative line swallows the positive line and goes directly below 3300. If it comes out like this, then it can be said that it is difficult for gold to rise this week. On Thursday and Friday, it may fluctuate and fall or fluctuate at a high level.
From the perspective of the 4-hour cycle, a big negative line closed, covering the previous positive lines, and breaking the support of the 5-day and 10-day moving averages. This wave may continue to fall to the Bollinger middle rail near 3300, but if it is a high-level shock, the Bollinger middle rail is not broken, and it may rise again to the high point of 3430. Therefore, gold has experienced a big rise and fall in this cycle, and now it is possible to rise or fall. In the short-term cycle, we will first focus on the support effect of 3360-3350 under the weakness of the early trading. If it does not break, we can continue to be bullish. The upper target is 3400, and if the strength is strong, we will look at 3430.
Overall, the short-term operation strategy for gold today is to rebound and short, supplemented by callbacks. The upper short-term focus is on the 3400-3405 line of resistance, and the lower short-term focus is on the 3350-3300 line of support.
Short order strategy:
Strategy 1: Short 20% of the gold position in batches when it rebounds to around 3397-3400, stop loss 6 points, target around 3360-3330, and look at the 3300 line if it breaks;
Long order strategy:
Strategy 2: Long 20% of the gold position in batches when it pulls back to around 3300-3305, stop loss 6 points, target around 3330-3350, and look at the 3370 line if it breaks;

Gold: High - level Oscillation, Short - term Adjustment & StrateFrom the perspective of the daily chart trend of gold, after two consecutive days of strong rebounds, the price has pulled back, indicating significant selling pressure at higher levels and a need for a technical adjustment in the short term. Currently, the price has dropped back to around $3,400, which is the support area of the previously broken gap. If this level is breached, it may further test the $3,350 level. In terms of technical indicators, the RSI has retreated from the overbought zone, and the MACD red bars are shortening with signs of a potential death cross, suggesting a weakening of momentum. Additionally, the 5-day moving average has started to turn downward. If gold fails to regain the $3,440 level, it will confirm the formation of a short-term top.
Overall, gold is currently in a high-level consolidation phase. Without the impetus of new safe-haven factors, the adjustment is likely to continue. Despite the intensification of geopolitical risks, the current financial market is more inclined to focus on changes in global trade sentiment, which has diminished the appeal of traditional safe-haven assets such as gold. The long-term support for gold remains intact, but in the short term, it may be affected by the strength of the US dollar and the restoration of risk appetite.
For today's short-term trading of gold, the recommended strategy is to go long on pullbacks and go short on rebounds. In the short term, key resistance levels to watch are in the range of $3,405 - $3,430, and key support levels are in the range of $3,360 - $3,350.
Investment itself is not risky; it is only when investment is out of control that risks occur. When trading, always remember not to act on impulse. I will share trading signals every day. All the signals have been accurate without any mistakes for a whole month. No matter what gains or losses you've had in the past, with my help, you have the hope of achieving a breakthrough in your investment.
Intraday adjustment ends, follow up with low and long positions!📌Fundamentals:
1. The conflict between India and Pakistan shows signs of escalation
2. US-Houthi ceasefire agreement
3. The Fed’s interest rate decision dominates this week’s market
4. International trade situation disturbs market sentiment
5. Market sentiment and capital flow
📊Technical aspects:
Affected by the trade negotiations, gold reached a high of 3434 and came out of the 70 US dollar drop. It took advantage of the trend to follow up the short order and reached the target profit stop as scheduled! Then it fell back and went long again to reap profits. The daily line continued to close in the positive direction, and there was room for fallback and adjustment during the Asian session. However, the daily cycle did not support a sharp decline for the time being. The data during the day tended to be treated as shocks. Therefore, the bullish trend remained unchanged, and the support below was 3335. You can go long if it hits during the day. The short-term support is around 3360 and 3350. In terms of operation, it will continue to be low and long. When it stabilizes, it will go to 3410 or even near the high point. However, if the second test does not reach a new high, there may be a larger correction.
🎯Practical strategy:
Gold is long around 3350-55, looking at 3376 and 3410! If it is strong, go long based on the support of 3365-60!

Gold Price Analysis May 5The D candle cluster appears with the sellers still dominating. 3270 is still playing a key role in reversing the trend.
The h1 structure is creating a false break in the 70 zone and wants to continue falling in the corrective downtrend. Pay attention to the 3263 break zone in the European session, when breaking this zone, Gold will form an uptrend and the possibility of breaking the 3270 zone is very high. 3285 will be the next reaction zone when breaking 3270, then the Down wave of Gold will be broken. Gold can reach 3303 when there are retests to the support zones.
In the opposite direction, Gold does not break 3262 and continues to fall, it will be favorable for the downtrend and the possibility of forming a double top pattern and falling sharply is also quite high. The Trendline zone 3243 is considered an important support zone in the near future for the Gold price decline. Next, pay attention to the reaction zone of the daily support around 3225.

GOLD 45M CHART PATTERNChart Pattern: Descending Triangle
A Descending Triangle has formed on the 45-minute timeframe — a powerful bearish continuation pattern that reflects a battle between weakening buyers and increasingly aggressive sellers.
Key structure:
The triangle narrowed over time, indicating volatility compression and building pressure.
Pattern Psychology: As price continued to compress, sellers consistently undercut each bullish rally. Buyers held the line — until they couldn’t. The break below the support level marked the moment of surrender, triggering a wave of selling pressure and confirming the descending triangle’s bearish bias.
Resistance Level: Around $3,270
Post-breakdown, the previous support zone near $3,253–$3,270 has now become resistance. This level also aligns with:
The descending trendline from the pattern.
The recent retest zone where price attempted to recover but failed to break higher.
This area is now a critical ceiling — unless broken with force, it reinforces the bearish outlook and invalidates any short-term recovery attempts.
Target Point: $3,150
Based on the measured move technique, the target for this descending triangle is calculated by taking the vertical height of the triangle and projecting it downward from the breakout point.
Breakout Point: ~$3,265
Extended Target: With increased bearish momentum and no significant support until next structure, price is projected toward the key psychological and technical level of $3,150

3236 becomes the dividing line between long and shortGold 3243 is the watershed between long and short positions. As long as this point is not broken, shorting at highs is still the main theme. You can continue to arrange short positions based on the suppression of 3236. The 3195-3190 area below is an important support. If the market retreats to this area, you can consider going long based on the actual situation and seize the opportunity of long-short conversion.

Gold Price Analysis May 7Yesterday's D1 candle continued to be a FULL candle with a 100 price increase. At the beginning of the day, the market opened with a bearish price gap, showing that the market also wants to cool down and today.
Gold is sideways in the range and is running a corrective downtrend.
The support zone for BUY strategies is around 3371, this is the EMA 34 of the h1 frame and is partially supported by the trendline. The next notable area is 3352, which is the old candle wick area and also the support area of yesterday's European session.
The two SELL areas are around 3402 and the Gap opening area is 3423.

Is Gold Ready to Break the High… Again?On the Daily timeframe , the seller’s level at 3366.900 , formed by the April 22nd bar, was broken by strong buying pressure and is currently being retested from above.
On the Hourly chart , I’m observing a bullish wide-spread bar with the highest volume, which also broke through the 3366.900 level.
📈This bar has its own test at 3349.745, which supports the bullish bias for now.
As long as this level holds, I expect the long scenario to remain valid.
Overhead, there is resistance from sellers at 3404.761 .
If price breaks above it, the next upside targets are:
🎯 3438.708
🎯 3500.120
#TechnicalAnalysis #DayTrading #VSA #XAUUSD #GOLD # #FuturesTrading #VolumeSpreadAnalysis

Will gold prices rise again this week?As the US dollar is approaching the key middle track of the daily line, it is not far away. In the next two days, it is expected to end the rebound correction and continue to start a weak trend decline. Therefore, gold may also have a short-term bottom at any time in the next two days. The next step is to wait for a wave of pullback. At least the bottom low point of the previous convergence triangle of 3260-3270 will be tested and confirmed. After the test, if it cannot stand under pressure, there may be a second bottom test, a secondary low point or a double bottom, and then finally start a unilateral rise all the way; of course, if 3200 is not the low point of tonight, and the lower shadow of the daily closing is short, then it may be necessary to test the last 3175 position before determining the short-term bottom;

xauusdWhat do you think of this idea? What is your opinion? Share it in the comments📄🖌
If you like the idea, please give it a like. This is the best "Thank you!" for the author

XAUUSD 3265: Bull-Bear Lifeline! Next Week's Trend PredictionFrom a daily chart perspective, overnight, the price of gold rebounded after hitting the bottom and closed with a bullish candlestick 🌞. However, on the 1-hour chart, the moving averages of gold have formed a bearish crossover pattern and are arranged in a downward trend for bears 📉. Moreover, this pattern will eventually continue to diverge downward. Currently, the price of gold has been suppressed and pulled back near the level of 3265 ⚠️. It can be seen from this that the area around 3265 will still be a crucial turning point determining the bull-bear trend of the gold price next week ⚡. Join 👉
In the latter part of the night, although the price of gold rebounded to some extent, compared with the previous decline range, the rebound strength is indeed limited 📉↗️. Looking ahead to next week, if the gold price fails to break through the resistance near 3265, then the market will most likely only maintain a volatile pattern at best, and it is less likely for the bulls in the gold market to achieve a direct reversal in the short term 📊. Investors should focus on the resistance at 3265 above and the strong support at the key level of 3195 below 🔍.
Join 👉
Accurate signals are updated every day 📈 If you encounter any problems during trading, these signals can serve as your reliable guide 🧭 Feel free to refer to them! I sincerely hope they'll be of great help to you 🌟 👇

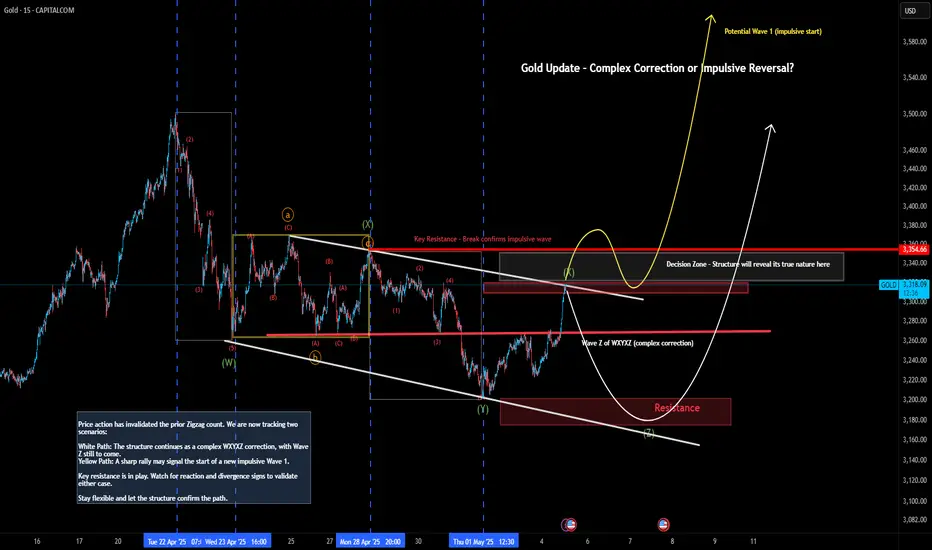
Gold Update – Complex Correction or Impulsive Reversal?
Price action has invalidated the prior Zigzag count. We are now tracking two scenarios:
White Path: The structure continues as a complex WXYXZ correction, with Wave Z still to come.
Yellow Path: A sharp rally may signal the start of a new impulsive Wave 1.
Key resistance is in play. Watch for reaction and divergence signs to validate either case.
Stay flexible and let the structure confirm the path.
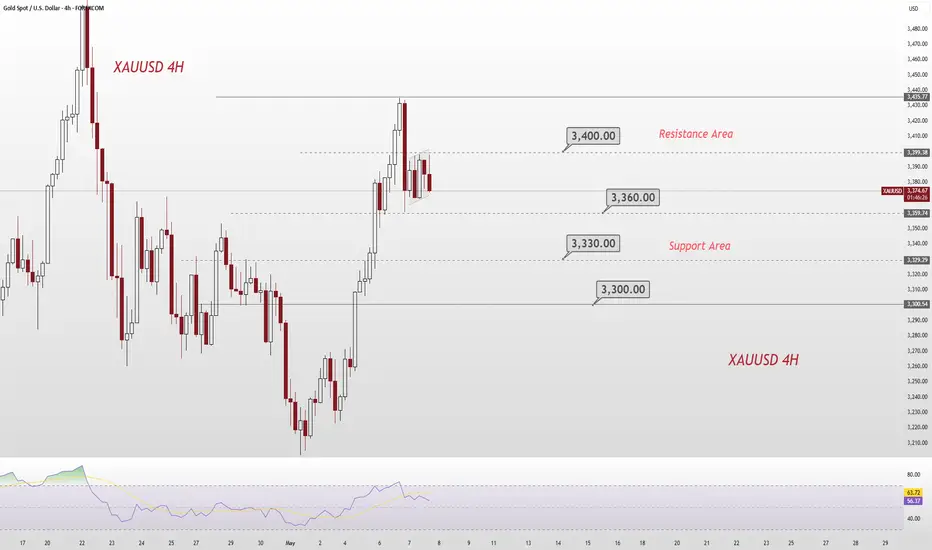
GOLD 05/01/2025Scenario GOLD TF H4
- Stick to your stop loss to protect your trades
- Manage your positions patiently until you hit the target
- Profit always in risk, take the risk or lose the chance

Gold still has the potential to extend to 3420-3430.Fundamentals:
Focus on the Fed's interest rate decision;
Technical aspects:
Gold rose to 3397 and encountered resistance and fell back, and the bulls' momentum was insufficient. But I think the gold bulls are far more than that. Gold is bound to hit 3400, and even continue to the 3420-3430 area; since gold rebounded after hitting 3200, it has repeatedly built a solid bottom structure support below, and the oscillating rise has effectively supported the continued rebound of gold. As the center of gravity of gold moves up, the support structure also gradually moves up. The current short-term support is in the area around 3380-3370, and the second is in the area of 3365-3355.
Trading situation:
According to today's trading strategy: Go long on gold at 3350 in the morning and around 3375 in the afternoon. In order to lock in profits in time, manually close orders at 3366 and 3394 respectively. Today, the total profit in gold long transactions exceeded 360pips.
Trading strategy:
During the rising shock, there are profit opportunities for both long and short parties in some areas, but currently, overall, bulls have the advantage and are mainly long gold. Consider the opportunity to go long when gold falls back to the area around 3380-3370, TP: 3400.
