3236 becomes the dividing line between long and shortGold 3243 is the watershed between long and short positions. As long as this point is not broken, shorting at highs is still the main theme. You can continue to arrange short positions based on the suppression of 3236. The 3195-3190 area below is an important support. If the market retreats to this area, you can consider going long based on the actual situation and seize the opportunity of long-short conversion.
GOLD trade ideas

GOLD 45M CHART PATTERNChart Pattern: Descending Triangle
A Descending Triangle has formed on the 45-minute timeframe — a powerful bearish continuation pattern that reflects a battle between weakening buyers and increasingly aggressive sellers.
Key structure:
The triangle narrowed over time, indicating volatility compression and building pressure.
Pattern Psychology: As price continued to compress, sellers consistently undercut each bullish rally. Buyers held the line — until they couldn’t. The break below the support level marked the moment of surrender, triggering a wave of selling pressure and confirming the descending triangle’s bearish bias.
Resistance Level: Around $3,270
Post-breakdown, the previous support zone near $3,253–$3,270 has now become resistance. This level also aligns with:
The descending trendline from the pattern.
The recent retest zone where price attempted to recover but failed to break higher.
This area is now a critical ceiling — unless broken with force, it reinforces the bearish outlook and invalidates any short-term recovery attempts.
Target Point: $3,150
Based on the measured move technique, the target for this descending triangle is calculated by taking the vertical height of the triangle and projecting it downward from the breakout point.
Breakout Point: ~$3,265
Extended Target: With increased bearish momentum and no significant support until next structure, price is projected toward the key psychological and technical level of $3,150

Gold might be busy with wave b for abc correction. If we only pullback to fib level between 50 - 68%, and get bearish confirmation we might start with leg C. But is also possible that if we go past ATH we might be busy with Wave 5.

Gold Price Analysis May 7Yesterday's D1 candle continued to be a FULL candle with a 100 price increase. At the beginning of the day, the market opened with a bearish price gap, showing that the market also wants to cool down and today.
Gold is sideways in the range and is running a corrective downtrend.
The support zone for BUY strategies is around 3371, this is the EMA 34 of the h1 frame and is partially supported by the trendline. The next notable area is 3352, which is the old candle wick area and also the support area of yesterday's European session.
The two SELL areas are around 3402 and the Gap opening area is 3423.

Is Gold Ready to Break the High… Again?On the Daily timeframe , the seller’s level at 3366.900 , formed by the April 22nd bar, was broken by strong buying pressure and is currently being retested from above.
On the Hourly chart , I’m observing a bullish wide-spread bar with the highest volume, which also broke through the 3366.900 level.
📈This bar has its own test at 3349.745, which supports the bullish bias for now.
As long as this level holds, I expect the long scenario to remain valid.
Overhead, there is resistance from sellers at 3404.761 .
If price breaks above it, the next upside targets are:
🎯 3438.708
🎯 3500.120
#TechnicalAnalysis #DayTrading #VSA #XAUUSD #GOLD # #FuturesTrading #VolumeSpreadAnalysis

Will gold prices rise again this week?As the US dollar is approaching the key middle track of the daily line, it is not far away. In the next two days, it is expected to end the rebound correction and continue to start a weak trend decline. Therefore, gold may also have a short-term bottom at any time in the next two days. The next step is to wait for a wave of pullback. At least the bottom low point of the previous convergence triangle of 3260-3270 will be tested and confirmed. After the test, if it cannot stand under pressure, there may be a second bottom test, a secondary low point or a double bottom, and then finally start a unilateral rise all the way; of course, if 3200 is not the low point of tonight, and the lower shadow of the daily closing is short, then it may be necessary to test the last 3175 position before determining the short-term bottom;

xauusdWhat do you think of this idea? What is your opinion? Share it in the comments📄🖌
If you like the idea, please give it a like. This is the best "Thank you!" for the author

XAUUSD 3265: Bull-Bear Lifeline! Next Week's Trend PredictionFrom a daily chart perspective, overnight, the price of gold rebounded after hitting the bottom and closed with a bullish candlestick 🌞. However, on the 1-hour chart, the moving averages of gold have formed a bearish crossover pattern and are arranged in a downward trend for bears 📉. Moreover, this pattern will eventually continue to diverge downward. Currently, the price of gold has been suppressed and pulled back near the level of 3265 ⚠️. It can be seen from this that the area around 3265 will still be a crucial turning point determining the bull-bear trend of the gold price next week ⚡. Join 👉
In the latter part of the night, although the price of gold rebounded to some extent, compared with the previous decline range, the rebound strength is indeed limited 📉↗️. Looking ahead to next week, if the gold price fails to break through the resistance near 3265, then the market will most likely only maintain a volatile pattern at best, and it is less likely for the bulls in the gold market to achieve a direct reversal in the short term 📊. Investors should focus on the resistance at 3265 above and the strong support at the key level of 3195 below 🔍.
Join 👉
Accurate signals are updated every day 📈 If you encounter any problems during trading, these signals can serve as your reliable guide 🧭 Feel free to refer to them! I sincerely hope they'll be of great help to you 🌟 👇

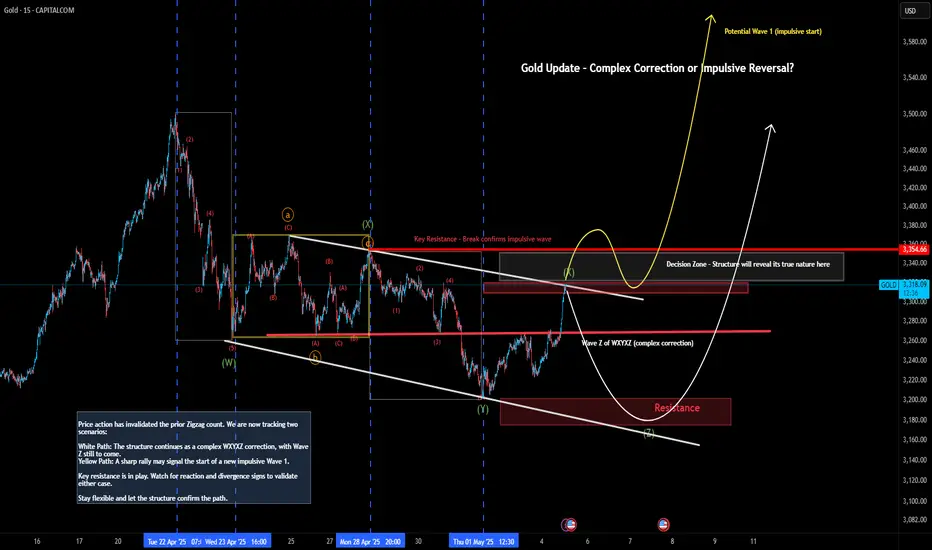
Gold Update – Complex Correction or Impulsive Reversal?
Price action has invalidated the prior Zigzag count. We are now tracking two scenarios:
White Path: The structure continues as a complex WXYXZ correction, with Wave Z still to come.
Yellow Path: A sharp rally may signal the start of a new impulsive Wave 1.
Key resistance is in play. Watch for reaction and divergence signs to validate either case.
Stay flexible and let the structure confirm the path.
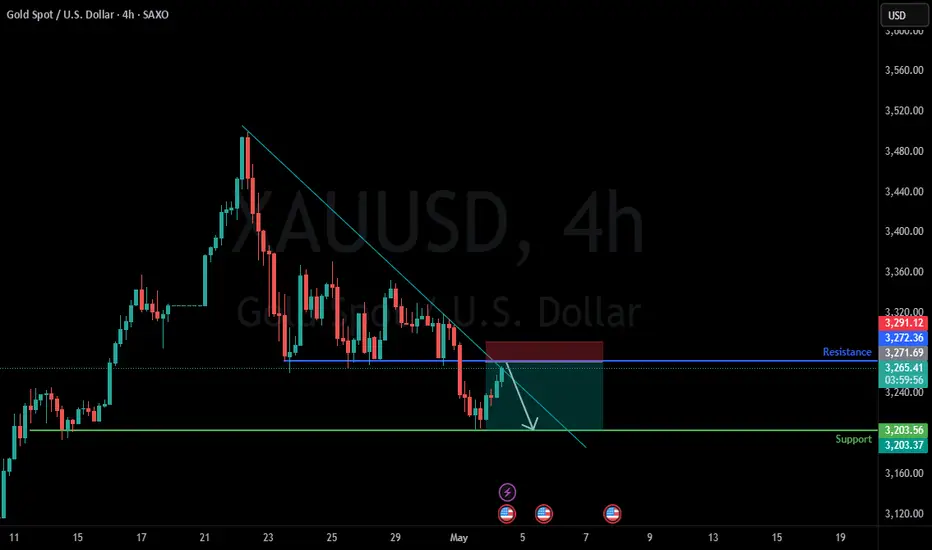
GOLD 05/01/2025Scenario GOLD TF H4
- Stick to your stop loss to protect your trades
- Manage your positions patiently until you hit the target
- Profit always in risk, take the risk or lose the chance

Gold still has the potential to extend to 3420-3430.Fundamentals:
Focus on the Fed's interest rate decision;
Technical aspects:
Gold rose to 3397 and encountered resistance and fell back, and the bulls' momentum was insufficient. But I think the gold bulls are far more than that. Gold is bound to hit 3400, and even continue to the 3420-3430 area; since gold rebounded after hitting 3200, it has repeatedly built a solid bottom structure support below, and the oscillating rise has effectively supported the continued rebound of gold. As the center of gravity of gold moves up, the support structure also gradually moves up. The current short-term support is in the area around 3380-3370, and the second is in the area of 3365-3355.
Trading situation:
According to today's trading strategy: Go long on gold at 3350 in the morning and around 3375 in the afternoon. In order to lock in profits in time, manually close orders at 3366 and 3394 respectively. Today, the total profit in gold long transactions exceeded 360pips.
Trading strategy:
During the rising shock, there are profit opportunities for both long and short parties in some areas, but currently, overall, bulls have the advantage and are mainly long gold. Consider the opportunity to go long when gold falls back to the area around 3380-3370, TP: 3400.

Gold has rebounded in place, go high today firstAfter the gap at 3438 in the early trading, the market crashed and plunged. So far, the long target of 3440 has been achieved! China and the United States are preparing for tariff talks, which is a major negative. Spot gold plunged more than 60 US dollars from 3438 US dollars in the early trading, and it should have reached the top within the day; if there is no major positive push, the early high of 3438 should not be broken again, otherwise once it breaks through 3500, it will definitely break, but it is unclear how far it will go above 3500. At present, while paying attention to the Sino-US tariff talks, the global geopolitical situation should also be focused on: the focus is on the India-Pakistan conflict, the population of the two countries is close to 1.7 billion, and it will be terrible if the situation gets out of control; then the Russia-Ukraine stalemate, the US-Iran crisis, etc. are positive for spot gold, and the Federal Reserve's interest rate decision tomorrow morning also needs to be paid attention to. Today, China announced the spot gold reserve data. Long and short news hit the market in turn, and it is expected that there is a high probability of continued large sweeps within the day, and the overall trend is short within the day! The market fluctuates greatly and the rhythm is fast. There are opportunities for both long and short positions, and strict loss-taking operations! The first resistance above is the 3405 area, then the 3415-20 area and the early high of 3438 area, which can be used to short spot gold; the support below is 3350-55, then 3320-25

Has the road to gold adjustment begun?Gold has reached a high of around 3404, so this position can be used as an important pressure point. In this continuous upward trend, once there is a sharp decline, it is likely to be a signal that the short-term bulls have peaked. Then we need to consider whether the bears can reverse, and the current upper pressure point is also the high point of the last wave of pullback near 3393, and the lower support is at 3360.
Trading idea: short near 3387, sl: 3400 tp: 3370

Daily live trade with XAUUSD in 15m/30m/1h 20250505Daily live trade with XAUUSD in 15m/30m/1h 20250505

XAUUSD correcting to its 4H MA200.Gold (XAUUSD) has been trading within a Bullish Megaphone pattern since the start of the year. Last week's rejection on its top (Higher Highs trend-line) has resulted into a break below the 4H MA50 (blue trend-line).
This has technically been the signal that started the previous 2 Bearish Legs, which both bottomed upon touching the 4H MA200 (orange trend-line) and once the 4H RSI got oversold below 30.00.
As a result, we expect more downside, targeting 3160.
-------------------------------------------------------------------------------
** Please LIKE 👍, FOLLOW ✅, SHARE 🙌 and COMMENT ✍ if you enjoy this idea! Also share your ideas and charts in the comments section below! This is best way to keep it relevant, support us, keep the content here free and allow the idea to reach as many people as possible. **
-------------------------------------------------------------------------------
💸💸💸💸💸💸
👇 👇 👇 👇 👇 👇

Buy@3200With gold approaching the crucial 3,195 support mark, let's wait for the rebound.
⚡️⚡️⚡️ XAUUSD ⚡️⚡️⚡️
🚀 Buy@3200
🚀 TP 3240 - 3260
Accurate signals are updated every day 📈 If you encounter any problems during trading, these signals can serve as your reliable guide 🧭 Feel free to refer to them! I sincerely hope they'll be of great help to you 🌟

XAU/USD Breakdown: Bears in Command
Current Bias: Bearish
Market Structure: Lower highs and lower lows forming post recent peak near $3268.05.
Price Action: Gold recently broke below a key support zone around $3268.05,
Trade Setups
📉 Bearish Setup (Primary Bias)
Entry: On rejection at $3256.24 or a break/retest of $3268.05
Stop Loss: $3272.67
Take Profit:
TP1: $3193.97
TP2: $3102.09
TP3: $3047.62
capital: $50
risk: $46(-96%)
reward: $380(+250%)

XAUUSD FLIP?With recent negotiations between Ukraine and the US i think yesterday reaction on Gold was a good indication that the dollar may seem more interesting at the moment maybe that's why we had heavy selling yesterday. My bias is that we might see more down side to Gold.
XAU/USD:Short-term range tradingThe international geopolitical situation has suddenly escalated, triggering market risk aversion and pushing up the price of gold. Today's interest rate decision of the Federal Reserve and Powell's speech will dominate the trend of the bullish and bearish sides. During the Asian trading session, the price of gold has fluctuated sharply. Be wary of a significant pullback after a moderate rise. If the key resistance level of $3400 cannot be broken, the probability of a short-term peak will increase greatly.
In terms of operation, avoid chasing high prices. Focus on the impact of the interest rate meeting on the real interest rate and the US dollar index. Buy on dips within the range of $3360-$3400 and sell at high levels to hedge risks.
I am committed to sharing trading signals every day. Among them, real-time signals will be flexibly pushed according to market dynamics. All the signals sent out last week accurately matched the market trends, helping numerous traders achieve substantial profits. Regardless of your previous investment performance, I believe that with the support of my professional strategies and timely signals, I will surely be able to assist you in breaking through investment bottlenecks and achieving new breakthroughs in the trading field.

New York market XAUUSD trading opportunities.The 3400 position has been broken. Short-term bulls are still strong. The swing buying we executed all day today has made continuous profits. Such one-sided market conditions in trading have good profits. But the premise needs to be executed. This requires execution and courage.
Teacher Ludvig pointed out that the probability of reaching the target 3440 before tomorrow's London market is more than 90.36%. So this is a good buying opportunity for traders who don't know how to trade now.
The precise trading points are released in the Swing Trading Center. If you don't know what to trade now. Then you can refer to it.
Control trading risks according to the capital situation when trading.

There's still a little more left to sip from gold’s cup
Weekly Outlook on Gold (XAUUSD)
Gold has formed a classic cup pattern on the weekly timeframe, indicating a strong bullish continuation setup. If the pattern completes successfully, we could see a move toward the top of the channel, targeting the 4039 – 4100 zone.
The recent pullback to 3208 was a retest of the previously broken daily structure, acting as a healthy correction before the next potential leg up.
For those looking to enter this move, an ideal strategy would be to place a buy stop order above the last high, as a breakout confirmation.
⚠️ Important note: If the black trendline on the daily chart (which represents the current bullish structure) gets broken to the downside, the trade setup would become invalid and a reassessment would be required.
✅ The best approach is to wait for a clean breakout above the 3495 resistance, then look for a pullback entry on lower timeframes with proper risk management.
📉 In the longer term, we still expect a potential retracement all the way back to the 2199.661 level — so be aware of the bigger picture and adapt as the structure evolves.

XAU/USD... gold 1h chart pattern.Technical Analysis
1. Trend Overview:
Uptrend Momentum: The market is currently showing bullish strength. The price has broken above key resistance levels, confirming upward momentum.
Higher Highs and Higher Lows: A structure of higher highs and lows supports the uptrend scenario.
2. Entry Point: 3313
This level may have been a breakout point or a retracement zone (e.g., 38.2% or 50% Fibonacci level) acting as a confirmation of bullish continuation.
If volume increased at this level, it adds confidence to the entry.
3. Target Point: 3500
The target suggests an upside potential of +183 pips, which is significant.
This level might align with a major resistance zone or a psychological round number.
4. Support and Resistance Zones:
Immediate Support: 3313 (entry), followed by 3280 and 3250.

Gold Rejection at Channel Resistance – Bearish Setup in Play"
🔍 Analysis Summary
Current Price: \~\$3,266
Indicators:
EMA 50 (Red): \~\$3,277 – price is slightly below this level
EMA 200 (Blue): \~\$3,180 – acts as a dynamic support
Trend Structure:
Previous Uptrend: Sharp bullish move within a rising wedge (now broken)
Current Pattern: Descending channel or flag-like consolidation after the strong bullish trend
Support Level: \~\$3,175–\$3,180 (highlighted zone with green arrows showing bounce)
Resistance Level (Target 1): \~\$3,277–\$3,300
Target Point: \~\$3,356
📈 Bullish Scenario:
Price bounced off strong support (around EMA 200 + horizontal level).
If price breaks above the descending channel and retests resistance, it could aim for **Target 1 (\~3,300) and possibly reach **Target Point (\~3,356)**.
📉 Bearish Scenario:
Failure to break above descending channel resistance could lead to a retest of the support zone.
If support breaks, the next possible stop could be below the EMA 200, triggering deeper correction.
🧠 Trading Idea
Buy Entry: On confirmed breakout above descending channel.
Target 1: \~3,300
Target 2: \~3,356
Stop Loss: Below \~3,175 support
