GOLD trade ideas

XauUsd bullish outlook✅ Reasons for Entry:
✅ Third Touch on H4 Extreme Trendline confirms clean anchor & rejection
✅ Strong RBS zone at 3235 — previously supported upward impulsive move
✅ Visible demand rejection wicks on H1 and M15 — signs of buyer defense
✅ Bullish market structure still intact on D1 (trend continuation bias)
✅ Extreme Trendline + Structure + Rejection = High-probability setup
Auto Generated by Custom Smart Trading Chart AI

XAU/USD 4hAs usual, the market is ttracted toward either the support level or the target. It gravitates to one or the other. Once the first “orbit” is left, the price is attracted to the other. Here, we can see that the price remains under the influence of the support level, and the rejection of the bullish-target deviation (pale purple line) is clearly visible.
Since the downtrend is accompanied by strong volume (the blue dot candle), the bearish scenario prevails. The optimal point to enter a short position is at the bullish deviation (gray line), with a bearish target currently around 3,164.

Summary of the Gold Market This WeekThis week, the gold market showed a clear downward trend, with spot gold accumulating a 2.43% decline.👉👉👉
The economic data had a significant impact on the gold market this week. Data released by the US Department of Labor on the 2nd showed that the non - farm payroll employment in the US increased by 177,000 in April, much better than the expected 138,000, and the growth data for the previous two months were revised downwards. The US unemployment rate was 4.2% in April, in line with market expectations. The strong non - farm payroll data reduced the possibility of the Federal Reserve cutting interest rates in June. Under normal circumstances, the reduction in the interest rate hike expectation should be bullish for gold. However, the gold market did not rise sharply this time, mainly because the gold price had risen significantly in the early stage and the long - term investors had a strong sentiment of taking profits. At the same time, the relatively good employment data also reflected the resilience of the US economy to a certain extent, weakening the appeal of gold as a safe - haven asset. As a result, the gold price did not show an obvious upward trend immediately after the data was released. Instead, it remained volatile in the short term.
From a technical perspective, although the gold price has declined this week, the futures price still has certain technical advantages in the near term. On the daily chart, although a negative candlestick was recorded this week, the previous upward trend has made the moving average system still show a long - term arrangement. From the perspective of the RSI, the current value is hovering around 50, indicating that the market's long and short forces are temporarily relatively balanced, and neither side has an obvious advantage. Therefore, the gold price has entered a consolidation stage.
With the economic development in Asia and the changes in consumers' demand for gold investment and jewelry, Asia's influence in the global gold market has become increasingly prominent. If the demand in Asia remains strong in the future, it will provide strong support for the gold price. On the contrary, if the demand weakens, it may increase the downward pressure on the gold price.
Looking ahead to next week, the gold market still faces many uncertainties. On the one hand, the continuous changes in economic data and the direction of the Federal Reserve's monetary policy remain key factors. If the subsequently released data continue to show the resilience of the US economy, it may further reduce the market's expectation of a rate cut by the Federal Reserve, thereby suppressing the gold price. On the other hand, any new development in the international trade situation may trigger fluctuations in the market's risk - averse sentiment, thus affecting the supply - demand relationship and price trend of gold.

GOLD UNDER PRESSURE – Is a Massive Drop Coming?Gold (XAU/USD) has just tapped into a major supply zone around the $3,390 - $3,450 level and is showing signs of rejection with a sharp 1.16% drop.
Key Highlights:
Price: $3,391.220
Bearish Rejection observed at the supply zone (marked in blue), indicating potential downside.
Volume Profile shows heavy distribution in this zone, suggesting strong institutional selling.
First Major Support sits around $3,200, which aligns with historical structure and demand interest.
If broken, expect further decline towards $3,043, and possibly $2,626 in an extended correction.
What To Watch:
Red Arrows indicate possible drop zones if supply dominance continues.
Price needs to hold above $3,390 to regain bullish strength, otherwise, we’re looking at a correction.
Keep an eye on U.S. economic news (marked with flag) that could add volatility.
My Take:
We are in a potential distribution phase. If momentum fails to break above the current supply zone, gold could retrace deeply. The $3,200 level is critical — break it, and the bears will feast.
---
Like, share, and follow if you want more real-time technical breakdowns like this!
Drop your thoughts below — Is gold going back to $3,000? Or will the bulls surprise us again?

XAUUSD UP OR DOWN?My analysis outlines a common technical trading strategy based on order blocks and market structure shifts (MSS) in XAUUSD (gold vs USD). Here's a breakdown and a more structured interpretation of what you might be saying:
🟨 Technical Analysis Summary:
Order Block Identified at 3340.00 (1H Timeframe):
This is likely a bearish or bullish order block, where institutions previously placed large orders.
Price is expected to react at this level (likely resistance or support, depending on context).
Need to Observe Market Structure Shift (MSS) on Lower Timeframes:
You're waiting for a confirmation (e.g., a break of structure or BOS) on a 15M or 5M chart before entering a position.
This is a confirmation strategy to avoid false reactions.
Potential Retracement to 3260.00:
This may be a liquidity grab or the lowest point (swing low) before the next upward move.
Implies you're expecting a bullish reversal from that zone after an MSS.

0507 Watch out! Gold is cooling down for the news of..Hello traders,,
The resumption of china-us economic and trade talks is imminent, and the risk aversion in the gold market has cooled.
Gold stop rising and opened with a gap on Wednesday Asia morning !
On 4H chart, this strong bearish red candle is a strong reversal signal!
Looking for a new ABC swing trend for GOLD .
3267 is a recent breaking through level which now become a support for gold .
The next support would be 3202 where gold stop dropping since 1 day before NFP.
For a short-time 4H swing trader, could take a chance to follow this new swing down to those two levels.
GOOD LUCK!
LESS IS MORE!

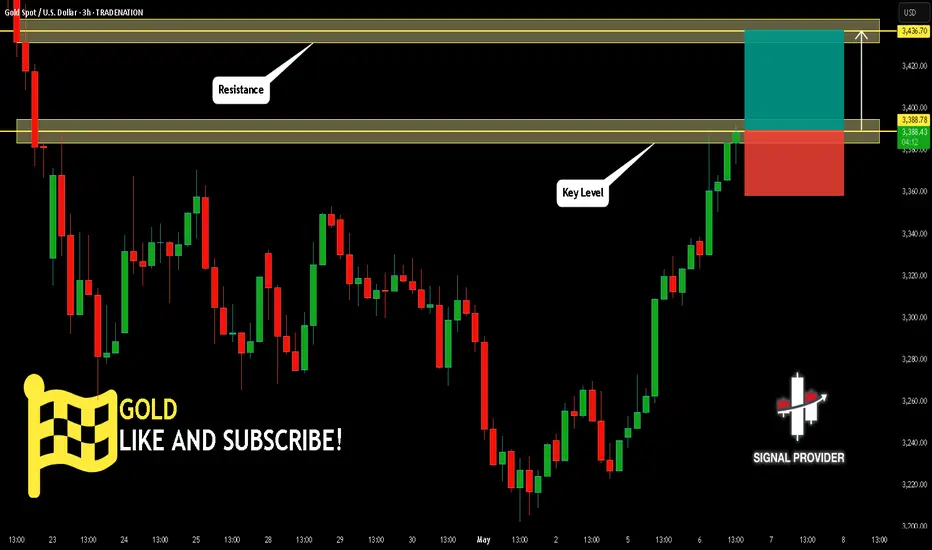
GOLD Will Go Up! Long!
Take a look at our analysis for GOLD.
Time Frame: 3h
Current Trend: Bullish
Sentiment: Oversold (based on 7-period RSI)
Forecast: Bullish
The market is testing a major horizontal structure 3,388.78.
Taking into consideration the structure & trend analysis, I believe that the market will reach 3,436.70 level soon.
P.S
The term oversold refers to a condition where an asset has traded lower in price and has the potential for a price bounce.
Overbought refers to market scenarios where the instrument is traded considerably higher than its fair value. Overvaluation is caused by market sentiments when there is positive news.
Disclosure: I am part of Trade Nation's Influencer program and receive a monthly fee for using their TradingView charts in my analysis.
Like and subscribe and comment my ideas if you enjoy them!
Swing Trading/XAUUSDband trading strategy points out. XAUUSD can be bought on the left side, TP3330-3350.
Aggressive traders can buy at the current price. Conservative traders can wait until the price retreats to around 3300 or below before buying.
The Swing Trading Strategy Center continues to announce trading opportunities. Stay tuned.

Gold (XAUUSD) - Bullish Breakout from Bearish Pennant | 4H ChartTechnical Analysis: On the 4-hour chart, Gold has completed a bullish breakout from a Bearish Pennant formation, defying its typical continuation pattern to the downside. This breakout is supported by a strong bullish candlestick close above both the pennant's upper boundary and the Ichimoku Cloud, indicating a potential trend reversal and shift in momentum.
Key Highlights:
Pattern: Bearish Pennant invalidated with bullish breakout.
Breakout Confirmation: Price closed above the upper resistance trendline and Ichimoku cloud.
Next Resistance Zone: Targeting 3,362 – 3,381 based on the measured move and price structure.
Support : Immediate support at 3,286 in case of a pullback.
Fundamental Context: Gold prices are rebounding amid renewed geopolitical concerns, weaker U.S. dollar performance, and increased central bank gold buying activity. This aligns with a short-term bullish narrative despite recent corrections. Any dovish signals from the Federal Reserve or weaker macroeconomic data could further fuel upward momentum.
Trend Outlook: Short-to-mid term trend is bullish following the breakout. Traders should look for bullish continuation signals and volume confirmation. A sustained move above 3,340 would further validate upside potential.
Must Support Me Share My Idea With Your Firends Mention Your Feed back Comment Section
Note: This is not financial advice. Please conduct your own research and manage risk accordingly.

Gold Pullback Incoming!Gold has struggled to break through its daily highs for the past week. I am looking for another push up to the $3360-$3370 range. If it fails to break that level again, we may see support levels around $3200 being retested. In my opinion, there is even potential for it to go lower. I'd love to hear your thoughts in the comments!
*Side note:* With the U.S. dollar falling in value and ongoing economic uncertainty, I believe gold has tremendous upside potential over the next 12-18 months. FX:XAUUSD

GOLD SELL ANALYSIS The $3266:$3267 sell zone for gold likely refers to a resistance level or a strategic price point where investors or traders are inclined to sell. Several factors could contribute to this sell zone:
- *Resistance Levels*: $3266:$3267 might be a key resistance area, where gold prices have historically faced selling pressure or struggled to break through.
- *Technical Analysis*: Traders may be using technical indicators, such as moving averages, Relative Strength Index (RSI), or Bollinger Bands, to identify $3266:$3267 as a selling opportunity.
- *Market Sentiment*: Shifts in market sentiment, driven by news, economic data, or geopolitical events, could lead to increased selling pressure around $3266:$3267.
- *Profit-Taking*: Investors might be looking to take profits at $3266:$3267, especially if they've seen significant gains in gold

From Tulips to Tech: The Evolution of Financial Bubbles 🎯 Introduction:
financial/economic bubbles are a recurring theme in economic history, this is often when a particular financial asset goes to unrealistic price levels often making money for early investors but usually these high price levels do not match their fundamental value this is then followed by a large public participation who also want a piece of the pie eventually with the price collapsing or sharply declining blowing or living investors in a large financial loss..
From 17th-century tulip gardens to 21st-century crypto manias, one thing has remained constant: Humans never learn.
Every generation thinks this time is different — but the pattern of bubbles keeps repeating.
Here's the crash course in 400 years of financial euphoria, panic, and pain.
🧠 Section 1: 1637 — Tulip Mania 🌷
The original bubble.
In the Netherlands, rare tulip bulbs were worth more than houses.
Prices exploded... then collapsed 90% in a matter of weeks.
Lesson: Speculation + FOMO is not new. Humans were flipping flowers before they flipped crypto.
Mini Nerd Tip:
"When people stop caring about value and only care about price rising, watch out."
🧠 Section 2: 1720 — South Sea Bubble 📜
Britain’s South Sea Company promised massive profits trading with South America (but barely did any business).
Politicians and aristocrats pumped the stock price.
Collapsed spectacularly → ruined many fortunes (including Isaac Newton himself:
"I can calculate the motion of heavenly bodies, but not the madness of men.")
Mini Nerd Tip:
"If a bubble needs government help to stay alive, it's already dying."
🧠 Section 3: 1929 — Wall Street Crash 🏛️
Roaring 20s: endless optimism, cheap margin loans, "stocks only go up!"
1929: Stock market crashed, triggering the Great Depression.
People were buying stocks with 10% down and gambling recklessly.
Mini Nerd Tip:
"When leverage is everywhere, the smallest panic causes waterfalls."
🧠 Section 4: 2000 — Dotcom Bubble 💻
Everyone thought the internet would change everything (it did — but slower and differently).
Companies with no profits were valued in billions.
"Eyeballs" were treated as real revenue.
NASDAQ lost 78% from top to bottom.
Mini Nerd Tip:
"Innovation creates real value... but hype inflates fake value faster."
🧠 Section 5: 2008 — Housing Bubble 🏡
Banks handed out mortgages to anyone.
Financial engineering (CDOs, synthetic MBS) created the illusion of safety.
US housing prices collapsed → global financial crisis.
"Too Big to Fail" became the famous phrase.
Mini Nerd Tip:
"If everyone is getting rich easily, someone is lying or blind."
🧠 Section 6: 2017/2021 — Crypto & Meme Stocks 🚀
Gamestop, Dogecoin, NFTs, Shiba Inu — the wildest "everyone’s a genius" market since the 1920s.
Social media + free apps = amplified bubble speed.
Massive rises, insane collapses.
Mini Nerd Tip:
"Technology changes, human emotion doesn’t."
🧠 Final Section: Why Bubbles Will Never End
Greed, fear, and FOMO are timeless.
Every era dresses up bubbles in new clothes (flowers, sea companies, internet, crypto).
Smart traders understand this pattern — and use it to survive and thrive.
"**Bubbles don't pop because of bad assets. They pop because confidence disappears
put together by : Pako Phutietsile as @currencynerd
courtesy of : @TradingView

Gold 1H Outlook - XAUUSD May 4th 2025🔥 XAUUSD – H1 Outlook | May 4, 2025
Bias: ⚠ Short-term neutral to bearish — price reacting from a weak CHoCH + premium rejection.
Flow: Intraday trapped between 3240 demand and 3280–3300 supply. Next move decides the breakout.
🔎 Market Structure:
❗ Clean CHoCH + BOS sequence from 3285 → confirms bearish LTF momentum
🟠 Current HL attempt rejected off imbalance around 3268–3275
🔹 Structure still building under H4 LH (3315), supply remains in control unless flipped
🗝 Key H1 Levels (with confluence):
🔵 3233–3244 → Micro OB + FVG Support
🔄 Key short-term HL zone
⚡ RSI oversold bounce last touch
EMA5/21 zone → bounce risk
🟡 3268–3275 → FVG + OB + Last CHoCH Zone
🚩 This is the first sell POI
💧 Liquidity just above (equal highs)
Ideal for LTF short scalp if price rejects again
🔺 3288–3302 → H1–H4 Confluence Supply
🔥 Strong bearish OB + liquidity sweep area
🧱 Reaction zone for swing shorts (supply locked)
Confluence with premium fib retracement
🔻 3190–3200 → Extreme Demand Zone
🧲 Weak low + imbalance + discount OB
🔑 Watch for possible NY reversal trap if price collapses
💡 Plan:
We’re in the battlefield between weak HLs and greedy supply zones.
If 3275 rejects again → scalp sells back to 3240.
If 3240 fails → 3200 could be the "trap long" to flip everything.
🧠 Final Note:
Patience beats precision. Let the chart show its cards — no need to guess when liquidity does the talking.
🙏 Like this breakdown? Boost and follow us for sniper setups all week.
📌 Important Notice!!!
The above analysis is for educational purposes only and does not constitute financial advice. Always compare with your plan and wait for confirmation before taking action.
#XAUUSD #GoldOutlook #SMC #LiquidityHunt #SmartMoneyFlow

XAUUSD needs correction then dropAs Market is on selling pressure
Bearish scanario :
-if market give closing below 3190-3180 then ready for the next Drop towards 3145then 3130.
Bullish scanario :
-if candles remains above( close with body of candle)3190-3200 then owards targets will be 3335 then 3350 target .
Expecting the rise again to 3235 then Drop.
-On WEEKLY AND MONTHLY IM ON BEARISH SIDE TILL $2980!
Read the commentary carefully and understand the Dynamics.

Will gold's decline continue?A big negative line closed, covering the previous positive lines, and broke the support of the 5-day and 10-day moving averages. This wave may continue to fall to the Bollinger middle rail near 3300, but if it is a high-level shock, the Bollinger middle rail is not broken, and it may rise again to 3430. Therefore, gold has experienced big ups and downs in this cycle, and now it is possible to rise or fall. In the short cycle, pay attention to the support effect of 3355 under weakness. If it does not break, you can continue to be bullish. Investment strategy: Gold 3350 long, stop loss 3338, target 3450

With the Federal Reserve on hold, gold is ushering in a new engi
At 2 pm yesterday, the Federal Reserve announced that it would keep the benchmark interest rate unchanged at 4.25%-4.50%, in line with market expectations, and remained unchanged for the third consecutive meeting. After the announcement of the Fed's interest rate decision, the market continued to believe that the Fed would cut interest rates before July, and still expected three rate cuts this year.
Then Fed Chairman Powell downplayed any impression that the central bank would use interest rate cuts to ease the economic weakness caused by Trump's tariff policy at a press conference in the early morning.
Powell used the word "wait" 22 times to emphasize that the Fed is not in a hurry. He said: "We think the cost of waiting is quite low, so we are doing it."
Powell said: "In this case, we can't take the initiative because we don't actually know what the correct response to the data is until we see more data."
Powell hinted that the Fed will only cut interest rates after seeing evidence of a significant slowdown in the economy, and it may cut interest rates soon.
Returning to the market, first of all, from the gold daily chart, it can be seen that the current trend of gold is basically similar to that of the first half of the month.
There was a sharp retracement last week, and then the bottom daily line closed with a cross star, followed by a sharp rebound.
The current market is basically copying the previous market. If nothing unexpected happens, if it goes up in this trend, 3500 is very likely not the high point, and it is only a matter of time before a new high is reached.
In addition, from the 4-hour chart, yesterday, the bottom 3360 was tested many times, but it failed to break down. Today, the opening was stretched from 3360 to above 3400.
3360 is a intensive trading area suppression position in the early stage. After breaking through 3360 on Tuesday, it has not fallen below this position so far.
So, we can currently regard 3360 as an important support position.
So we can regard 3360 as the 618 support position, so as to infer the high point position.
As you can see in the picture, I have also marked the point, which is about 3450-60.
Finally, let's look at the hourly chart. You can see that from 3360 to the morning high of 3415, the Fibonacci position 50% position and 382 position are about 3390-85.
It is also about the lowest position of the callback.
In terms of future operations, you can basically rely on 3390-85 to enter the market and do more.
The upper target can basically see the 3440-60 range.

GOLD - reached at final support? What's next??#GOLD.. well guys market perfectly moved as per our analysis and now market job at reached at his final supporting area that is 3350-51 around
Keep close it n only short below that.
Good luck
Trade wisely

XAUUSD – 30m Precision Buy from 79% Fib + Liquidity Grab📈 GOLD LONG CONTINUATION – May 7, 2025 | Smart Money Masterclass
Here’s a 🔥 textbook entry on XAUUSD, showing exactly how Smart Money engineered liquidity, tapped into the Fair Value Gap, and launched the price from deep Fib levels.
Let’s break this down like a true Chart Ninja:
🔍 KEY CONFLUENCES IN THIS SETUP:
🧠 FVG Respect: Perfect reaction from the imbalance zone (gray box)
💰 Liquidity Sweep: Triple low fake-out → "Buy-side Engineered Liquidity" ($ symbols)
📉 Descending Trendline Break: Acting as a final bear trap
🧲 Fib Retracement: Entry from deep golden pocket zone (between 70.5% and 79%)
📊 50% EQ Magnet Above: Price reacting towards premium inefficiency
🚀 Risk-Reward Setup: ~1:6 RR targeting imbalance fill around $3435
🏗️ Structure: Price built a base with multiple accumulation candles before break
📈 Trade Details:
🟢 Entry Zone: $3,388 – $3,393 (limit filled within FVG + Fib zone)
❌ SL: Just below 79% zone at $3,386
✅ TP: $3,435 (0% Fib level / top of the range + inefficiency)
📈 RRR: ~1:6 sniper level precision
⚙️ Execution Strategy:
Confirmation entry after inducement wick
FVG + Fib overlap = High probability zone
Optional scaling in across zone: 70.5%, 75%, 79%
First partials around $3,412, full TP at $3,435 zone
💬 Chart Ninja Quote of the Day:
"The best trades don’t chase price—they wait for price to chase them."
🔒 SETUP SUMMARY:
Timeframe: 30m
Bias: Bullish
Entry Type: Limit
Confluences: FVG + Fib + Liquidity Sweep
Trade Type: Reversal from Demand
Confirmation: Structure shift + Clean W bottom
💾 Save this setup and study it frame-by-frame.
📲 Share it with your trading crew who still think breakouts are reliable 😉

GOD BUY GREAT TUESDAY
Greetings traders this is my analysis on gold and its a long for buy
Technical analysis of gold
informatoin ; Head and Shoulders
this pattern is now even more clearly presented with.
Head_ a higher peak (higher high)
Left shoulder_a weaker atempt recover , which confirms the loss of bullish strength
Usually, such a pattern is followed by a corrective move downwards (which has already been partially see)
potential trend change zone
Highlighted support in zone
3345_3325 usd _very imortant for confirming the bullish scenario.
the shown ''bounce zone'' suggests a possible purchase if the price bounces from this area
predicted path expected
fall to support (around 3345_3325 USD
Conclusion and strategy
Scenario 1(main) buy zone between 3357 3335 if price action signal is seen (pin bar engulfing
TARGET 3500+
Stoploss: Bellow 3300 support
Scenario2 (riskier) : If price does not bounce from that zone possible further deepening towards 3250 3215
Dear Traders like comment let me know what do you think

XAUUSDHi ,
The market has consistently been rising as indicated in my yesterdays Analysis , The formation of series of HIGHER HIGHS $ HIGHER LOWS from 2nd May - 5Th May. This supports yesterdays idea on testing $3372 and infact went further up to $3380
If the fast EMA (8) is above the SLOW EMA (21) it then further supports the BULLISH COURSE.
If the RSI is hovering above 70 , this indicates the asset been OVERBROUGHT signaling a potential PULLBACK.
The PRICE consolidated before breaking out UPWARD , which indicates a CONTINUATION OF THE BULLISH TREND.
The current WAVES exhibits smooth pullbacks without DEEP CORRECTIONS , signaling STRONG BUYING PRESSURE.
The sudden SURGE in PRICE indicate INCREASING BULLISH MOMENTUM or a possible EXHAUSTION.
OVERALL we should hit $3372-85 and if the price breaks the zone and moves a little further it will signal further BUYS. If the PRICE breaks $3252 going down that should be your FALL CONFIRMATION.
Meanwhile i have a few buy positions active and waiting for further confirmation.

XAUUSD:Sharing of the Latest Trading StrategyToday, all the trading signals finally yielded profits! Check it!👉👉👉
Today, gold has strongly rallied, breaking through the range-bound trading pattern. It climbed to as high as the level of 3,328 at its peak. However, there has been basically no retracement in the price of gold. Thus, it is highly probable that the safe-haven sentiment will be directly released, after which gold will commence its adjustment. Therefore, it is not appropriate to chase the upward trend at this position. Instead, it is advisable to patiently wait for the opportunity of a pullback from the high level. When there is a rebound to a high position, directly go short on gold!
Trading Strategy:
sell@3330-3320
TP:3300-3280
The signals in the Signature have brought about continuous profits, and accurate signals are shared every day. Hurry up and click to get them!
👇 👇 👇 Obtain signals👉👉👉

Gold bull-bear game intensifies
Weekly analysis of the gold market: bull-bear game intensifies, pay attention to the Fed's decision and trade situation
Market Overview
In the early Asian session on Monday (May 5), spot gold rose slightly by 0.2%, trading around $3246.44/ounce. Although retail investors are optimistic about gold prices, most Wall Street institutions are bearish on gold trends this week. The market focus has shifted to the Fed's interest rate decision this week and the progress of the international trade situation. These two factors are expected to dominate the short-term gold market.
Significant divergence between bulls and bears
Institutions are mainly bearish
Kitco survey shows that 50% of 18 analysts are bearish, only 28% are bullish, and 22% expect sideways trading.
Technical indicators show that gold is trending downward in the short term. If the US dollar rebounds due to the Fed's decision, it may further suppress gold prices.
Some analysts believe that the 7% adjustment of gold from its recent high is insufficient and there is still room for decline.
Retail investors are bullish
In Kitco's online voting, 52% of retail investors are bullish, 29% are bearish, and 19% expect consolidation.
Some believe that the current correction is excessive, and gold prices may rebound if US economic data is weak or the Fed sends a dovish signal.
Analysis of key influencing factors
Federal Reserve interest rate decision (May 7)
The market generally expects the Fed to keep interest rates unchanged, but Powell's press conference may trigger volatility.
If the Fed's statement is hawkish, a stronger dollar may suppress gold; if economic risks are mentioned, it may boost safe-haven demand.
International trade situation
The easing of trade tensions may weaken gold's safe-haven appeal, and vice versa, it may drive gold prices up.
Be wary of the market's "knee-jerk reaction" to related news, and gold volatility may increase.
Technical key positions
Support level: $3,200 (psychological barrier), if it falls below, it may fall to the $3,150-3,000 range.
Resistance level: $3,315, only after breaking through can the downward pressure be relieved.
Summary of institutional views
Bearish view:
The adjustment of gold has not yet ended. If the trade optimism continues, the gold price may test $3,000.
The rebound of the US dollar and the rise in US bond yields may further pressure gold.
Bullish view:
The current sell-off may be a short-term phenomenon, and economic and political uncertainties still support the long-term demand for gold.
If the gold price is oversold, it may attract bargain hunting.
Neutral view:
It is expected that gold will maintain a wide range of fluctuations, and the fluctuation range is large. Investors are advised to operate with caution.
Operational suggestions
Short-term traders: Pay attention to the breakthrough of the $3,200-3,315 range and follow the trend.
Medium- and long-term investors: If the gold price falls back to the $3,000-3,150 range, consider arranging long orders in batches.
Hedging strategy: Use inverse ETFs (such as GLL and ZSL) to hedge short-term volatility risks.
Summary
The gold market is currently in a stage of long-short tug-of-war. The Fed's decision and trade trends will become the key drivers of the short-term market. The technical side is bearish, but if risk aversion rekindles or the Fed releases a dovish signal, gold prices may still rebound. Investors need to pay close attention to market dynamics and adjust their strategies flexibly.
