Gold Price Analysis (XAU/USD) – Potential Bullish Breakout SetupGold shows a consolidation pattern forming within a symmetrical triangle. Price action is currently testing the lower support of this triangle. A potential bullish breakout is anticipated if price bounces from the minor demand zone and breaks above the triangle resistance. The upper resistance target lies near the $3320 level. Key support levels are highlighted at $3280 and $3260 Watch for confirmation signals near the breakout zone for potential long entries.
GOLD trade ideas

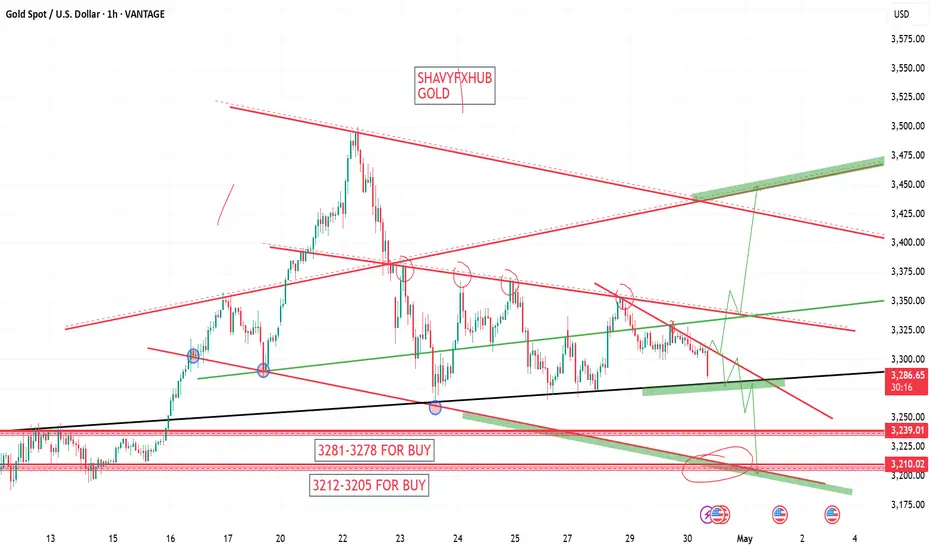
XAUUSD/GOLD | 4H | SWING TRADEHey There,
Guys, I advise you to just wait for the breakout in gold. This is swing trading. I am just waiting for a breakout; if this breakout is to the downside, the target will be at least 3.215 level.
I hope this matches your desired tone.
Don't forget to click the like button at the bottom of this post to stay up to date with the latest changes!
Dear friends, your likes are always the biggest motivation for me to share my analysis. Therefore, I would like to ask each and every one of my followers; please keep your likes coming.
I sincerely thank everyone who supports me with their likes.

Gold Long | Bullish Breakout Expected | Buy on DipsGold is showing bullish strength with higher highs and higher lows forming on the chart.
Price has respected key support around and is now aiming for resistance near .
Entry idea: Buy between
Stop Loss:
Target:
Trend: Bullish
Timeframe: [1} Hr
📌 Reason for Long:
Price above EMA
Strong demand zone at
Bullish price action (engulfing candle / breakout / etc.)
📊 Tags (Important for visibility):
#GOLD #XAUUSD #LONG #BUY #Bullish #TradingView #PriceAction

How should gold be positioned after the ADP data is released?Although the current ADP data is positive, and the US GDP in the first quarter is sluggish, the risk of US recession has increased, but gold has not risen sharply, and the 1H moving average is still radiating downward. At present, it can only be regarded as a short-term correction to the oversold area. If the upper 3300-3310 does not break, you can go short. Brothers who have made profits now can exit the transaction in time. We are patiently waiting for entry opportunities.
If you agree with this point of view, or you have a better idea, please leave a message in the comment area. I look forward to hearing different voices.
TVC:GOLD FXOPEN:XAUUSD FOREXCOM:XAUUSD FX:XAUUSD OANDA:XAUUSD

GOLD trades around $3,300, market lacks major impactOANDA:XAUUSD sare trading lower around the $3,300/oz flatline as easing US-China trade tensions dampen the appeal of gold as a safe-haven asset, while investors await US economic data to gauge the Federal Reserve's policy direction.
OANDA:XAUUSD have been trading in a narrow range recently as the market awaits details of the first trade deal, which is expected to be announced this week or next.
OANDA:XAUUSD has reversed to a downside correction since last week as Trump made some very positive comments and the risk of stagflation was further ruled out, and gold prices continued to fall. Stagflation has pushed gold higher and as the market starts to price in this risk, a correction is natural, especially considering that “buying gold” has become the top trade and it is technically in overbought territory.
Looking at the larger picture, gold prices remain in an uptrend as real yields are likely to continue to fall amid the Fed’s easing. But in the short term, more positive news on tariffs could see gold prices continue to fall as the market adjusts to the new conditions.
OANDA:XAUUSD , traditionally seen as a hedge against political and financial uncertainty, hit a record high of $3,500.05 last week amid heightened uncertainty.
Investors will be watching economic data for the rest of the week, including Wednesday's personal consumption expenditure report and Friday's non-farm payrolls report.
Technical Outlook OANDA:XAUUSD
On the daily chart, gold continues to move sideways as the accumulation state takes place as the market has no fundamental impact of any sudden change. With the current position, gold is not qualified to increase or decrease significantly with the sideway area of attention in the range of 3,371 - 3,292 USD being the positions of the Fibonacci retracement of 0.236% and 0.382%.
However, overall, gold is still inclined to increase in the long term with the price channel as the main trend and support from EMA21 as the main support. As long as gold remains above/within the price channel, above EMA21, it still has the technical conditions for the main trend to be up, the declines should only be considered as short-term corrections and not an official trend.
During the day, the sideways accumulation state with the main uptrend will be noticed again by the following positions.
Support: 3,292 – 3,267 USD
Resistance: 3,371 USD
SELL XAUUSD PRICE 3382 - 3380⚡️
↠↠ Stop Loss 3386
→Take Profit 1 3374
↨
→Take Profit 2 3368
BUY XAUUSD PRICE 3283 - 3285⚡️
↠↠ Stop Loss 3279
→Take Profit 1 3291
↨
→Take Profit 2 3297

Short XAUUSD from the key level 3500The 3500 selling zone is the key level, the price is in an uptrend, but there are signs of profit taking, adjustment, selling to the 3260 zone is the imbalance zone.

Gold at $3,260: Buy the Fourth Dip?Gold prices have stabilized today after experiencing an earlier decline that represents the fourth dip down to the $3260 level over the past few sessions. The repeated defense of this support level could indicate strong buyer interest at these prices.
Recent reports suggest an easing of trade tensions which might be weakening demand for gold. But have tensions really eased to any great extent? Commerce Sectary Howard Lutnick announced yesterday the U.S. is close to 1 trade agreement with 1 mystery trade partner (rumored to be India? But why not brag about that if true) isn't the kind of progress that consoles me.
But is it time to buy?
The consistent support at $3,260 coupled with a potential move above $3,375 could provide the technical confirmation needed for renewed confidence in this kind of trade.

GOLD GOLD ,complete analysis based on strategy. price moved in descending trendline signal buy on the floor of the channel and a retest candle.

Gold Plan: Waiting for the 1000 Pips Drop UnderwayYesterday, I highlighted that the 3280 support zone looked fragile and warned of a potential breakdown.
However, once New York opened, bulls stepped in aggressively, pushing Gold above Friday’s close and triggering my stop loss along the way.
Key Question:
Has the bullish momentum changed the bigger picture?
Why I Still Expect a Drop:
- Despite yesterday's green close, the broader structure remains bearish.
- The 3370 resistance zone is still intact, and Gold is vulnerable under it.
- My target remains a move under 3280, aiming for the 3200 area.
T rading Plan:
I will continue to look for selling opportunities, especially on spikes toward resistance zones, targeting a 1000 pips move down.
Final Words:
The market needs to confirm the plan, but patience and discipline will bring the 🚀 in the right direction!
Disclosure: I am part of Trade Nation's Influencer program and receive a monthly fee for using their TradingView charts in my analyses and educational articles.

XAU/USD For Bearishwait for pull-back near by entry point and then go short
general trend is up trend
current phase is pull-back
have fun :)

XAU/USD: Weak Support and Potential Reversal in FocusKey Features of the Chart:
Volume Profile Analysis:
The highlighted volume profile on the left shows concentrated trading activity around the 1D POC (Point of Control) at $3,272.200. This suggests the POC is a critical pivot level for the market.
Support Insights:
The horizontal yellow line labeled "Weak Support Because It Has Been Hit So Many Times" at $3,272.200 indicates a crucial support level. However, repeated tests of this level may weaken it, making it susceptible to a breakdown.
Market Sentiment:
The blue arrow suggests a potential upward movement from the current price. This could indicate a bullish bias if buyers defend the support at $3,272.200.
Current Price Action:
The price seems to hover near the weak support, showcasing market indecision. Traders are likely waiting for a clearer breakout or bounce signal.
Trading Plan:
Bullish Case:
If buyers manage to defend the weak support at $3,272.200, a potential rebound could occur.
Traders might consider long positions targeting resistance areas near $3,300 or higher.
Use a stop-loss just below the $3,270 level to manage risks.
Bearish Case:
If the price breaks below the weak support of $3,272.200, expect a bearish continuation toward lower levels, such as $3,250 or $3,200.
Short positions could be considered here, with a stop-loss above the POC.
Closing Thoughts: This chart provides a clear focus on critical support and volume zones. Traders should monitor price action around the 1D POC and weak support level for reliable signals.
Remember: Consistency | Discipline | Perseverance are the keys to staying ahead.

Gold another long 3285$ area is a nice long opportunity.
Let us wait for the price action to unfold.

GOLD scenario 30.04.2025English : According to our analysis, we anticipate a BULLISH scenario.
Morocan Darija : kanchofo d'apres l'analyse dyalna antsanaw TLOO3
ATENTION : I only share my ideas, not signals

GOLD gold will experience sharp drop after seeing some poor buy power and inability to break past 3350-3352. the 3200 level will be watched.
XAU/USD 30 April 2025 Intraday AnalysisH4 Analysis:
-> Swing: Bullish.
-> Internal: Bullish.
Analysis and bias remains the same as analysis dated 23 April 2025
Price has now printed a bearish CHoCH according to my analysis yesterday.
Price is now trading within an established internal range.
Intraday Expectation:
Price to trade down to either discount of internal 50% EQ, or H4 demand zone before targeting weak internal high priced at 3,500.200.
Note:
With the Federal Reserve's dovish stance and persisting geopolitical uncertainties, heightened volatility in Gold is expected to continue. Traders should proceed with caution and adjust risk management strategies in this high-volatility environment.
Price could also be driven by President Trump's policies, geopolitical moves and economic decisions which are sparking uncertainty.
H4 Chart:
M15 Analysis:
-> Swing: Bullish.
-> Internal: Bearish.
Analysis and Bias remains the same as analysis dated 24 April 2025.
Price printed as per my note yesterday whereby I mentioned that we should be surprised if price printed a bearish iBOS as all HTF's require a pullback.
Price subsequently printed a bearish iBOS which confirms internal structure.
Intraday Expectation:
Price has traded up to just short of premium of internal 50% EQ where we are seeing a reaction. Price could potentially trade further into premium of 50%, or H4/M15 nested supply zone before targeting weak internal low priced at 3,260.190.
Note:
With the Federal Reserve maintaining a dovish stance and ongoing geopolitical tensions, volatility in Gold prices is expected to remain elevated. Traders should exercise caution, adjust risk management strategies, and stay prepared for potential price whipsaws in this high-volatility environment.
Trump's tariff announcement will most likely cause considerably increased volatility and whipsaws.
M15 Chart:

Gold insights: 30-APRIL-2025Rise and shine, traders! Start your day with actionable Gold insights. Let's grow your skills together, one chart at a time.

What is gold waiting for? Stuck in the 3300 area⭐️GOLDEN INFORMATION:
Gold price (XAU/USD) fails to build on Monday’s rebound from the key $3,265–$3,260 support zone, encountering renewed selling pressure during the Asian session on Tuesday. Although signals from the US and China remain mixed, investor sentiment remains buoyed by hopes of a potential easing in trade tensions between the world’s two largest economies. Additionally, signs of advancement in tariff negotiations have further bolstered optimism, dampening the appeal of the safe-haven metal.
⭐️Personal comments NOVA:
Gold price needs to be boosted by economic news to break out of the sideways price range around 3300, continue to wait today around 3300
⭐️SET UP GOLD PRICE:
🔥SELL GOLD zone : 3366- 3368 SL 3373
TP1: $3350
TP2: $3340
TP3: $3330
🔥BUY GOLD zone: $3267 - $3265 SL $3260
TP1: $3280
TP2: $3300
TP3: $3318
🔥BUY GOLD zone: $3301 - $3299 SL $3296 scalping
TP1: $3305
TP2: $3310
TP3: $3320
⭐️Technical analysis:
Based on technical indicators EMA 34, EMA89 and support resistance areas to set up a reasonable SELL order.
⭐️NOTE:
Note: Nova wishes traders to manage their capital well
- take the number of lots that match your capital
- Takeprofit equal to 4-6% of capital account
- Stoplose equal to 2-3% of capital account

Gold Short: H&S and Wave 3 downOver here, I've labelled all the waves breakdown as well as drawing a tilted head-and-shoulders. I believe that we are going into a wave 3 (minute degree) that is supported by the formation of the right shoulder.
I expect the neckline to be broken which will then goes down to the first resistance provided by the lower blue trendline.
The next resistance in green will be our first TP target. This is where we can choose to reduce the position, or to adjust the stop loss down in order to ride the position. As the lower target cannot be seen without squeezing the chart and causing the waves breakdowns to be unclear, I will update again when that happens.
The stop loss is above the right shoulder.
Good luck!

XAUUSDIs XAUUSD building for massive breakout?
If XAUUSD sustains 3300 level then it can target 3400 in no time.

GOLD: Long Signal with Entry/SL/TP
GOLD
- Classic bullish formation
- Our team expects growth
SUGGESTED TRADE:
Swing Trade
Buy GOLD
Entry Level - 3313.0
Sl - 3305.4
Tp - 3327.9
Our Risk - 1%
Start protection of your profits from lower levels
Disclosure: I am part of Trade Nation's Influencer program and receive a monthly fee for using their TradingView charts in my analysis.
❤️ Please, support our work with like & comment! ❤️

Gold - $3,500 All-Time High! When Will The New Highs Form?It's been a good run throughout 2025 with little to no drawdown week in, week out. Only 3 bearish weekly closures in 2025 but i believe we wil be seeing a few more of them as the Dollar Index is starting to pivot.
On a lookout for low hanging fruit PD arrays; 1st point of interest is $3,260 with the overall draw to $3,193 - $3,167 being the stretch target

XAUUSD_2HUpdate Gold
Wave ABC which is currently in wave B in a corrective triangle of five waves abcde
and could continue to fall for wave C to $3166
Main and important resistance 3360
Short resistance 3321

Gold Trade plan 29/04/2025Dear Traders,
Gold is still ranging within a triangle pattern. I believe that, considering the dollar index is at a bottom and there’s a potential for a 300-pip rise, gold may come under selling pressure. That said, as long as the price remains inside the triangle, it’s better to stay on the sidelines and wait to see which side the triangle breaks. If there’s an upward breakout, I consider the 3380–3400 area a suitable zone for selling.
if you enjoyed this forecast, please show your support with a like and comment. Your feedback is what drives me to keep creating valuable content."
Regards,
Alireza
