Breakout Watch: Triangle Apex Test Near $3,300Gold is approaching the apex of a symmetrical triangle on the 30-min chart, with price testing both the descending resistance and the ascending support trendline. This compression near the Fib 0.618–0.5 zone ($3,289–$3,226) suggests an imminent move.
Key levels:
Resistance: $3,300 (breakout trigger), $3,340, $3,380 (Fib 0.786)
Support: $3,260 (trendline), $3,226 (Fib 0.5), $3,162 (Fib 0.382)
RSI is rising off oversold (47), and volume is low — typical pre-breakout behavior.
A confirmed breakout above $3,300 could accelerate bullish momentum toward ATH levels. Breakdown below $3,226 invalidates the structure.
Watching for volatility surge within next 24 hours.
GOLD trade ideas

Next Gold Support at $3,226 - Major Breakout Incoming?!🧠 GoldThesis
Gold is coiling into a textbook symmetrical triangle — right on the 0.5 Fib retracement level (~$3,226) from its $3,496 top. Price action is compressing fast, and a major breakout looks imminent within days. The RSI is hovering in the low 30s, signaling that the downside may be reaching exhaustion.
🔍 Technical Breakdown
Pattern: Symmetrical triangle forming, squeezing toward apex (end of April).
Fib Levels:
0.618 = $3,289 (rejection confirmed)
0.5 = $3,226 (current support zone)
0.382 = $3,162 (next support if breakdown confirms)
Volume: Decreasing — classic compression before expansion.
RSI (14): 33 — near oversold territory. Could be setting up a bullish divergence if price sweeps lows.
Volatility: Dangerously quiet... for now.
🟩 Bullish Case
If price holds $3,226 and breaks triangle resistance around ~$3,300, we could see fast movement to retest $3,380 (Fib 0.786) and eventually $3,496 ATH.
RSI reversal + volume surge = likely breakout trigger.
🟥 Bearish Case
Failure to hold $3,226 or $3,162 sends price to $3,083 (Fib 0.236) or lower.
Bear trap possible near ~$3,150 if liquidity is swept.
🚨 My Plan
Waiting for triangle resolution.
Long above $3,300 breakout retest with SL below $3,226.
Short below $3,162 confirmation with tight invalidation.
⚔️ Final Word
The triangle is almost full — this is the calm before the storm. Whether gold rallies back to ATH or dumps to shakeout late longs depends on how this coil resolves. Get ready, the move will be violent.

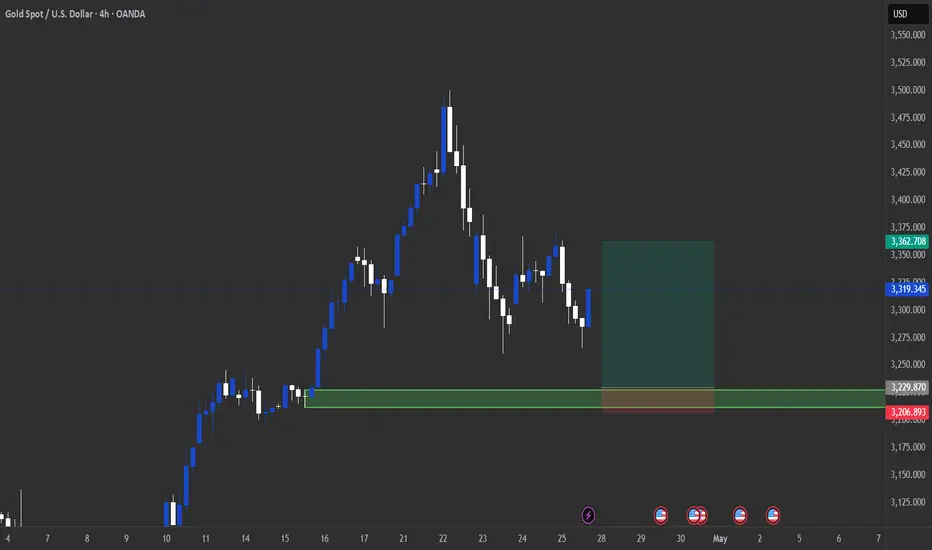
Gold is still Strong; Long-Term!Hello TradingView Family / Fellow Traders. This is Richard, also known as theSignalyst.
📈GOLD has been overall bullish from a macro perspective trading within the rising wedge pattern in orange.
After rejecting the $3,500 round number and upper bound of the wedge, XAUUSD signaled the start of the correction phase.
Moreover, the $3,100 - $3,150 zone is a strong support.
🏹 Thus, the highlighted blue circle is a strong area to look for buy setups as it is the intersection of support and lower orange trendline acting non-horizontal support.
📚 As per my trading style:
As #XAUUSD approaches the blue circle zone, I will be looking for bullish reversal setups (like a double bottom pattern, trendline break , and so on...)
📚 Always follow your trading plan regarding entry, risk management, and trade management.
Good luck!
All Strategies Are Good; If Managed Properly!
~Rich
Disclosure: I am part of Trade Nation's Influencer program and receive a monthly fee for using their TradingView charts in my analysis.

XUAUSD SETUP: Long position I'm looking forward for the market to grab Liquidity below the Low Of The Week .After the market grabs the liquidity below , I'm anticipating a long position to break the high of the previous week.

xauSupport and press the rocket to cheer me up
Observe the ten percent loss limit
Stay away from Bitcoins
Feel free to buy and sell and post your comments

Gold’s ATH Rally Slowing Down – Needs Correction!!!Gold ( OANDA:XAUUSD ) has been on a strong uptrend in recent weeks , creating a new All-Time High(ATH) almost every day. Will a new ATH be created after $3,500 in the coming days? What do you think?
Gold is moving between the Resistance zone($3,386-$3,357) and Support zone($3,282-$3,245) .
In terms of Elliott Wave theory , it seems that Gold has started to form Corrective Waves after recording the latest ATH . Gold is completing a Zigzag Correction wave (ABC/5-3-5) ( most likely ).
I expect Gold to start declining again after approaching the Resistance zone($3,386-$3,357) and attack the Support lines and Support zone($3,282-$3,245) . It seems like Gold needs a correction , do you agree with me!? In the worst-case scenario for my analysis, Gold starts falling from the resistance zone($3,431-$3,406) .
Note: If Gold can move above $3,440, we can expect more pumps and maybe make na ew All-Time High(ATH).
Gold Analyze ( XAUUSD ), 1-hour time frame.
Be sure to follow the updated ideas.
Do not forget to put a Stop loss for your positions (For every position you want to open).
Please follow your strategy; this is just my idea, and I will gladly see your ideas in this post.
Please do not forget the ✅' like '✅ button 🙏😊 & Share it with your friends; thanks, and Trade safe.

Gold's Potential Rally: H1 Pattern Mirrors Daily MomentumIs this pattern repeating in the H1 time frame as it does in the daily time frame?
If so, another rally may be awaiting gold.
Based on this pattern, gold could move up to the 3658 range during this phase.

GOLD: $3,000 | Key Levels for LONG & SHORT entriesparabolic in progress with intense upward correction
smart money waits
active players churn
late comers increase leverage
Fundamentals 6 months late
MOMENTUM in play

THE KOG REPORT - UpdateEnd of day update from us here at KOG:
Quiet day on gold for a change which was much needed after the moves we've seen over the last couple of weeks. We wanted to see this move yesterday and long into those resistance levels which has worked well today giving a decent capture.
We now have support at the 3315 level which is circled and an area of interest above, which if supported could be a the potential move into the close/Asia session.
Preference now is on taking a back seat and waiting for this to break out of the range, then capture the next trade.
RED BOXES:
Break above 3335 for 3345, 3347, 3355 and 3367 in extension of the move
Break below 3320 for 3310, 3306, 3296, 3286 and 3380 in extension of the move
As always, trade safe.
KOG

Gold Bullish Crab PatternThe potential surge in gold prices is being closely monitored, particularly as buyers exhibit a notable interest around the significant Fibonacci golden level at a price point of $3220.
This level serves as a crucial indicator for market participants, suggesting that a breakout could lead to substantial upward momentum.

Hanzo | Gold15 min Breaks – Will Confirm the Next Move🆚 Gold – Hanzo’s Strike Setup
🔥 Timeframe: 15-Minute (15M)
——————
💯 Main Focus: Bullish Breakout at 3301
We are watching this zone closely.
💯 Main Focus: Bearish Breakout at 3270
We are watching this zone closely.
📌 If price breaks with high volume, it confirms Smart Money is in control, and a strong move may follow.
———
Analysis
👌 Market Signs (15M TF):
• Liquidity Grab + CHoCH at 3361
• Liquidity Grab + CHoCH at 3336
• Strong Rejections seen at:
➗ 3270 – Major support / Key level
➗ 3300 – Proven resistance
🩸 Key Zones to Watch:
• 3300 – 🔥 Bullish breakout level X 3 Swing Retest
• 3345 – Strong resistance (tested 5 times)
• 3270 – Equal lows
• 3370 – Equal highs

GOLD...LONGPYTH:XAUUSD
Market structure suggests is preparing for its next move.
The AND level will likely play a critical role in the upcoming direction.
** If structure breaks and confirms the shift, a new bias might form after the retest. **

XAU.usd watch the 22's: 3,322 then 3,222 likely targets for dip Gold may have topped, unless bulls can hold $3,322.95
Looking for minimum first Target zone $3258.64-3259.57
After a bounce we may see another leg down to $3222.15
It topped "for good" then we will quickly hit major support $3062.69-3082.58
.
Previous Analysis that caught the last Bounce at $2,964 EXACTLY:
===================================================================

Gold - Just Half Way To The Target!Gold ( TVC:GOLD ) still has a lot more upside potential:
Click chart above to see the detailed analysis👆🏻
Over the past couple of months, we saw an almost incredible breakout rally of about +75% on Gold. However, looking at technicals, there is a quite high chance that Gold will actually rally even more and retest the next upper resistance trendline, which would mean another pump of about +75%.
Levels to watch: $4.000
Keep your long term vision,
Philip (BasicTrading)

xauSupport and press the rocket to cheer me up
Observe the ten percent loss limit
Stay away from Bitcoins
Feel free to buy and sell and post your comments

DeGRAM | GOLD Held Support Level📊 Technical Analysis
Gold’s slide paused at $3 315; holding here keeps $3 500 – 3 520 in play.
💡 Fundamental Analysis
• PBoC has been buying for 5 months in a row.
• WGC expects strong demand from central banks in 2025.
• Trade wars, tensions in the Middle East and South Asia are causing risks that are increasing demand for gold.
• IMF warns new tariffs could slow growth, boosting safe-haven bids.
• Western ETFs had bought ≈240 t by mid-April.
• DXY is at 3-year lows and yields are down.
✨ Summary
Strong central-bank buying, renewed ETF inflows, softer USD yields and rising geopolitical risk align with chart support, favouring a rebound toward $3 500 – 3 520 while $3 315 holds.
-------------------
Share your opinion in the comments and support the idea with a like. Thanks for your support!

Gold Eyes $3370 After Bullish Breakout and Consolidation PatternThis chart analysis showcases a bullish breakout in the Gold Spot vs USD (XAU/USD) on the 15-minute timeframe. After a significant downtrend, a breakout above the descending trendline occurred, signaling a potential reversal. Price is now consolidating within a rising wedge, aiming for the key resistance zone around $3,370.
Explanation:
Breakout Confirmation: The chart highlights a clear breakout from a descending trendline, marked by a circle. This breakout is a key signal that bearish momentum has weakened and bulls are gaining control.
Bullish Structure: Post-breakout, the price has formed a bullish continuation pattern, indicated by a wedge (or triangle). This pattern often precedes upward moves.
Target Zone: The marked resistance zone around $3,370 is a previous supply area. The chart suggests this is the next key level bulls might aim for.
Projected Move: The blue arrow outlines a possible price path toward this target, assuming continued buying pressure.
This setup provides a potential buying opportunity, but traders should watch for confirmation and manage risk with appropriate stop-loss levels below recent support zones.

XAUUSD Potential Demand zone Long playIdeas on this one? potential long play off the demand zone marked in the chart
Gold is in the bullish direction after correcting the supportHello Traders
In This Chart GOLD HOURLY Forex Forecast By FOREX PLANET
today Gold analysis 👆
🟢This Chart includes_ (GOLD market update)
🟢What is The Next Opportunity on GOLD Market
🟢how to Enter to the Valid Entry With Assurance Profit
This CHART is For Trader's that Want to Improve Their Technical Analysis Skills and Their Trading By Understanding How To Analyze The Market Using Multiple Timeframes and Understanding The Bigger Picture on the Charts
GOLD The Target Is DOWN! SELL!
My dear friends,
Please, find my technical outlook for GOLD below:
The instrument tests an important psychological level 3307.3
Bias - Bearish
Technical Indicators: Supper Trend gives a precise Bearish signal, while Pivot Point HL predicts price changes and potential reversals in the market.
Target - 3292.2
Recommended Stop Loss - 3314.4
About Used Indicators:
Super-trend indicator is more useful in trending markets where there are clear uptrends and downtrends in price.
Disclosure: I am part of Trade Nation's Influencer program and receive a monthly fee for using their TradingView charts in my analysis.
———————————
WISH YOU ALL LUCK

DeGRAM | GOLD Held the Channel📊 Technical Analysis
● Gold is basing at $3 290; defending this demand band keeps $3 500 – 3 520 viable.
💡 Fundamental Analysis
● Goldman raised its year-end target to $3 700 on robust demand.
✨ Summary
Fundamentals are in line with chart support, favoring a bounce towards $3 500 - $3 520 while maintaining $3 290.
-------------------
Share your opinion in the comments and support the idea with a like. Thanks for your support!

XAUUSD (LONG)
Day Trade
Had ABC move price has to come back to retest the breakout of consolidation.

XAUUSD update on APRIL 30, 2025GOLD still in accumulation / consolidation zone.
We face many big news and it have a high probability to make it volatil, include NFP and FOMC.
Lets dancing, so far 3259 support still holding.
Good Luck !
