THE KOG REPORT - FOMCTHE KOG REPORT – FOMC
This is our view for FOMC, please do your own research and analysis to make an informed decision on the markets. It is not recommended you try to trade the event if you have less than 6 months trading experience and have a trusted risk strategy in place. The markets are extremely volatile, and these events can cause aggressive swings in price.
Our NFP KOG Report worked pretty well apart from it being a Friday and us closing out positions for the weekend only for the move to complete on Monday. For this FOMC we’ll share the levels and potential reaction points on the red boxes as well as the red box target levels. Due to the range, it’s best to wait for the break and also for them to move the price to where they want, then hunt the trade once price has settled.
We have the immediate support level below 3360-55 which if held can push this upside to break the recent high and that 3480-90 level again. Break of that level we have red box region 3330-20 which is where we could get a RIP but that will give us the flip with potential for the order region 3350-55 to turn into resistance unless broken. For that reason, a down move for now could only give scalps for decent captures on tap and bounces.
3320 is the line in the sand, if broken below we’ll get the long from the 3290-95 region which will come next week.
Note, these days it’s only Trump that manages to move the markets aggressively, so this FOMC is most likely already priced in. Not worth attempting the immediate levels so we’ll rather wait for the extreme levels.
RED BOXES INDI LEVELS:
Break above 3395 for 3406, 3410, 3420, 3430 and 3435 in extension of the move
Break below 3375 for 3370, 3366, 3356, 3351 and 3345 in extension of the move
Please do support us by hitting the like button, leaving a comment, and giving us a follow. We’ve been doing this for a long time now providing traders with in-depth free analysis on Gold, so your likes and comments are very much appreciated.
As always, trade safe.
KOG
GOLD trade ideas

GOLD → Consolidation. Traders are waiting for news...FX:XAUUSD remains in consolidation at 3370-3270. Traders are in no hurry to take any action, as there is a lot of important news ahead. Let's take a closer look at the situation...
On Wednesday, gold is trading lower, remaining in a sideways range as traders await the release of US GDP data for the first quarter. A sharp slowdown in growth is expected, and a possible contraction in the economy could increase bets on a Fed rate cut and support gold. Meanwhile, the dollar is holding steady amid tariff news and expectations for key employment and inflation data.
A retest of the range support is forming. The approach is quite sharp, and the pre-breakout potential has been exhausted. A false breakout of support could trigger an upward correction.
Support levels: 3270, 3245
Resistance levels: 3314, 3329, 3352
If the dollar continues to fall after the news, this could support gold and the price could continue to trade between 3370 and 3270. Unpredictable news could trigger a breakout and a fall.
Best regards, R. Linda!

Gold latest market analysisAt present, the gold 1-hour moving average crosses downwards and the short positions are arranged. Now it is under pressure at 3270 and is suppressed and falls back. 3270 is still the key turning point for gold bulls and bears. Although there is a rebound, the magnitude of the decline is not large. If the pressure at 3270 is not broken, the gold bulls will not reverse easily for the time being. After the rebound, it will continue to fall, which means that the strength of gold bears is still there, and the gold reversal will naturally not reach a new low, so that the gold bulls will usher in a new turn. Gold operation strategy reference: Short (buy short) two-tenths of the position in batches near the rebound of gold at 3260-3265, stop loss 6 points, target near 3230-3210, break to see the 3200 line.

Gold (XAU/USD) 3H Chart Analysis – Bullish Setup Toward $3,500 TCurrent Price: $3,254.26
EMA 70: $3,285.50 (Price is below EMA – cautious zone)
Bias: Bullish 📈 (if demand zone holds)
Key Zones:
🟦 Demand Zone: $3,200 – $3,260
✅ Strong buy interest expected here
⚠️ Good place to look for entry signals
🟥 Resistance Zone: $3,223.60 – $3,323.84
🔄 Price is currently testing this zone
A breakout here can lead to bullish momentum
🎯 Target Point: $3,500 – $3,529 💰
📌 Defined as "Target Point 3500"
High potential for profit-taking here
⛔ Stop Loss: $3,161.32
🚫 Placed below demand zone for risk control
❗ Important to exit if price drops here
Trade Idea 💡
📥 Buy Entry: Near or above $3,223.60
✅ Hold as long as price respects demand zone
🎯 Target: $3,500
⛔ Stop Loss: $3,161.32
⚖️ Risk:Reward ratio looks favorable!
Quick Summary:
🟢 Bullish Setup
💪 Demand zone is strong
📈 Breakout above resistance may fuel a rally
⏳ Wait for confirmation before entry!

Gold may break out of the range and rise to 3450GOLD is rising and testing the resistance of the trading range. The important prerequisite is no drop after false breakout. Accordingly, buyers are building up and a close above 3367 may give a chance for a rise
The fundamental situation is changing, Trump is imposing new duties. In addition, gold is reacting to the escalation of the conflict in the Middle East. The metal continues to be a magnet for money
Scenario: A break of range resistance and consolidation above 3367 activates buying. The target of 3407 is 3444

Hellena | GOLD (4H): SHORT to 38.2%-50% Fibo lvl 3228.Colleagues, last week we got a stoploss, but I still believe that we should expect a correction in wave “2”. We will try to catch this movement this week.
I believe that the price will correct to the area of Fibonacci 38.2% - 50% levels (3228.41).
Perhaps the price will slightly renew the maximum of wave “1”, reaching the level of 3438. In this case I recommend to work with pending limit sell orders.
And some data:
The prevalence of bulls according to CME reports additionally increased by 13%.
The 23% increase in market volume, meanwhile, indicates a likely strong momentum pattern during the trading week.
Despite the 13% increase in buyers, selling patterns towards the balance level of the week (3200.00) are recommended for the current trading week.
Manage your capital correctly and competently! Only enter trades based on reliable patterns!

GOLD market update: range locked / breakout pending🏆 Gold Market Mid-Term Update
📊 Technical Outlook Update
🏆 Market Overview
▪️broke above 3 000 USD
▪️3250 USD S/R cleared as well
▪️Tested 3500 USD key S/R
▪️Rejection at 3500 USD key S/R
▪️pullback in progress currently
▪️locked inside range trading
▪️3275/3365 usd active range
▪️break below 3245 - BEARS take over
▪️break above 3385 - BULLS take over
▪️Bulls targets - 3450/3550 USD
▪️Bears targets - 3050/3150 USD
⭐️Recommended strategy
▪️Wait for a breakout
▪️LONG/SHORT after breakout
🔥 Key Drivers to Watch
🌍 Geopolitics & Trade
🇺🇸🇨🇳 U.S.–China Tariffs: Escalation continues pushing inflation fears & gold demand
🇪🇺 EU–U.S. tariffs (25%) are further straining global trade
💵 Weaker USD = stronger gold sentiment
🕊 Russia–Ukraine Ceasefire Talks
🗓 May 9 (Victory Day): Symbolic date eyed for a possible ceasefire announcement
🇷🇺 Parade vs 🇺🇦 EU leaders visiting Kyiv — all eyes on peace prospects
☢️ U.S.–Iran Nuclear Deal
🗓 April 28: Talks in Rome
🇮🇷 Iran shows readiness — possible easing of Middle East tensions

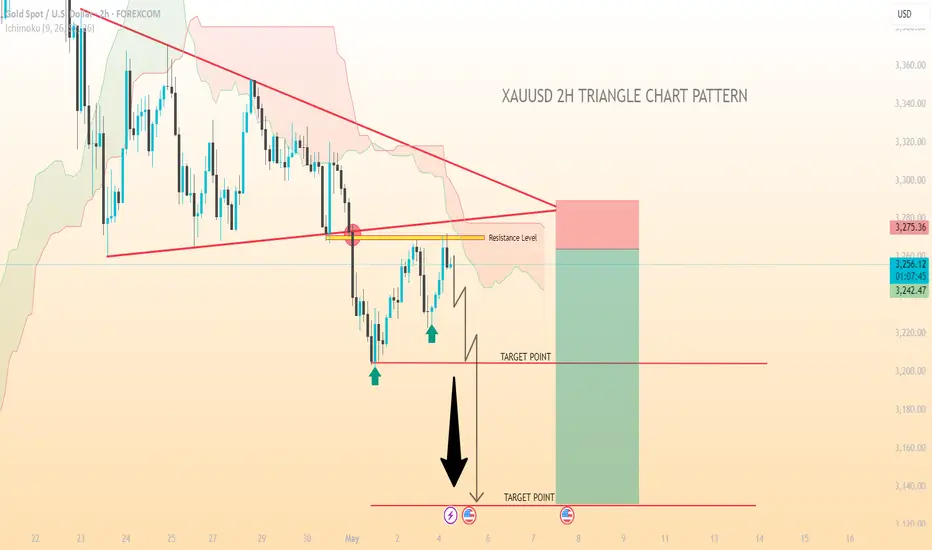
XAU/USD..2h triangle chart pattern*XAU/USD (Gold vs. US Dollar) sell trade** based on the details you provided:
### **Trade Summary**
- **Action:** Sell
- **Entry Price:** 3256
- **Resistance Level:** 3270
- **Stop Loss (SL):** 3288 (320 pips above entry)
- **Take Profit Targets (TP):**
- **TP1:** 3204 (-520 pips)
- **TP2:** 3130 (-1260 pips)
### **Risk-Reward Ratio (RRR)**
- **Risk (SL to Entry):** 320 pips
- **Reward (Entry to TP2):** 1260 pips
- **RRR:** **1:3.9** (Favorable if TP2 is reached)
### **Key Considerations**
1. **Resistance at 3270** – A bounce from this level could confirm bearish momentum.
2. **Stop Loss Placement (3288)** – Protects against a breakout above resistance.
3. **Targets:**
- **TP1 (3204)** – Partial profit-taking level.
- **TP2 (3130)** – Larger downtrend target if momentum continues.
### **Trade Management Tips**
- Monitor price action near **3270**—if it breaks higher, consider early exit.
- Adjust stop loss to **breakeven** if price reaches **3200-3210** (support zone).
- Watch for **Fed policy, US Dollar strength, or geopolitical risks** that could impact gold.
Would you like additional analysis on technical indicators (RSI, MACD, etc.) to confirm the trade setup?
GOLD What Next? SELL!
My dear friends,
Please, find my technical outlook for GOLD below:
The price is coiling around a solid key level - 3263.7
Bias - Bearish
Technical Indicators: Pivot Points Low anticipates a potential price reversal.
Super trend shows a clear sell, giving a perfect indicators' convergence.
Goal - 3249.1
Safe Stop Loss - 3271.6
About Used Indicators:
The pivot point itself is simply the average of the high, low and closing prices from the previous trading day.
Disclosure: I am part of Trade Nation's Influencer program and receive a monthly fee for using their TradingView charts in my analysis.
———————————
WISH YOU ALL LUCK

XAU/USD...gold 15m time frame chart pattern..### **Gold Trade Setup (Buy Now)**
- **Entry Price**: 3280
- **Target Price**: 3432 (**+152 points potential profit**)
- **Stop Loss**: 3360 (**-80 points risk**)
### **Key Points:**
1. **Risk-Reward Ratio**:
- **1:1.9** (Reward is nearly twice the risk, which is favorable).
2. **Trade Management**:
- If price moves favorably, consider **trailing the stop loss** to lock in profits.
- Watch for **trend line breaks or resistance tests** near the target.
3. **Confirmation Needed**:
- Ensure the trend line is validated (at least **2-3 touches** for reliability).
- Check for supporting indicators (e.g., **RSI bullish divergence, moving averages**).
4. **Potential Concerns**:
- Stop loss (3360) is **above entry (3280)**, suggesting this might be a **sell-triggered stop loss** (verify if direction is **long/short**).
- If this is a **sell trade**, adjust interpretation accordingly.
### **Actionable Advice**:
✅ **Execute if**: Trend confirms bullish (higher lows, breakout).
❌ **Avoid if**: Price breaks below the trend line before entry.
Let me know if you'd like help refining the setup! 🚀

Simple Break of Structure BoS Trading Strategy Explained
One of the best and reliable strategies to trade break of structure BoS is to apply multiple time frame analysis.
In this article, I will teach you my break of structure gold forex trading strategy. You will get a complete step-by-step guide with examples.
Let's start with a quick theory and let me explain to you what is break of structure BoS in Smart Money Concept SMC trading.
In a bullish trend, break of structure BoS is an important event that signifies a continuation of an uptrend. It is based on a violation and a candle close above the level of the last higher high (HH).
After a breakout, the broken level becomes the first strong support for trend-following buying.
Check multiple examples of confirmed breaks of structure BoS on GBPNZD forex pair on a weekly time frame.
In a downtrend, Break of Structure BoS means a bearish trend continuation . Break of Structure is considered to be confirmed when a candle closes below the level of the last lower low (LL).
The broken key level becomes the closest strong support for buying.
That's the example of a healthy downtrend on USDJPY forex pair on a daily. Each break of structure BoS pushed the prices lower, providing a strong signal to sell.
What newbie traders do incorrectly, they trade break of structure without a confirmation strategy, and it leads to substantial losses.
Though GBPCHF is trading in a bullish trend and though each BoS provided a trend-following signal. The price retraced significantly lower below the broken structure before the growth resumed.
When the price retests a broken structure after BoS in a bullish trend, start lower time frame analysis.
If you identified a break of structure on a daily, analyze 4h/1h time frames.
If on a 4H, then 30/15 minutes.
After the price sets a new higher high with BoS in uptrend, it usually starts trading in a minor bearish trend on lower time frames.
With our strategy, your signal to buy will be a retest of a broken structure and a consequent bullish Change of Character CHoCH . That will provide an accurate bullish signal.
In a bearish trend, analyze the lower time frames after a retest of a broken structure. Your signal to sell will be a bearish Change of Character CHoCH.
Look at a price action on EURCHF on a daily.
We see a strong bullish trend and a confirmed Break of Structure BoS.
According to the rules of our trading strategy, we start analyzing 4h/1h time frames after a retest of a broken level of the last Higher High.
Our signal to buy is an intraday bullish CHoCH. We open a long trade after that with the stop loss below the intraday lows and take profit being a current high.
That's how simple this strategy is.
Multiple time frame analysis provides the extra level of security.
Strong lower time frame confirmation substantially increases the win ratio of a trading setup.
❤️Please, support my work with like, thank you!❤️
I am part of Trade Nation's Influencer program and receive a monthly fee for using their TradingView charts in my analysis.

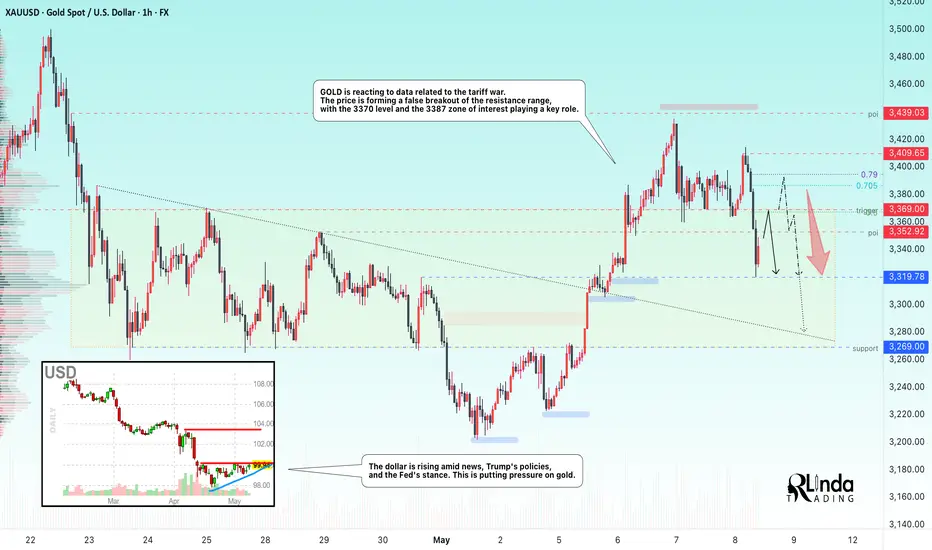
GOLD → Return to range. Fall from resistance...FX:XAUUSD is reacting to data related to the tariff war. The price is returning to the range and forming a false breakout of resistance. The level of 3370 and the zone of interest at 3387 play a key role.
On Thursday, gold rose to $3,400 amid a weaker dollar, increased demand for safe-haven assets, and continued uncertainty due to US trade policy and tensions in the Middle East and Ukraine. The Fed left rates unchanged and expressed caution in its assessment of the outlook, which also supports gold's rise.
However, in the European session, we are seeing gold react to the trade deal with Britain, most likely due to the easing of tariffs. Now the main focus is on the terms of the deal. We should not forget about China, where the situation remains tense, but everyone is waiting for a resolution.
Resistance levels: 3352, 3369, 3385
Support levels: 3319, 3269
The fundamental backdrop changes several times a day. At the moment, the situation is as follows: the rise of the dollar, the weakening of the tariff war, and the hawkish stance of the Fed may put pressure on gold. Therefore, I expect the decline to continue after a retest of 3370-3386. In this case, the target could be 3319.
Best regards, R. Linda!
GOLD - FVG-Based Long & Short Setup Within Range ContextPrice action remains range-bound with well-defined FVG zones acting as both support and resistance, offering reactive trading opportunities on both sides.
---
1. Upper FVG as Resistance — Short Setup Trigger Zone
The highlighted upper green zone marks:
- Fair Value Gap (FVG): A clear inefficiency from the previous bearish impulse.
- Structural Significance: Price has struggled to break and hold above, showing signs of supply reactivation.
This zone is likely to attract sellers upon revisit, offering a clean risk-defined short opportunity.
---
2. Lower FVG as Support — Long Setup Zone
The lower blue zone serves as:
- FVG Rebalance Area: A region where price previously left inefficiency, now acting as strong support.
- Accumulation Interest: Smart money often reloads in such imbalanced areas on retests.
This zone is optimal for positioning into the next bullish leg should price dip lower.
---
3. Liquidity Sweep Mechanics — Trap Both Sides
The market structure hints at:
- Step 1: Induce buyers into breakout longs into resistance.
- Step 2: Reverse from FVG, triggering short entries and trapping longs.
- Step 3: Collect liquidity from lower range, potentially initiating new accumulation.
This movement pattern is characteristic of engineered liquidity grabs in both directions.
---
4. Mid-Range Reaction — Key Pivot Area
Price currently hovers around the mid-range zone:
- Serving as a temporary balance point before volatility expansion.
- Acting as a launchpad for the next impulsive move, depending on order flow dominance.
Patience here is key — waiting for clean confirmations near FVGs provides optimal entry quality.
---
5. Summary:
- Upper FVG Resistance → Short Bias
- Lower FVG Support → Long Bias
- Structured Reactions Around Imbalances Suggest Smart Money Activity
This is a dual-sided setup ideal for reaction-based traders awaiting price confirmation at extremes.

Lack of bullish momentum, gold price waits, slight decrease✍️ NOVA hello everyone, Let's comment on gold price next week from 05/05/2025 - 05/09/2025
🔥 World situation:
Gold (XAU/USD) slipped by more than 0.35% on Friday and is on track to close the week with a decline exceeding 2.5%, as easing trade tensions and upbeat US labor market data boosted investor risk appetite. This shift in sentiment encouraged profit-taking ahead of the weekend, weighing on the safe-haven asset. At last check, XAU/USD was trading around $3,226, pulling back from an intraday peak of $3,269.
Adding to the improved market mood, China’s Commerce Ministry confirmed that the US has shown a willingness to resume discussions on tariffs, while reiterating that Beijing remains open to dialogue.
🔥 Identify:
Gold price continues to adjust down, lacking momentum to increase price. around price range 3200 - 3350
🔥 Technically:
Based on the resistance and support areas of the gold price according to the H4 frame, NOVA identifies the important key areas as follows:
Resistance: $3285, $3316, $3355
Support : $3202, $3155
🔥 NOTE:
Note: Nova wishes traders to manage their capital well
- take the number of lots that match your capital
- Takeprofit equal to 4-6% of capital account
- Stoplose equal to 2-3% of capital account
- The winner is the one who sticks with the market the longest
XAUUSD: Intraday Bullish Move Up To $3400! The OANDA:XAUUSD price has shown strong bullish momentum, indicating it will likely continue to rise above $3400. However, the price is currently volatile and is likely to remain so.
Good luck and trade safely!
Thank you for your unwavering support! 😊
If you’d like to contribute, here are a few ways you can help us:
- Like our ideas
- Comment on our ideas
- Share our ideas
Team Setupsfx_
❤️🚀

Easing market risks put pressure on GOLDOANDA:XAUUSD fell to a two-week low on Thursday (May 1), mainly due to signs of easing trade tensions and a long holiday in China, the world's largest gold consumer. Investors will be looking ahead to the US non-farm payrolls report due today (Friday), which is expected to cause major market movements.
Easing trade tensions between the US and other countries have kept investors optimistic throughout the week. In addition, easing US-China trade tensions have also added to the pressure on gold as there are no additional risks to stimulate safe-haven demand.
US President Donald Trump has decided to exempt some tariffs on the auto industry and made progress on deals with India, South Korea and Japan. On Wednesday local time, Trump said there was a great chance of reaching a trade deal with China and that there were "potential" trade deals with India, South Korea and Japan, and that he was working to reach agreements with the three countries.
The Trump administration hopes to reach preliminary trade agreements with several trading partners within weeks, U.S. Trade Representative Greer said Wednesday. U.S. Commerce Secretary Mattis Lutnick said at least one trade deal is close to being announced, several others are close to being finalized, and Trump may be waiting for an opportunity to announce them all at once.
Data released on Wednesday showed the US economy contracted in the first quarter and the personal consumption expenditures (PCE) price index was flat in March, turning investors' attention to the non-farm payrolls report due out today (Friday). The US non-farm payrolls report for April will be released on May 2 (8:30 a.m. ET). Expectations for the non-farm report are that traders and economists expect the report to show 133,000 new jobs in the US, average hourly earnings increased 0.3% month-on-month (up 3.9% year-on-year), and the U3 unemployment rate remained unchanged at 4.2%.
Fed policymakers said they would keep interest rates on hold until there are clear signs that inflation is falling toward the 2% target or there is a possibility that the job market is deteriorating.
Technical Outlook Analysis OANDA:XAUUSD
Technically, gold remains in the best position for bullish expectations with support from the EMA21 and the 0.50% Fibonacci retracement. Meanwhile, the Relative Strength Index (RSI) is also reacting to the 50 level, which is considered the closest support in terms of momentum.
In the short term, if gold returns to trade above $3,270, it will be considered the best condition for a bullish recovery to end the broad-based correction.
However, if gold is sold below $3,228 and maintains its price action below this level, it will likely continue to decline with a subsequent target of around $3,163 in the short term.
In the day, considering the current position, gold still has conditions for a bullish outlook technically and the notable price levels will be listed as follows.
Support: $3,228 – $3,163
Resistance: $3,267 – $3,270
SELL XAUUSD PRICE 3270 - 3268⚡️
↠↠ Stop Loss 3275
→Take Profit 1 3262
↨
→Take Profit 2 3256
BUY XAUUSD PRICE 3174 - 3176⚡️
↠↠ Stop Loss 3170
→Take Profit 1 3182
↨
→Take Profit 2 3188

DeGRAM | GOLD has reached the channel boundary📊 Technical Analysis
● Chart shows a bullish breakout from the falling wedge into a rising channel. Support near $3,300 held firm, and price is now above the $3,360 pivot, eyeing the $3,430–$3,500 resistance zone. Oscillators on daily chart remain positive, reinforcing the upward bias.
💡 Fundamental Analysis
● Global uncertainty is fueling safe-haven demand: tensions in Ukraine, the Middle East and renewed US-China trade fears are supporting gold.
● A softer US dollar and policy uncertainty also boost bullion; analysts note continued demand keeping prices elevated above $3,000.
● Bank of America highlights that US trade-policy uncertainty will “lend support” to gold prices.
✨ Summary
Upside momentum remains strong, with key support around $3,300–$3,360. Gold’s long bias points toward ~$3,500 in the short term, underpinned by geopolitical risks and a weak dollar.
-------------------
Share your opinion in the comments and support the idea with a like. Thanks for your support!

XAU/USD - Fed warns of Economic UncertaintyThe XAU/USD pair on the M30 timeframe presents a Potential Buying Opportunity due to a recent Formation of a Bullish Flag Pattern. This suggests a shift in momentum towards the upside and a higher likelihood of further advances in the coming hours.
Possible Long Trade:
Entry: Consider Entering A Long Position around Trendline Of The Pattern.
Target Levels:
1st Resistance – 3473
2nd Resistance – 3519
🎁 Please hit the like button and
🎁 Leave a comment to support for My Post !
Your likes and comments are incredibly motivating and will encourage me to share more analysis with you.
Best Regards, KABHI_TA_TRADING
Thank you.

GOLD (XAUUSD): Intraday Bearish SignalThe price of 📉GOLD is likely to keep falling, following a significant downward trend.
After consolidating within a horizontal range on a 4-hour time frame, the support of the range was recently broken, signaling strong selling pressure and a probable continuation of the bearish trend.
It is possible that the pair will soon reach the 3200 support level.

XAU/USD (Gold) Analysis 2/5/20251. XAU/USD recently recorded an all-time high (ATH) at the 3150 level.
2. Following a healthy retracement, we are now eyeing potential long opportunities near the 3100 zone.
3. The 3100 level presents a favorable risk-reward entry point, aligned with historical support.
4. Market sentiment remains bullish, supported by strong fundamentals and ongoing geopolitical tensions.
5. A breakout above the previous ATH could open the door for a continued rally toward higher resistance levels.
6. Our upside targets for this move are in the range of 3450 to 3500, offering considerable profit potential.
7. Price consolidation near 3100 indicates accumulation, reinforcing the long bias.
8. We anticipate renewed buying pressure as the market tests key psychological and technical levels.
9. Risk management will be crucial, with stops ideally placed just below the 3050 support region.
10. Overall, this setup offers a compelling long trade backed by technical structure and market momentum.

XAU/USD Market Outlook – Key Levels & Scenarios (May 2025)📊 Market Overview
Asset: XAU/USD (Gold vs. USD) – likely
Timeframe: 🕒 4H or Daily
EMAs:
🔴 50 EMA = 3,281 (short-term trend)
🔵 200 EMA = 3,179 (long-term trend)
🧱 Key Zones
🔺 Main Resistance Zone (🚫 Supply Area)
📍 ~3,320–3,400
🔍 Observation: Strong rejection zone with multiple failed attempts. 🚧 Price struggles to break and hold above here.
⚖️ Mid Support & Resistance Zone
📍 ~3,200–3,250
🧭 Current Action: Price is consolidating here. This is a key decision zone. A bounce or breakdown will likely decide the next big move. 🤔
🟦 Main Support Zone
📍 ~2,980–3,030
🛑 Observation: Major demand zone. If price falls here, it might attract buyers 👥 for a potential rebound.
📉 EMA Analysis
🔴 50 EMA is above 🔵 200 EMA → Trend still technically bullish ✅
🟡 BUT: Price is currently below 50 EMA, showing short-term weakness ⚠️
⚡️ 200 EMA is nearby (~3,179): Acting as dynamic support — a critical bounce zone! 🛡️
🔮 Scenarios
🐂 Bullish Path
✅ If price bounces from 3,200 support zone and reclaims 🔴 50 EMA:
🎯 Target: Retest of 3,320–3,400 🔺 zone
📈 Confirmation: Strong candle closing above 3,281 🔴 EMA
🐻 Bearish Path
🚨 If price breaks below 3,200 & 200 EMA:
🕳️ Expect drop towards 2,980–3,030 🟦 zone
📉 Confirmation: Candle closes below 3,179 with weak retest
✅ Conclusion
📍 Key Level to Watch: 3,200
⚖️ Market Sentiment: Neutral → Bearish bias unless price reclaims 50 EMA
🔒 Risk Tip: Avoid longs until price confirms bullish structure again 🔐

HelenP. I Gold will drop to trend line, breaking support levelHi folks today I'm prepared for you Gold analytics. Looking at the chart, we can see how the price has recently formed a narrowing wedge structure after a strong impulsive rally. The price reached a significant peak and then started consolidating, forming lower highs with fading bullish pressure. What we now see is a classic sign of price compression within a pennant pattern. Currently, the market is testing the key resistance zone between 3360 - 3380 points. This area aligns with the upper boundary of the wedge, and the price has already reacted to it multiple times. Buyers were unable to break through convincingly, indicating a potential exhaustion of momentum. Meanwhile, the lower boundary is represented by a dynamic trend line. Given this structure, I expect Gold can decline toward the support trend line and possibly reach 3300 points, my goal. The combination of horizontal resistance, trend weakening, and pattern tightening supports a short bias. Given the recent lower high, the rejection near resistance, and the wedge formation, I remain bearish and anticipate further decline. If you like my analytics you may support me with your like/comment ❤️

Gold bulls are coming on strongFrom the 4-hour analysis, gold bulls are making another strong impact. On the top, we pay attention to the short-term suppression at 3385-90 and the suppression at 3400. On the bottom, we pay attention to the short-term support at 3350 and the important support at 3336-40. In terms of operation, we mainly go long on pullbacks. In the middle position, we should watch more and do less, chase orders cautiously, and wait patiently for key points to enter the market.
