No Guessing. No Praying. Just Precision — Smart Money Moves Only📆 XAUUSD Daily Plan – April 29, 2025
🔥 Macro & Market Context:
Gold continues its tactical chess game between premium supply traps and reactive support zones.
Price is currently hovering around 3342, teasing a breakout or another trap inside the 3340–3355 resistance block.
Tomorrow we also have important USD news: 🔵 CB Consumer Confidence
🔵 JOLTS Job Openings
Expect potential volatility during NY session — stay adaptive, not predictive.
🎯 Bias Overview:
HTF Bias (H4–Daily): Bullish (Higher Highs and Higher Lows structure still intact)
LTF Flow (M15–H1): Corrective bullish retrace inside HTF uptrend
📍 Key Levels to Watch:
🔺 Resistance Zones:
3340–3355 → Minor Premium Resistance (currently being tested)
3372–3376 → Strong Trap Sell Zone (next immediate target above)
3380–3390 → Major Liquidity Pool (big decision area if price pumps further)
🔻 Support Zones:
3284–3288 → Intraday Demand + Bounce Zone
3233–3237 → HTF Major Reversal Demand
🎯 Refined Sniper Zones:
🟩 Buy Zone #1: 3284–3288
(H1 demand cluster + previous clean reaction)
🟩 Buy Zone #2: 3233–3237
(Deep HTF OB + untapped liquidity anchor)
🟥 Sell Zone #1: 3372–3376
(M15–H1 OB + liquidity trap setup)
🟥 Sell Zone #2: 3380–3390
(Premium supply and major liquidity sweep)
👀 Eyes On:
Reaction at 3372–3390: Weak rejections = tactical sell opportunities.
Respect for 3284–3288: Bullish continuation if defended strongly.
Violation below 3230: HTF momentum shift possible toward deeper discount.
📢 Final Message:
Gold’s setting traps for both bulls and bears — but we’re hunting precision, not chaos. 🏹
Patience = Power.
Confirmation = Survival.
🔥 Trading Focus Tip:
"First wicks grab liquidity. First breakouts fool emotions.
We wait for the second reaction — that's where the sniper eats."
If this map helps you stay focused, smash that ❤️ and follow, drop your thoughts below, and let's trade the smart flow together! 🚀✨
GOLD trade ideas

Gold is in a long-short tug-of-war, waiting for a breakGold enters the range fluctuation in the 4-hour chart. From the chart, we can see that the trend is triangular, with high points gradually moving down and low points gradually moving up. When the space cannot be expanded, there will be a breakthrough in one direction. There will be news this week. Therefore, short-term trading still depends on highs and lows. The daily chart MACD begins to cross downward. The daily chart is horizontally consolidated and paused, unable to set a new high, and there is still a need for short-term correction. In summary, I suggest that short-term operations should focus on long and short positions, supplemented by long positions.

UPDATE ON XAUUSD (GOLD) BUY , Added from $3269UPDATE ON XAUUSD (GOLD) BUY
Added from $3269
Better entries for BUY (Long) $3260-$3270
Targeting $3355 or Above
According to my TA
Its not a Financial advice

Gold Intraday Trading Plan 4/30/2025Yesterday I expected gold to resume bullish trend. However, it faced a strong resistance at 3350 and dropped all the way to 3300. Currently it is stuck in between these two levels.
As today is month end, there will be big fluctuations. I will not rush into any trade. I will trade break out today.
If 3350 is broken, I will buy towards 3400.
If the trend line is broken, I will sell toward 3270, or even 3230.

Gold's Trend and Trading Strategy for Next WeekLast week, the price of gold sharply declined after hitting the resistance level of $3,500, dropping to around $3,260 at its lowest point. The weekly chart closed with a bearish inverted hammer candlestick pattern, suggesting a sharp short-term downward momentum. However, on Friday evening, the gold price rebounded near the support level of $3,260 and regained the $3,300 mark. Combining the current fundamental and news-driven analysis, gold remains in an overall upward trend:
Technical Analysis
Although the weekly inverted hammer pattern indicates selling pressure at higher levels, the rapid rebound from the bottom to reclaim the key $3,300 level signals the persistence of bullish momentum. If the short-term decline fails to effectively break below the strong support at $3,250, the gold price has the potential for a rebound.
Trading Strategy
Next week, it is recommended to adopt a bullish bias and focus on long positions. Consider entering near $3,283, with a stop-loss set below $3,260. The upper resistance levels are sequentially $3,331 (short-term resistance) and $3,370 (target after breakthrough).
Risk Warning
Be vigilant against shocks to gold prices from sudden geopolitical news or changes in Federal Reserve policy expectations, and strictly control position sizing and stop-loss levels.
I hope this strategy will be helpful to you.
When you find yourself in a difficult situation and at a loss in trading, don't face it alone. Please get in touch with me. I'm always ready to fight side by side with you, avoid risks, and embark on a new journey towards stable profits.

Gold trading signal analysisTrading Setup:
There is a Trading Signal to Sell in Gold XAUUSD (4h)
Traders can open their Sell Trades NOW
⬇️Sell now or sell on 3364.0
⭕️SL & BUY @ 3415.0
🔵TP1@ 3224.0
🔵TP2@ 3151.0
🔵TP3@ 3001.0

GOLD - WAVE 4 CORRECTION TO $2,800 (UPDATE)Gold still dipping lower as I said would happen during my video analysis. We've seen a 'BOS' on the 1H TF, followed by a retest, now we're hoping for a continuation to the downside.
But get ready to buy the huge, discounted dip back up📈

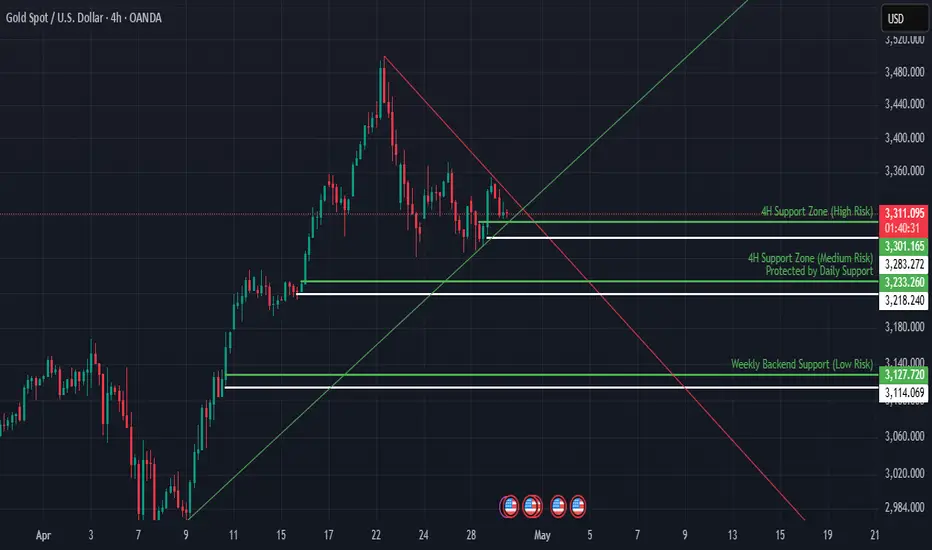
Gold 4H – Compression Builds | Key Zones in FocusGold is consolidating beneath descending trendline resistance, compressing within a defined structure on the 4H chart. As volatility tightens, price is approaching a critical decision point. This post outlines the key actionable zones, ranked by risk, and highlights the stop-loss levels to manage exposure.
Technical Analysis:
Price action remains trapped within a descending triangle, marked by lower highs and flat support. Buyers have shown interest around the $3,313–$3,283 range, while broader structure still favors caution until a clean breakout or breakdown occurs.
We’ve identified three main zones, each offering different trade opportunities based on structure and risk tolerance:
🔴 $3,313 – Minor Intraday Level (Higher Risk):
This is not a formal support zone but a short-term reaction level. Positioned directly under descending trendline resistance, it's highly reactive and prone to stop hunts or liquidity spikes. Entries here carry elevated risk and require tighter stop placement.
Stop-loss: Below $3,301.165 – A clean invalidation if structure breaks.
🟠 $3,283 – 4H Support Shelf (Medium Risk):
A more defined level based on prior multi-candle rejections. This zone has shown stability and represents the core of current consolidation. A breakdown below here would likely trigger downside continuation.
Stop-loss: $3,263.450 – Under the consolidation base, confirming bearish expansion.
🟢 $3,240 – 4H Support Zone (Low Risk – Backed by Daily Structure):
This zone aligns with a broader daily support level and has not been tested in the current cycle. It offers a structurally clean and lower-risk long entry, especially for swing traders.
Stop-loss: $3,218.240 – Invalidation of the daily support structure.
Outlook:
Bullish trigger: Break and close above $3,320 and the trendline → opens path toward $3,420 and $3,510.
Bearish trigger: Clean loss of $3,283 → exposes downside toward $3,240, then possibly $3,127.
Current bias: Neutral-to-bullish while price holds above $3,283 and compression remains intact.
Note: The FOMC decision on Wednesday may act as a catalyst. A dovish tone could support bullish continuation in gold.
✅ Conclusion:
Gold is compressing within a clean descending triangle structure. If buyers defend one of the mapped support zones, we could see a push toward $3,420 and possibly $3,510. Until a confirmed breakdown below $3,283 occurs, the bias remains neutral-to-bullish, with opportunity on structured pullbacks.
Not financial advice. Like & follow for more Gold trade setups and structured market analysis.
Looking for short Although started drop from 3350 zone which we have mentioned in our previous commantary.
Currently will watch the gold for rejection near this zone 3330-3335 resistance for short opportunity towards 3300 then 3280 agai.
Above 3335 we have again 3360 milestone .

Weekly Analysis on GOLDFor next week trading session i will be looking for both buy and sell opportunities and it depends how candles will formed based on my trading idea.

Gold Trade Plan 28/04/2025Dear Traders ,
If the price does not break the 3270 area then I expect the price to enter the 3300 area and above... If the price breaks the 3270 area downwards, I expect the 3240-3160 area this week.
If you enjoyed this forecast, please show your support with a like and comment. Your feedback is what drives me to keep creating valuable content."
Regards,
Alireza

Trading balanceTrading balance The price of the asset has rebounded from the balance zone. With the prospect of growth into the resistance zone.
GOLD - WAVE 4 CORRECTION TO $2,800This video analysis is leading on from our long term target for $6,200 which I posted yesterday. We can see from the strong impulse move up, the entire bullish cycle is not complete yet & has more upside, AFTER a healthy correction.
Confluences👇
⭕️Wave 3 Peaked at Psychological Number of $2,500 (LQ Point).
⭕️Wave 4 & 5 Pending.
⭕️Overbought Market Conditions.


GOLD in rectangle patternwe might see more rejection from gold, to reach about the previous resistance at $3150

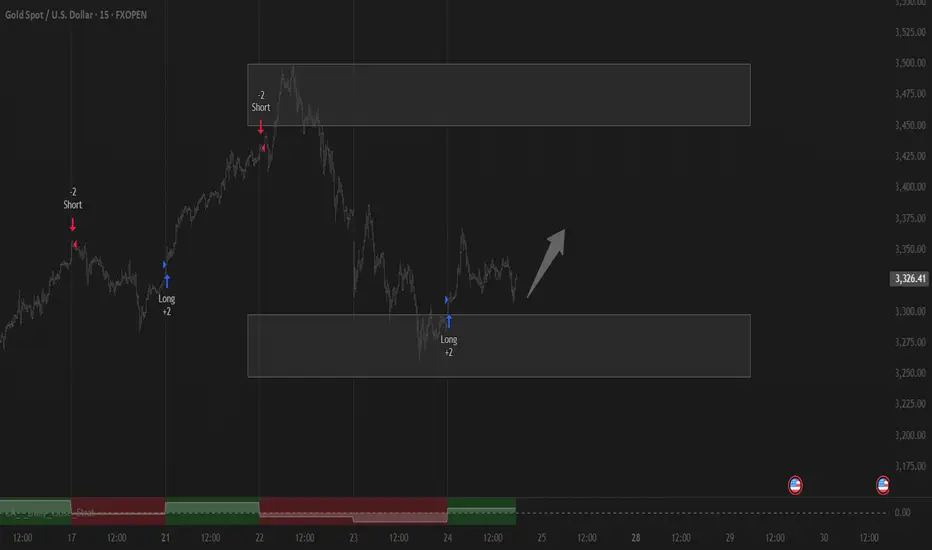
Stuck in the Middle – Which Ride Will Price Choose?After analyzing the 2-hour chart, we can see that price has been bouncing around like a pinball between 3374 and 3264 — rejected twice at the top, supported twice at the bottom.
Currently, price is chilling at 3309, smack in the middle of the range, probably wondering what to do with its life.
Now, 3345 is standing tall as a strong resistance. If price finds the courage to break above 3345, it might speed its way up to 3419 like it’s late for a meeting.
But if it gets shy and turns back down, don’t be surprised to see it sliding toward 3148 instead — much easier, much faster, and with way less drama.
