OIL buy setup H1Hello! Friends,
Greetings. Please leave a Like if you like the idea.
Before start talking about technical Let's share your LOVE by giving me LIKES to support this work. Thanks in advance.
OIL_CRUDE trade ideas

Buy Opportunity🛢️ WTI Crude Oil (4H) – Bullish Reversal Setup
WTI has hit a significant support zone near $59.30, aligning with a previous demand area and low-volume node from earlier consolidation. Price action suggests potential exhaustion in the selling momentum as indicated by the histogram flattening.
🟢 Entry: $59.32
🎯 Target: $64.69 – Previous swing high and key supply level
🛑 Stop Loss: $57.32
📊 Risk/Reward Ratio: 2.79
📆 Target Date: May 6, 2025
📈 Projected Move: +9.06% / +$5.37
🔍 Key Observations:
Strong support area with prior reaction.
Price now trading at low end of value zone (yellow-blue volume profile), often signaling reaccumulation.
Histogram shows bearish momentum waning – potential for shift in trend.
A move above $61.83 could accelerate bullish continuation.
📌 Bias: Bullish – Buy the dip with confirmation above $60 for safer entry.

Oil - Short Term Sell Trade Update!!!Hi Traders, on April 17th I shared this idea "Oil - Looking To Sell Pullbacks In The Short Term"
I expected to see bearish continuation until the two Fibonacci resistance zones hold. You can read the full post using the link above.
The price is currently holding in the first Fibonacci resistance zone.
Until both the Fibonacci resistance zones hold my bearish view still remains.
If you enjoy this idea, don’t forget to LIKE 👍, FOLLOW ✅, SHARE 🙌, and COMMENT ✍! Drop your thoughts and charts below to keep the discussion going. Your support helps keep this content free and reach more people! 🚀
-------------------------------------------------------------------------------------------------------------------
Disclosure: I am part of Trade Nation's Influencer program and receive a monthly fee for using their TradingView charts in my analysis.

WTI rises above $57.50, continues recovery despite concerns overWest Texas Intermediate (WTI) crude Oil price continues to recover during Asian trading on Tuesday, hovering around $57.60 per barrel after a nearly 2% decline on Monday. However, gains were capped by concerns over rising global supply following an OPEC+ decision to accelerate output increases.
Last week, OPEC+, the Organization of the Petroleum Exporting Countries and its allies, agreed to ramp up production for a second straight month, announcing an additional 411,000 barrels per day (bpd) increase for June. This increase, contributed by eight members including Russia, brings the combined rise for April, May, and June to 960,000 bpd—effectively reversing 44% of the 2.2 million bpd in cuts implemented since 2022, according to Reuters estimates.
Sources within the group told Reuters that OPEC+ could fully reverse its voluntary cuts by the end of October if compliance with output quotas does not improve. Saudi Arabia is reportedly pressuring the group to accelerate the rollback of cuts to penalize Iraq and Kazakhstan for their repeated failure to meet agreed production targets.

Energy is life: tailwind for the global economy?Oil prices in gold in a clear down trend, presumably on the back of increased shale production and greater renewables, and resurgence of nuclear. Unless demand accelerates (AI? middle class growth in India?), this is very supportive of economic growth.

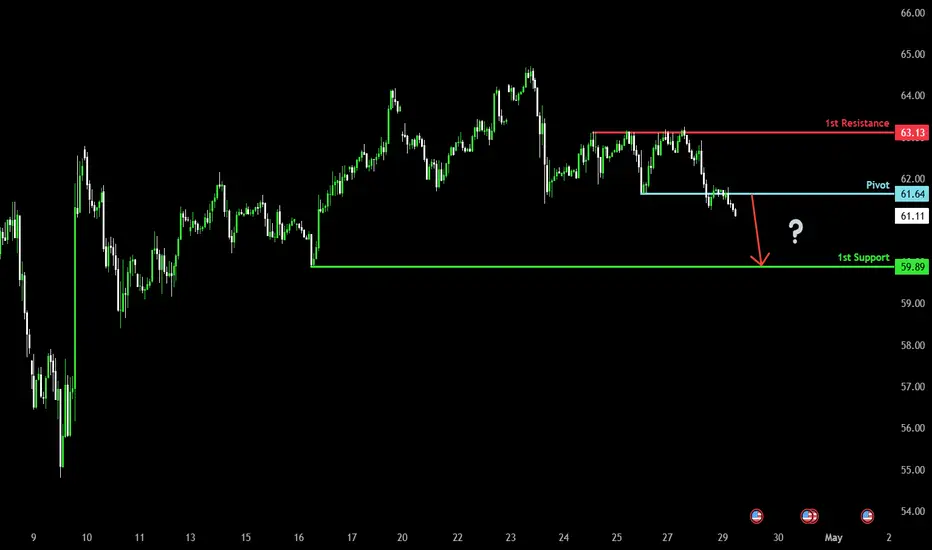
Bearish drop off pullback resistance?WTI Oil (XTI/USD) has rejected off the pivot which is a pullback resistance and could drop to the pullback support.
Pivot: 61.64
1st Support: 59.89
1st Resistance: 63.13
Risk Warning:
Trading Forex and CFDs carries a high level of risk to your capital and you should only trade with money you can afford to lose. Trading Forex and CFDs may not be suitable for all investors, so please ensure that you fully understand the risks involved and seek independent advice if necessary.
Disclaimer:
The above opinions given constitute general market commentary, and do not constitute the opinion or advice of IC Markets or any form of personal or investment advice.
Any opinions, news, research, analyses, prices, other information, or links to third-party sites contained on this website are provided on an "as-is" basis, are intended only to be informative, is not an advice nor a recommendation, nor research, or a record of our trading prices, or an offer of, or solicitation for a transaction in any financial instrument and thus should not be treated as such. The information provided does not involve any specific investment objectives, financial situation and needs of any specific person who may receive it. Please be aware, that past performance is not a reliable indicator of future performance and/or results. Past Performance or Forward-looking scenarios based upon the reasonable beliefs of the third-party provider are not a guarantee of future performance. Actual results may differ materially from those anticipated in forward-looking or past performance statements. IC Markets makes no representation or warranty and assumes no liability as to the accuracy or completeness of the information provided, nor any loss arising from any investment based on a recommendation, forecast or any information supplied by any third-party.
Crude Oil's Bearish Trend Continues: Intraday Trading StrategiesDuring the US trading session on Monday, crude oil recovered part of the losses from the sharp decline at the opening of this week. Previously, OPEC+ unexpectedly increased production again, causing crude oil to continue the bearish trend that has been gradually taking shape since March.
Today, the price of crude oil first rose and then fell. After hitting a new low, the upward trend continued, but when it reached around $57.7, it encountered significant resistance. Looking ahead, it is expected that crude oil will experience an oscillation phase first, and then continue its downward trend.
Currently, crude oil is still in a bear - dominated trend. For intraday trading strategies, it is recommended to focus on short - selling on rallies and use buying on dips as a secondary approach. Pay close attention to the resistance range of $57.7 - $58.5 on the upside and the support range of $55.5 - $54.0 on the downside.
USOIL
sell@57.30-57.50
tp:56.50-56.00
Investment itself is not risky; it is only when investment is out of control that risks occur. When trading, always remember not to act on impulse. I will share trading signals every day. All the signals have been accurate without any mistakes for a whole month. No matter what gains or losses you've had in the past, with my help, you have the hope of achieving a breakthrough in your investment.

The decisive day of major data (USOIL)
Yesterday, it was pointed out in the analysis circle: The support of 58 needs to be tested. Sure enough, buying at low levels continued to expand profits. The current price is 59.6. From the pressure analysis, the market is still affected by data that oversupply, and institutions will not reduce production in a short time. Therefore, oil prices will fall further,
The oil price broke through 59. Due to supply reasons, the market still has a downward range. 60-61 is a good choice to sell in succession.
tp58-57

Oil Short: Ending Diagonal and Rising WedgeI propose that Oil is a good short candidate because of what I am seeing:
1. Rising Wedge
2. Ending Diagonal within the Rising Wedge
I propose 3 entry points for shorting but mention that if you are shorting at the top of the trendline, to cater for false breakout, meaning more allowance in your stop.
Good luck!

Can oil prices continue to be shorted? Of courseSaudi Arabia made a major strategic shift, willing to accept low oil prices and unwilling to cut supply.
Oil prices fell sharply as a result.
It is expected that oil prices will hit 55-56 in the short term, so the operation is still mainly shorting oil prices. Overcapacity.

USOIL is ready to push againNo comment needed. All information is in the chart analysis.
Steps to follow:
Analyze yourself.
Take the position with SL and Take Profits.
Wait, it may take a couple of days, so take a break and step away from the screen from time to time, just like I do :)
Get the result.
I will update the trade every day.
Like, comment with your good mood or viewpoint, share with your circle. It’s together that we get stronger!
Good trades, Traders!
The golden bear

XTIUSD – 4H Short Position ExplanationI have entered a short position on XTIUSD (WTI Crude Oil) based on a multi-timeframe bearish confluence setup:
Weekly and Daily Trend: The overall structure on both the weekly and daily charts is bearish, showing a consistent downtrend and favoring sell setups.
Daily Chart Structure: Recently, price formed a lower high on the daily timeframe, indicating continued bearish pressure and a rejection from a key resistance zone.
4H Price Action: On the 4-hour chart, price has broken a major support level, confirming the bearish momentum. This breakdown increases the probability of further downside movement.
Trendline & Structure: The pair is respecting a descending trendline, further supporting the bearish scenario.
RSI Confirmation: The RSI has dropped below 40 and continues to trend downward, reflecting bearish strength without yet being oversold.
This trade aligns with the higher timeframe trend, with a clear break of support and momentum favoring sellers. The risk is managed above the broken structure, and the setup offers a favorable risk-to-reward ratio.

USOIL Today's strategyFrom a technical perspective, if USOIL can take advantage of the weakening of the DXY, stabilize and rebound near the current price, and break through the key resistance level, it may be able to form an upward trend. However, if it fails to effectively withstand the impact of the production increase by OPEC+, and breaks below the key support level, the price is likely to decline further.
Currently, it is necessary to closely monitor the competition around the price level of $55. If this level can be held, the probability of a rebound will increase. Once it is broken, the next support level may be around the $53 area. At the same time, continuously tracking the trend of the DXY and the subsequent policy dynamics of OPEC+ is of vital importance for judging the future trend of USOIL.
USOIL
buy@55-56
tp:57.5-58.5
I am committed to sharing trading signals every day. Among them, real-time signals will be flexibly pushed according to market dynamics. All the signals sent out last week accurately matched the market trends, helping numerous traders achieve substantial profits. Regardless of your previous investment performance, I believe that with the support of my professional strategies and timely signals, I will surely be able to assist you in breaking through investment bottlenecks and achieving new breakthroughs in the trading field.

USOIL SPOT CASH ANALYSIS Oil Analysis:
Overall Trend: The general trend remains bearish, moving towards key supportive correction zones aligned with Fibonacci retracement levels.
Technical Signals:
A regular hidden positive divergence has appeared, suggesting a potential upward movement from the corrective Fibonacci levels.
Outlook:
Based on the current setup, there are expectations for a bullish rebound from the corrective zones toward higher target areas, as illustrated in the accompanying chart.

Analysis of the Market Trend for Next WeekThe price of crude oil futures declined on Friday, falling by approximately 1% during the session, giving back the gains brought about by a brief technical rebound. Bearish demand signals continued to dominate traders' sentiment. The price of crude oil is likely to drop by more than 7% this week, which reflects the growing concerns in the market about the weakening of global demand. Traders remain cautious ahead of the crucial OPEC+ meeting scheduled for May 5th. It is expected that some member states will push for an acceleration of production increases before June. There are reports that Saudi Arabia has hinted that it has no intention of supporting oil prices through a new round of production cuts, which has further intensified the downward pressure on oil prices.
In terms of demand, the market remains skeptical about potential trade negotiations. The Ministry of Commerce of China stated that it is evaluating the proposal put forward by the United States to resume tariff negotiations. Analysts said that the trade environment remains unstable and fraught with uncertainties.
Crude oil showed a trend of rising first and then falling today. At the same time, the oil price correction broke below the support line, and the bearish trend of oil prices is expected to enter a further acceleration stage. After the rise first and then the fall, the demarcation line between the bulls and bears of oil prices is around $59.3. If it is under pressure again, it will indicate the continuation of the future trend.

USOIL BEARISH BIAS RIGHT NOW| SHORT
USOIL SIGNAL
Trade Direction: short
Entry Level: 63.13
Target Level: 61.78
Stop Loss: 64.03
RISK PROFILE
Risk level: medium
Suggested risk: 1%
Timeframe: 1h
Disclosure: I am part of Trade Nation's Influencer program and receive a monthly fee for using their TradingView charts in my analysis.
✅LIKE AND COMMENT MY IDEAS✅

Oil is Doomed: Time to SELL (Part 1/3)A Perfect Storm for Oil Has Begun
The start of April triggered a brutal selloff in oil, and it's only the beginning. Here’s why:
🛑 Global Trade Wars
On April 2nd, Trump launched a full-scale trade war. New tariffs could reach 23% — the highest in a century. China, the world’s largest oil importer, now faces 145% tariffs. Global trade slowdown = weaker demand for oil. Result? Oil dropped 10% in just 2 days — one of the worst drops in history.
📉 US at Risk Too
Goldman Sachs raised recession odds from 15% to 35%. Atlanta FED sees weakening GDP. The whole world slows down — and so does oil demand.
🛢️ OPEC Surprise Output Hike
OPEC+ has started increasing output — over 2.2 million barrels per day in 2025. The April hike alone was supposed to be 138,000 bpd, but turned out to be 411,000 bpd — triple the forecast. This is a MAJOR bearish shock to the market.
Flashback: Spring 2020 — OPEC raised output during an economic crisis. Oil dropped 65% .

Rising Wedge and Triple topThe price has broken out of the rising wedge pattern followed by a pullback that has formed a triple top on the 1-hour timeframe, if the price makes a lower low, we will see a bearish impulse
WE ONLY TRADE PULLBACKS

OILIt is in the ascending channel for 15 minutes.
The blue line I drew is the middle 🔥
If it holds, it will climb to the channel ceiling again🔼 and if it breaks, it will correct to the channel floor🔽
Keep an eye on the blue line 🙂🕯

WTI Oil H4 | Swing-high resistance at 50% Fibonacci retracementWTI oil (USOIL) is rising towards a swing-high resistance and could potentially reverse off this level to drop lower.
Sell entry is at 59.68 which is a swing-high resistance that aligns close to the 50.0% Fibonacci retracement.
Stop loss is at 62.30 which is a level that sits above an overlap resistance.
Take profit is at 56.05 which is a multi-swing-low support.
High Risk Investment Warning
Trading Forex/CFDs on margin carries a high level of risk and may not be suitable for all investors. Leverage can work against you.
Stratos Markets Limited (tradu.com):
CFDs are complex instruments and come with a high risk of losing money rapidly due to leverage. 63% of retail investor accounts lose money when trading CFDs with this provider. You should consider whether you understand how CFDs work and whether you can afford to take the high risk of losing your money.
Stratos Europe Ltd (tradu.com):
CFDs are complex instruments and come with a high risk of losing money rapidly due to leverage. 63% of retail investor accounts lose money when trading CFDs with this provider. You should consider whether you understand how CFDs work and whether you can afford to take the high risk of losing your money.
Stratos Global LLC (tradu.com):
Losses can exceed deposits.
Please be advised that the information presented on TradingView is provided to Tradu (‘Company’, ‘we’) by a third-party provider (‘TFA Global Pte Ltd’). Please be reminded that you are solely responsible for the trading decisions on your account. There is a very high degree of risk involved in trading. Any information and/or content is intended entirely for research, educational and informational purposes only and does not constitute investment or consultation advice or investment strategy. The information is not tailored to the investment needs of any specific person and therefore does not involve a consideration of any of the investment objectives, financial situation or needs of any viewer that may receive it. Kindly also note that past performance is not a reliable indicator of future results. Actual results may differ materially from those anticipated in forward-looking or past performance statements. We assume no liability as to the accuracy or completeness of any of the information and/or content provided herein and the Company cannot be held responsible for any omission, mistake nor for any loss or damage including without limitation to any loss of profit which may arise from reliance on any information supplied by TFA Global Pte Ltd.
The speaker(s) is neither an employee, agent nor representative of Tradu and is therefore acting independently. The opinions given are their own, constitute general market commentary, and do not constitute the opinion or advice of Tradu or any form of personal or investment advice. Tradu neither endorses nor guarantees offerings of third-party speakers, nor is Tradu responsible for the content, veracity or opinions of third-party speakers, presenters or participants.

USOIL trading opportunities.After the "OPEC+ continued to increase production" on Monday, USOIL continued to fall to a four-year low near 55. However, it rebounded after opening low on Monday. It continued on Tuesday. Is it no longer able to fall?
Ludvig believes that it will continue to fall. Because the decline is caused by the growth of production capacity. The rise is caused by geopolitical strategic reserve materials. One of these two directly affects the trend of OIL, and the other indirectly.
The trend of economic data API/EAI will continue to be released. If the geopolitical weakening situation, the oil price data released is roughly negative, so it will continue to fall. But if the impact of geopolitics intensifies, this is a positive factor.
So the current trading direction that can be determined is to continue to short.
In terms of trading, traders with large funds can sell at the current price, and those with small funds can wait until the market returns to above 59 to sell.
The band trading center continues to update new real-time trading opportunities. If you don’t know how to trade, or don’t want to miss the next real-time trading opportunity, remember to follow me.

USOIL SENDS CLEAR BEARISH SIGNALS|SHORT
USOIL SIGNAL
Trade Direction: short
Entry Level: 64.59
Target Level: 60.50
Stop Loss: 67.30
RISK PROFILE
Risk level: medium
Suggested risk: 1%
Timeframe: 12h
Disclosure: I am part of Trade Nation's Influencer program and receive a monthly fee for using their TradingView charts in my analysis.
✅LIKE AND COMMENT MY IDEAS✅

OIL: Very bearish Monthly closeOIL ST/MT Outlook: Sell
From FA perspective, Oil is in downtrend:
1- Worldwide recession is/will create a lower demand for oil.
2- Risk: Agreements between Iran-USA and Ukraine-Russia will fade out any risk related.
From TA perspective:
1- Monthly close is a strong bearish. A continuation down is expected.
2- Next major stop is around $40.
