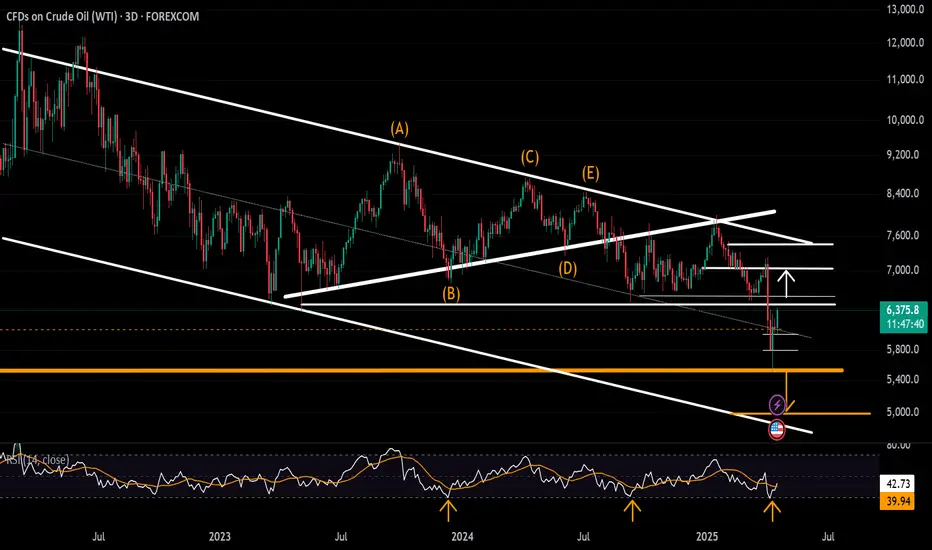
Why Oil Could Gap Down on Monday▫️ Context
Amid ceasefire news 🕊️ and my dissatisfaction 😤 with the previous wave count, I spent 3 hours ⏳ searching for options with a sharp drop on Monday ⬇️.
▫️ What I Found
1️⃣ Complex Wave Count 🧩: To understand the wave logic, zoom in 📊.
2️⃣ Elliott Wave Rules 🧠⚡: Interpreting them correctly is like soldering a circuit board without instructions 🔧.
3️⃣ Why Now? 🌟: It’s nearly impossible during the week (market volatility + time pressure), but weekends are perfect 🛋️.
▫️ Takeaways
→ Glad we held short positions over the weekend 🤞.
→ News is overwhelmingly positive 📰 (but bearish for oil due to tariffs).
→ In a correction, keep positions aligned with the trend.
OIL_CRUDE trade ideas

OIL Approaching Critical Resistance –Will Bulls Hold Control?🔍 Price has broken above the 62.94 resistance and is now approaching the 65.75 resistance. Momentum is bullish, but the next move depends on how price reacts at this level.
📌 Marked Zones:
• Resistance: 65.75 ❌ | 68.70 🔼 | 71.88 🔼
• Support: 62.94 ⚠️ | 59.17 🔽 | 55.15 🔽
📈 Scenarios:
• Bullish Bias: A clean break and retest above 65.75 could open the way to 68.70.
• Bearish Bias: Rejection from 65.75 or failure to hold above 62.94 may lead to a drop toward 59.17.
📘 This is not financial advice. Always trade your plan.

Recent correlation breakdown between $USOIL and $DXYUsually, market watchers will say if the Dollar index TVC:DXY is down then commodities like Crude Oil and Gold should outperform. But recent market events have invalidated this assessment. Since 2022 we see that there is a correlation breakdown between TVC:USOIL and $DXY. These 2 indexes have been moving in tandem recently. In 2025 we saw a massive sale in the TVC:DXY and a similar downturn in the US Dollar index. With TVC:DXY below 100 and TVC:USOIL recently below 60 $, these 2 indexes are clearly indicating a US recession with low Oil demand.
IN this chart we see that the next key support levels in TVC:USOIL is 54 $. If we go below 54 $ then the next level to watch will be 35 $. That will be a recessionary scenario last seen during COVID lows. That can bring down the TVC:DXY to 90 levels. All those will indicate a deep recession which is not my base case scenario. My assessment we will see TVC:USOIL @ 55 $ and TVC:DXY @ 95 and then we will hover around those levels.
Verdict: TVC:USOIL can touch 55 $ if TVC:DXY touches 95.

USOIL: Target Is Down! Short!
My dear friends,
Today we will analyse USOIL together☺️
The market is at an inflection zone and price has now reached an area around 64.411 where previous reversals or breakouts have occurred.And a price reaction that we are seeing on multiple timeframes here could signal the next move down so we can enter on confirmation, and target the next key level of 63.338..Stop-loss is recommended beyond the inflection zone.
❤️Sending you lots of Love and Hugs❤️

Oil’s Red-Hot Crash: the Iranian Trigger? 🛢️☕ #OilisMyCoffee | 📐 #TechnicalAnalysis
The most frustrating thing is when the market follows the script, but your account is in a drawdown 😭 Corrections are sneaky 🐍 Mid-week, I leaned toward the red scenario 🔴 (see last week’s chart), but the market suddenly shifted to black ⚫️.
Now the uncertainty: How and when will the diagonal end? I see at least 3 scenarios:
🔴 Red
⚫️ Black
🔵 Blue
Waiting for a resolution ⚡️ — so I closed positions ahead of the weekend. Iran negotiations in Rome on Saturday 🤝 With moderate progress, prices might dip slightly before surging upward ahead of a reversal next week.
What will trigger a crash? No clue 🤷 But S&P500 is also eyeing a downside after consolidation 📉 Possible triggers: U.S. market events or global financial shocks dragging oil down without geopolitics.
Weekly results:
➖ -10% on the master account
➖ Oil & gas portfolio yield dropped to 103%
🔥 Sharpest weekly drop in the account’s history
⚠️ Disclaimer:
Our analysis is food for thought 💡, not trading signals 🚫📊.
Trade with a cool head ❄️, a clear plan 📝, and your own analysis 👁️🗨️.
💬 Your predictions?
🔄 Drop your analysis below ➡️: How do you assess risks and opportunities? 🎯

Major Crash on USOIL ???US OIL in danger of collapsing
Trading plan
SL:60
TP:50/ floating
Trading set up
break of major support since 2023 at 65 level
Lower low lower high that indicates bearish momentum
price below its moving averages that shows seller pressure
price rejects 0,618 fib retracement
reasoning:
trade war, China retaliation, global demand slowdown, and oil has broken its yearly major support.

USOIL: Start Shorting
After reaching $55, USOIL started to rise. Currently, it is approaching the key resistance level, which is around $64.5. You can start shorting when it reaches this area.
All the signals I sent have been profitable, and I will continue to send accurate signals.
USOIL Trading Strategy for Next Week:
usoil sell@64.5-65
tp:63-61

USOIL BEST PLACE TO SELL FROM|SHORT
USOIL SIGNAL
Trade Direction: short
Entry Level: 63.67
Target Level: 56.31
Stop Loss: 68.58
RISK PROFILE
Risk level: medium
Suggested risk: 1%
Timeframe: 9h
Disclosure: I am part of Trade Nation's Influencer program and receive a monthly fee for using their TradingView charts in my analysis.
✅LIKE AND COMMENT MY IDEAS✅

USOIL SELL AT RESISTANCEUSOIL Going to fall till 47. Sell at resistance marked in chart, then go with target 1 and Target 2,
Now wait till reach the resistance..

Crude Oil Holds at Key ResistanceFollowing a sharp rebound from the $55 low—mirroring broader market strength and gains in U.S. indices—oil is now hovering near a key resistance level at $64. Meanwhile, major U.S. indices remain below their respective resistance zones, awaiting confirmation of further uptrends.
A sustained break and hold above $64 could open the door for additional upside toward $66 and $70.
On the downside, if gains fail to hold and prices slip back below $64, support levels to watch are $60, $58, and $55.
A decisive break below $55 may trigger a steeper decline, potentially driving oil prices back toward the $49 per barrel region.
Written by Razan Hilal, CMT
crude oil sellprice is in wfvg if price reach the fair value area tan look for sell,before u sell gor on 4hour chart look for 4hfvg to form and sell from 4fvg

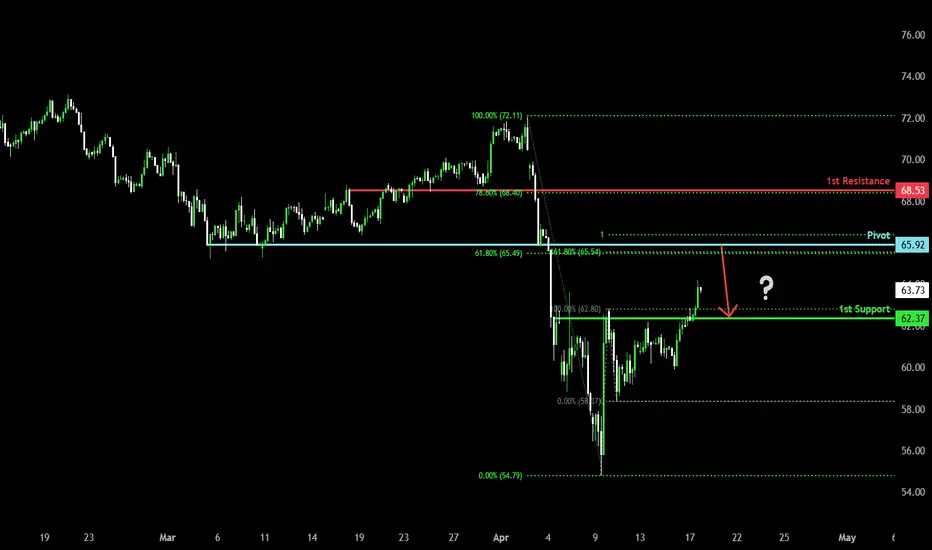
Bearish reversal?WTI Oil (XTI/USD) is rising towards the pivot and could reverse to the 1st support.
Pivot: 65.92
1st Support: 62.37
1st Resistance: 68.53
Risk Warning:
Trading Forex and CFDs carries a high level of risk to your capital and you should only trade with money you can afford to lose. Trading Forex and CFDs may not be suitable for all investors, so please ensure that you fully understand the risks involved and seek independent advice if necessary.
Disclaimer:
The above opinions given constitute general market commentary, and do not constitute the opinion or advice of IC Markets or any form of personal or investment advice.
Any opinions, news, research, analyses, prices, other information, or links to third-party sites contained on this website are provided on an "as-is" basis, are intended only to be informative, is not an advice nor a recommendation, nor research, or a record of our trading prices, or an offer of, or solicitation for a transaction in any financial instrument and thus should not be treated as such. The information provided does not involve any specific investment objectives, financial situation and needs of any specific person who may receive it. Please be aware, that past performance is not a reliable indicator of future performance and/or results. Past Performance or Forward-looking scenarios based upon the reasonable beliefs of the third-party provider are not a guarantee of future performance. Actual results may differ materially from those anticipated in forward-looking or past performance statements. IC Markets makes no representation or warranty and assumes no liability as to the accuracy or completeness of the information provided, nor any loss arising from any investment based on a recommendation, forecast or any information supplied by any third-party.
US OIL buy setupHello! Friends,
Greetings. Please leave a Like if you like the idea.
Before start talking about technical Let's share your LOVE by giving me LIKES to support this work. Thanks in advance.

USOIL BULLISH BREAKOUT|LONG|
✅CRUDE OIL is going up now
And the price made a bullish
Breakout of the key horizontal
Level of 63.00$ which is now
A support so we are bullish biased
And we will be expecting a
Bullish continuation until
Oil hits the horizontal
Resistance above around 65.61$
LONG🚀
✅Like and subscribe to never miss a new idea!✅
Disclosure: I am part of Trade Nation's Influencer program and receive a monthly fee for using their TradingView charts in my analysis.

Bearish reversal off pullback resistance?USO/USD is rising towards the resistance level which is a pullback resistance that lines up with the 161.8% Fibonacci extension and the 61.8% Fibonacci retracement and could reverse from this level to our take profit.
Entry: 65.91
Why we like it:
There is a pullback resistance that lines up with the 161.8% Fibonacci extension and the 61.8% Fibonacci retracement.
Stop loss: 68.48
Why we like it:
There is an overlap resistance level that lines up with the 78.6% Fibonacci retracement.
Take profit: 62.74
Why we like it:
There is a pullback support level.
Enjoying your TradingView experience? Review us!
Please be advised that the information presented on TradingView is provided to Vantage (‘Vantage Global Limited’, ‘we’) by a third-party provider (‘Everest Fortune Group’). Please be reminded that you are solely responsible for the trading decisions on your account. There is a very high degree of risk involved in trading. Any information and/or content is intended entirely for research, educational and informational purposes only and does not constitute investment or consultation advice or investment strategy. The information is not tailored to the investment needs of any specific person and therefore does not involve a consideration of any of the investment objectives, financial situation or needs of any viewer that may receive it. Kindly also note that past performance is not a reliable indicator of future results. Actual results may differ materially from those anticipated in forward-looking or past performance statements. We assume no liability as to the accuracy or completeness of any of the information and/or content provided herein and the Company cannot be held responsible for any omission, mistake nor for any loss or damage including without limitation to any loss of profit which may arise from reliance on any information supplied by Everest Fortune Group.

Crude rallies on Trump China trade optimism, WTI test key levelCrude oil prices were already on the ascendency but have just hit fresh highs on the day after the latest Trump remarks:
WILL MAKE GOOD DEAL WITH CHINA
WE WILL HAVE A DEAL WITH CHINA
But...
*TRUMP SAYS HE'S IN 'NO RUSH' TO CLOSE DEALS
Anyway WTI has risen to session highs, now testing a major resistance area around $65 give or take $1. The area is shaded on the chart. If we go above this zone then bullish, else the bears remain in control.
By Fawad Razaqzada, market analyst with FOREX.com
USOIL - Bullish ReversalUSOIL is breaking out above its neckline after creating inverse head and shoulder.

Oil - Looking To Sell Pullbacks In The Short TermH4 - Strong bearish move.
No opposite signs.
Currently it looks like a pullback is happening.
Expecting bearish continuation until the two Fibonacci resistance zones hold.
If you enjoy this idea, don’t forget to LIKE 👍, FOLLOW ✅, SHARE 🙌, and COMMENT ✍! Drop your thoughts and charts below to keep the discussion going. Your support helps keep this content free and reach more people! 🚀
--------------------------------------------------------------------------------------------------------------------
Disclosure: I am part of Trade Nation's Influencer program and receive a monthly fee for using their TradingView charts in my analysis.

OIL buy setup H1Hello! Friends,
Greetings. Please leave a Like if you like the idea.
Before start talking about technical Let's share your LOVE by giving me LIKES to support this work. Thanks in advance.

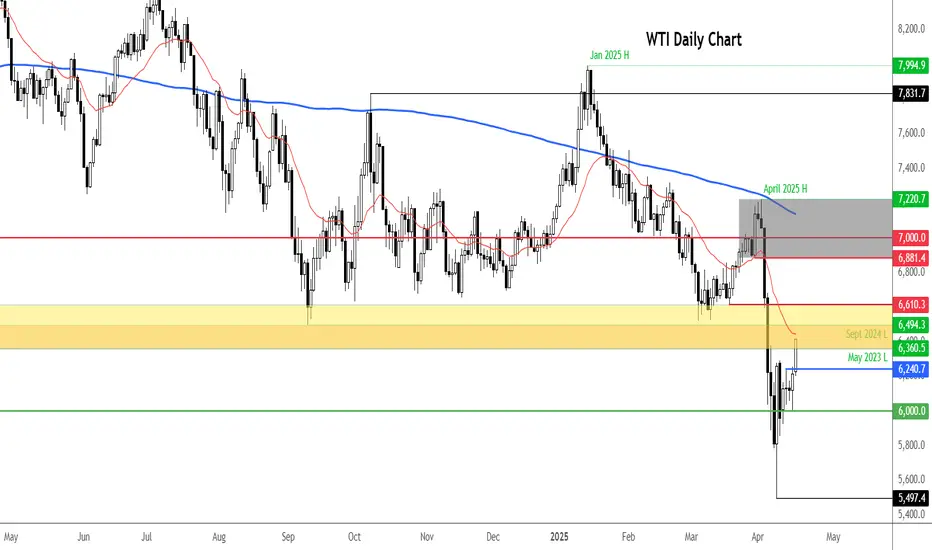
WTI crude oil Wave Analysis – 17 April 2025
- WTI crude oil reversed from key support level 55,00
- Likely to rise to resistance level 65.00
WTI crude oil recently reversed up from the key support level 55,00 standing close to the lower daily and the weekly Bollinger Bands.
The upward reversal from this support level created the weekly Japanese candlesticks reversal pattern long-legged Doji which stopped the previous impulse waves 5 and (3).
Given the strength of the support level 55,00, WTI crude oil can be expected to rise to the next resistance level 65.00 (former multiyear support level, acting as the resistance after it was broken earlier).

XTI/USD "WTI LIGHT CRUDE OIL" Heist Plan (Scalping/Day Trade)🌟Hi! Hola! Ola! Bonjour! Hallo! Marhaba!🌟
Dear Money Makers & Robbers, 🤑 💰💸✈️
Based on 🔥Thief Trading style technical and fundamental analysis🔥, here is our master plan to heist the XTI/USD "WTI LIGHT CRUDE OIL" Energy market. Please adhere to the strategy I've outlined in the chart, which emphasizes long entry. Our aim is to escape near the high-risk MA Zone. Risky level, overbought market, consolidation, trend reversal, trap at the level where traders and bearish robbers are stronger. 🏆💸"Take profit and treat yourself, traders. You deserve it!💪🏆🎉
Entry 📈 : "The heist is on! Wait for the MA breakout (64.00) then make your move - Bullish profits await!"
however I advise to Place Buy stop orders above the Moving average (or) Place buy limit orders within a 15 or 30 minute timeframe most recent or swing, low or high level for Pullback entries.
📌I strongly advise you to set an "alert (Alarm)" on your chart so you can see when the breakout entry occurs.
Stop Loss 🛑: "🔊 Yo, listen up! 🗣️ If you're lookin' to get in on a buy stop order, don't even think about settin' that stop loss till after the breakout 🚀. You feel me? Now, if you're smart, you'll place that stop loss where I told you to 📍, but if you're a rebel, you can put it wherever you like 🤪 - just don't say I didn't warn you ⚠️. You're playin' with fire 🔥, and it's your risk, not mine 👊."
📍 Thief SL placed at the recent/swing low level Using the 1H timeframe (59.00) Day trade basis.
📍 SL is based on your risk of the trade, lot size and how many multiple orders you have to take.
🏴☠️Target 🎯: 68.70
🧲Scalpers, take note 👀 : only scalp on the Long side. If you have a lot of money, you can go straight away; if not, you can join swing traders and carry out the robbery plan. Use trailing SL to safeguard your money 💰.
🛢️ XTI/USD "WTI LIGHT CRUDE OIL" Energy Market Heist Plan (Scalping/Day) is currently experiencing a bullishness,., driven by several key factors. ☝☝☝
📰🗞️Get & Read the Fundamental, Macro Economics, COT Report, Seasonal Factors, Intermarket Analysis, Inventory and Storage Analysis, Sentimental Outlook, Future trend targets and Overall outlook score..., Go ahead to check 👉👉👉🔗
⚠️Trading Alert : News Releases and Position Management 📰 🗞️ 🚫🚏
As a reminder, news releases can have a significant impact on market prices and volatility. To minimize potential losses and protect your running positions,
we recommend the following:
Avoid taking new trades during news releases
Use trailing stop-loss orders to protect your running positions and lock in profits
💖Supporting our robbery plan 💥Hit the Boost Button💥 will enable us to effortlessly make and steal money 💰💵. Boost the strength of our robbery team. Every day in this market make money with ease by using the Thief Trading Style.🏆💪🤝❤️🎉🚀
I'll see you soon with another heist plan, so stay tuned 🤑🐱👤🤗🤩

Crude Oil AnalysisFenzoFx—Crude Oil started a bullish wave from $55.15, trading at around $62.20. Momentum slowed near $63.90 resistance.
The Stochastic Oscillator indicates short-term overpricing as Crude Oil remains below $63.90, keeping the bearish trend intact. Price may dip toward $58.90 support, with further pressure potentially driving it to $55.15.
If Crude Oil surpasses $63.90, the bearish outlook invalidates, targeting $65.10 resistance.
>>> No Deposit Bonus
>>> %100 Deposit Bonus
>>> Forex Analysis Contest
All at F enzo F x Decentralized Forex Broker

Trendline BreakThe price has broken a bullish trendline and is now ready to continue its bearish trend, we have several inner pullbacks and now we are ready for a bearish impulse
WE ONLY TRADE PULLBACKS
