US30 4H - Weekly UpdateDow Jones Analysis
The overall trend on Dow Jones remains bearish.
Although a short-term correction toward 39,840 may occur at the market open, this is not my primary scenario.
Main Scenario:
◾ Continuation of the downtrend toward 36,880
◾ A corrective move back to the 39,460 area
◾ Further decline toward the final target at 35,050
Note:
The trend has been studied with high precision and will be updated as needed based on market behavior.
Accurate analysis, remarkable results!
US30 trade ideas

The Dow Jones 100 Year Rising WedgePeople lie. The news lies. But the CHARTS DON"T LIE.
This is a 100 year rising wedge pattern that is occurring on the DJI.
Maybe not today, maybe not tomorrow, maybe not for another 50 years,
but this pattern will break to the downside.
As of now, a return to the original trendline is HIGHLY LIKELY.
NO FEAR, THIS IS OUT OF LOVE.
EYES OPEN.

US30 will drop by another 10% in next 4 weeks📊 My Macro Analysis Breakdown
Covid Crash:
Sharp -25% collapse.
V-shaped recovery, before another -10%
Inflation Explosion (2022):
-21% drop due to Fed rate hikes.
Choppy sideways market after.
Inflation Cooled (Nov-Dec 23):
Big +22% rally when markets priced in rate cuts.
Trump Re-Election (Nov 2024):
Stocks rallied ~8%.
US Tariffs "Lib Day" (April 2025):
Current Phase: Huge initial crash of -10%.
Projection: I am forecasting another -10% to -12% downside toward 32,352 area.
🧠 Why My Prediction Makes Sense:
Markets always overshoot after a major policy shock (tariffs are no small thing — this is bigger than inflation).
Fed won't act yet (cut rates) until serious economic data deterioration happens.
Global slowdown fears are increasing (China, Europe showing signs too).
Corporate earnings for Q1 2025 are about to be revised down = next catalyst for more selling.
Technical structure resembles past correction patterns (Covid, Inflation explosion).
📅 Timing (based on past crashes I charted):
Covid crash: 5-6 weeks.
Inflation crash: 2-3 months.
This one: Likely 4-8 weeks of choppy downside.
⚡ Conclusion:
✅ A prediction of another ~10% drop is totally aligned with both macro fundamentals and technical history.
✅ Expect violent bear market rallies (sharp 2-5% spikes) inside the downtrend — that's normal.
✅ Bias: Sell the rallies, buy safe havens (gold after the dip, bonds).

"US30/DJ30" Index CFD Market Heist Plan (Scalping/Day Trade)🌟Hi! Hola! Ola! Bonjour! Hallo! Marhaba!🌟
Dear Money Makers & Robbers, 🤑💰✈️
Based on 🔥Thief Trading style technical and fundamental analysis🔥, here is our master plan to heist the "US30/DJ30" Index CFD Market. Please adhere to the strategy I've outlined in the chart, which emphasizes short entry. Our aim is the high-risk Green Zone. Risky level, oversold market, consolidation, trend reversal, trap at the level where traders and bullish robbers are stronger. 🏆💸Book Profits Be wealthy and safe trade.💪🏆🎉
Entry 📈 : "The vault is wide open! Swipe the Bearish loot at any price - the heist is on!
however I advise to Place sell limit orders within a 15 or 30 minute timeframe most nearest or swing, low or high level.
Stop Loss 🛑: (42200) Thief SL placed at the nearest / swing high level Using the 3H timeframe scalping / day trade basis.
SL is based on your risk of the trade, lot size and how many multiple orders you have to take.
Target 🎯: 40200
🧲Scalpers, take note 👀 : only scalp on the Short side. If you have a lot of money, you can go straight away; if not, you can join swing traders and carry out the robbery plan. Use trailing SL to safeguard your money 💰.
"US30/DJ30" Index CFD Market Heist Plan (Scalping/Day Trade) is currently experiencing a bearishness,., driven by several key factors.
📰🗞️Get & Read the Fundamental, Macro Economics, COT Report, Geopolitical and News Analysis, Sentimental Outlook, Intermarket Analysis, Index-Specific Analysis, Positioning and future trend targets... go ahead to check 👉👉👉🔗
⚠️Trading Alert : News Releases and Position Management 📰 🗞️ 🚫🚏
As a reminder, news releases can have a significant impact on market prices and volatility. To minimize potential losses and protect your running positions,
we recommend the following:
Avoid taking new trades during news releases
Use trailing stop-loss orders to protect your running positions and lock in profits
💖Supporting our robbery plan 💥Hit the Boost Button💥 will enable us to effortlessly make and steal money 💰💵. Boost the strength of our robbery team. Every day in this market make money with ease by using the Thief Trading Style.🏆💪🤝❤️🎉🚀
I'll see you soon with another heist plan, so stay tuned 🤑🐱👤🤗🤩

US30/DJI "Dow Jones" Index CFD Market Heist Plan (Day or Swing)🌟Hi! Hola! Ola! Bonjour! Hallo! Marhaba!🌟
Dear Money Makers & Robbers, 🤑 💰💸✈️
Based on 🔥Thief Trading style technical and fundamental analysis🔥, here is our master plan to heist the US30/DJI "Dow Jones" Index CFD Market. Please adhere to the strategy I've outlined in the chart, which emphasizes long entry. Our aim is the high-risk Red Zone. Risky level, overbought market, consolidation, trend reversal, trap at the level where traders and bearish robbers are stronger. 🏆💸Book Profits Be wealthy and safe trade.💪🏆🎉
Entry 📈 : "The heist is on! Wait for the MA breakout (42200) then make your move - Bullish profits await!"
however I advise to Place Buy stop orders above the Moving average (or) Place buy limit orders within a 15 or 30 minute timeframe most recent or swing, low or high level.
📌I strongly advise you to set an alert on your chart so you can see when the breakout entry occurs.
Stop Loss 🛑:
Thief SL placed at the recent/swing low level Using the 1H timeframe (41400) swing trade basis.
SL is based on your risk of the trade, lot size and how many multiple orders you have to take.
🏴☠️Target 🎯: 43100 (or) Escape Before the Target
🧲Scalpers, take note 👀 : only scalp on the Long side. If you have a lot of money, you can go straight away; if not, you can join swing traders and carry out the robbery plan. Use trailing SL to safeguard your money 💰.
US30/DJI "Dow Jones" Index CFD Market Heist Plan (Swing/Day) is currently experiencing a bullishness,., driven by several key factors.
📰🗞️Get & Read the Fundamental, Macro, COT Report, Geopolitical and News Analysis, Sentimental Outlook, Intermarket Analysis, Index-Specific Analysis, Positioning and future trend targets.. go ahead to check 👉👉👉
📌Keep in mind that these factors can change rapidly, and it's essential to stay up-to-date with market developments and adjust your analysis accordingly.
⚠️Trading Alert : News Releases and Position Management 📰 🗞️ 🚫🚏
As a reminder, news releases can have a significant impact on market prices and volatility. To minimize potential losses and protect your running positions,
we recommend the following:
Avoid taking new trades during news releases
Use trailing stop-loss orders to protect your running positions and lock in profits
💖Supporting our robbery plan 💥Hit the Boost Button💥 will enable us to effortlessly make and steal money 💰💵. Boost the strength of our robbery team. Every day in this market make money with ease by using the Thief Trading Style.🏆💪🤝❤️🎉🚀
I'll see you soon with another heist plan, so stay tuned 🤑🐱👤🤗🤩

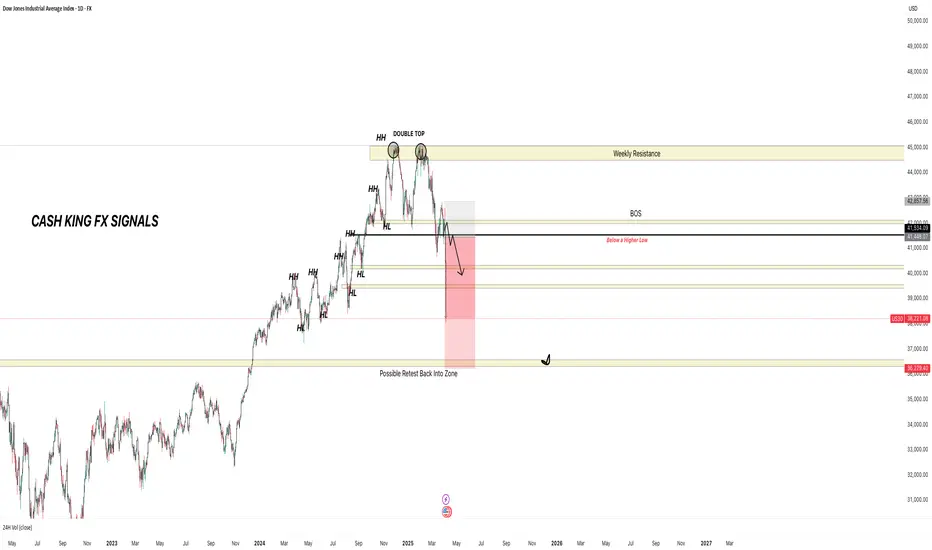
dow jones down 15% -Some time ago, I identified a strong resistance zone near the 45,000 level on the Dow Jones Industrial Average chart, based on historical price action and technical indicators. Since then, the index has experienced a notable correction, declining to approximately 38,314 as of the most recent close — representing a drawdown of nearly 15% from the identified resistance level. This move reinforces the significance of that resistance area and suggests heightened market sensitivity around those levels

Tariffs Didn’t Cause the Correction — It Was Coming Anyway🚩 Intro: Markets Correct — They Don’t Need Permission
Every time the market drops hard, the headlines rush in to explain it. This time, it was President Trump’s dramatic tariff announcement on April 2nd. The media called it a shock.
I didn’t.
I’ve been calling for S&P 500 to drop to 5,200, and NASDAQ-100 to 17,500, since early January.
Not because I predicted tariffs. But because the charts told the story.
The market didn’t fall because of politics — it fell because it had to.
________________________________________
🔥 The Spark: Trump’s “Liberation Day” Tariffs
On April 2, 2025, Trump rolled out an aggressive trade agenda:
• 10% blanket tariff on all imports
• Up to 54% tariffs on Chinese goods
• 25% tariffs on imported cars and parts
• With limited exemptions for USMCA-aligned countries
Markets reacted instantly:
• S&P 500 dropped 4.8% — worst day since 2020
• NASDAQ-100 plunged over 6%
• Tech mega caps lost 5–14% in a day
Sounds like cause and effect, right?
Wrong.
________________________________________
🧠 The Real Cause: A Market That Was Ready to Fall
Let’s talk technicals:
• S&P 500 had printed a textbook double top at the 6100–6150 zone
• NASDAQ-100 had formed a rising wedge, with volume divergence and momentum fading
• RSI divergence was in place since February
• MACD had crossed bearish and also deverging
• Breadth was weakening while indices were still pushing highs
• Sentiment was euphoric, volatility crushed — a classic setup
You didn’t need to guess the news. The structure was screaming reversal.
SP500 CHART:
NASDAQ CHART:
________________________________________
🧩 Why Tariffs Made a Convenient Narrative
Markets love clean stories. And Trump’s tariffs offered everything:
• Emotional trigger
• Economic fear factor
• Political drama
• Global implications
But smart traders know better: markets correct based on positioning, not politics.
As soon as the wedge broke on NAS100 and SPX broke the double top's neck line the path was clear — risk off.
________________________________________
📉 I Was Calling This Since Q1
The targets were public:
SPX = 5,200. NAS100 = 17,500.
And the logic was simple:
• Overextension in AI-led tech
• Complacent VIX environment
• Crowded long positioning
• Bearish divergences and fading momentum
Double Top and Rising Wedge on SPX and Nas100
We didn’t need a reason to drop. The market had been levitating without support. All we needed was a trigger — and we got one.
________________________________________
🧭 Lesson: Trade the Structure, Not the Story
Here’s what I hope you take away:
✅ Setups come first. News comes later.
✅ If it wasn’t tariffs, it would’ve been CPI, earnings, Fed minutes, or a bird on a wire
✅ Don’t chase headlines. Anticipate setups.
The best trades aren’t reactive. They’re built on structure, sentiment, and timing — not waiting for CNBC to tell them what’s happening.
________________________________________
🔚 Conclusion: It Was Never About Tariffs
Tariffs were the match.
But the market was already soaked in gasoline.
This correction was technical, predictable, and clean.
📝 Post Scriptum — The Setup Shapes the Narrative
Let me be clear:
I’m not a Trump fan. Hoho — not by far.
But I’ll swear this on any chart:
If the setup had been the opposite — double bottom, falling wedge, positive divergences, and improving momentum — these exact same tariffs would’ve been interpreted as “bold leadership,” “pro-growth protectionism,” or “markets pricing in a stronger America.”
That’s how it works.
Price action leads. Narrative follows.
When structure is bullish, traders celebrate even bad news.
When structure is bearish, even good news becomes a reason to sell.
So no — it wasn’t about Trump. It never is. It’s about where the market wants to go. The rest is storytelling.
Disclosure: I am part of Trade Nation's Influencer program and receive a monthly fee for using their TradingView charts in my analyses and educational articles.

Update on US30Played out exactly how I expected it price could continue to push but a pull back before continuing is possible
DowJones(USA) AnalysisThis is the perfect example of price and time squaring. I have used Gann technique , trend & Chart pattern. Then I can see that target will come for sure. And it give a overthrows as we well downside. Be watchful. Enjoy.


Dow Jones | How far will it fall ?!All the strong supports have been broken and the stock market is bleeding! You can see one of the important supports ahead on the chart! 3 zones are stacked on top of each other! We are waiting for a reaction to this area.
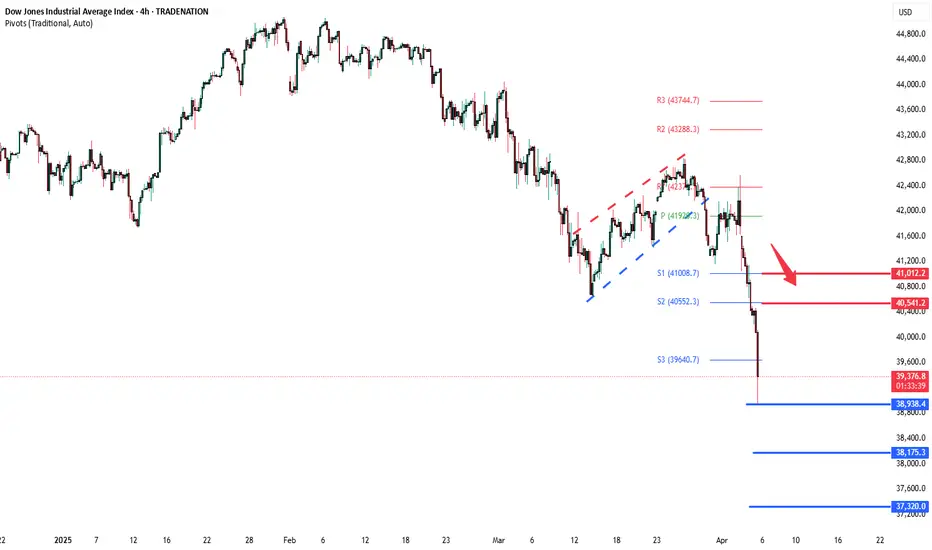
Dow Jones INTRADAY key trading levels ahead of US employmentKey Support and Resistance Levels
Resistance Level 1: 40540
Resistance Level 2: 41000
Resistance Level 3: 42000
Support Level 1: 38940
Support Level 2: 38175
Support Level 3: 37320
This communication is for informational purposes only and should not be viewed as any form of recommendation as to a particular course of action or as investment advice. It is not intended as an offer or solicitation for the purchase or sale of any financial instrument or as an official confirmation of any transaction. Opinions, estimates and assumptions expressed herein are made as of the date of this communication and are subject to change without notice. This communication has been prepared based upon information, including market prices, data and other information, believed to be reliable; however, Trade Nation does not warrant its completeness or accuracy. All market prices and market data contained in or attached to this communication are indicative and subject to change without notice.
Wall Street - Printing a very Dangerous Move!The Dow Jones (US30) is currently testing a critical level within its long-term ascending channel. The next move depends on whether the price holds or breaks this structure.
🔹 Possible Scenarios:
1️⃣ Bullish Bounce (Channel Holds) ✅
If price finds support within the 38,000 - 36,000 zone, we could see a strong rebound.
A bounce from this level may lead to a retest of 42,000 - 44,000, with potential for another attempt at the upper channel near 46,000+.
Confirmation: Look for bullish price action like long wicks or a bullish engulfing candle.
2️⃣ Bearish Breakdown (Channel Breaks) ❌
If the price breaks below the channel and closes under 36,000, this could signal a trend shift.
A breakdown may accelerate selling, leading to further downside targets at 32,000, then 28,000.
Confirmation: A strong weekly close below support with increased volume and no immediate recovery.
📌 Key Takeaway:
Channel intact → Buy dips for potential continuation.
Channel break → Expect deeper correction towards long-term supports.
Let me know your thoughts! Are you bullish or bearish on US30? 🚀📉
If you found this analysis valuable, kindly consider boosting and following for more updates.
Disclaimer: This content is intended for educational purposes only and does not constitute financial advice.

Repeat of covid manipulation - sells to 34000 on US30.Breakdown of where US30 could be heading in the short team but also the long term.

US30 new update, bearish at allhi mates, I'm here with something new. US30 4h timeframe. i think its still bearish, what's your opinion. lets talk about it

No Signs of the Bull ArmyDow Jones Update : The correction appears likely to continue, testing the 40,045–40,467 range. Subsequently, the index is expected to rebound toward the 40,714–40,945.
Additionally, it is worth noting the gap in the 41,173–41,629 range—perhaps the market may find its way there.

US30 - Correction was Predicted in Nov 2024This correction was predicted in Nov 2024 when markets were booming.
We still have room for deeper correction before a pullback.

DOW JONES INDEX (US30): Detailed Support & Resistance Analysis
Here is my latest structure analysis for US30 Index.
Resistance 1: 40650 - 40850 area
Resistance 2: 41150 - 41300 area
Resistance 3: 42550 - 42850 area
Support 1: 40000 - 40250 area
Support 2: 39470 - 39650 area
Support 3: 38400 - 38650 area
Consider these structures for pullback/breakout trading.
❤️Please, support my work with like, thank you!❤️
I am part of Trade Nation's Influencer program and receive a monthly fee for using their TradingView charts in my analysis.

US30 Trade Update – 04/04/2025🚨 US30 Trade Update – 04/04/2025 🚨
📉 US30 Sell-Off Intensifies!
The Dow Jones has now broken below 41,000 and is approaching the critical support at 40,063. Bears are in full control, and if this level fails, we could see a test of 39,279 next.
🔍 Key Observations:
✅ Major rejection at 42,359 resistance
✅ Strong bearish momentum breaking 41,000
🔻 Next Major Support: 40,063 → 39,279
🎯 Trade Plan:
🔹 Short below 40,063 → Target 39,279
🔹 Look for bounce signs at 40,063 for potential reversal
🔹 Long only if price reclaims 40,600+
⚠️ Watch for a reaction at 40,063—this level could determine the next major move.

check the trendIt is expected that the trend will change within the current support area and we will see the beginning of the upward trend. Otherwise, the continuation of the downward trend is likely with the breakdown of the current support area.

Warning Signs Flashing: Dow Jones Breaks Key SupportThe Dow Jones Index has officially broken its rising trendline support, signaling a possible shift in the medium-term trend. After losing this key ascending structure, price is now hovering near the psychological support zone of 40,000, which has historically acted as both resistance and support.
This level is crucial. If it holds, we could see a temporary bounce or consolidation. However, if the 40K zone fails to provide support, the index may head toward the next major support area around 38,000, aligned with the longer-term trendline support.
Do like and follow us
THANK YOU

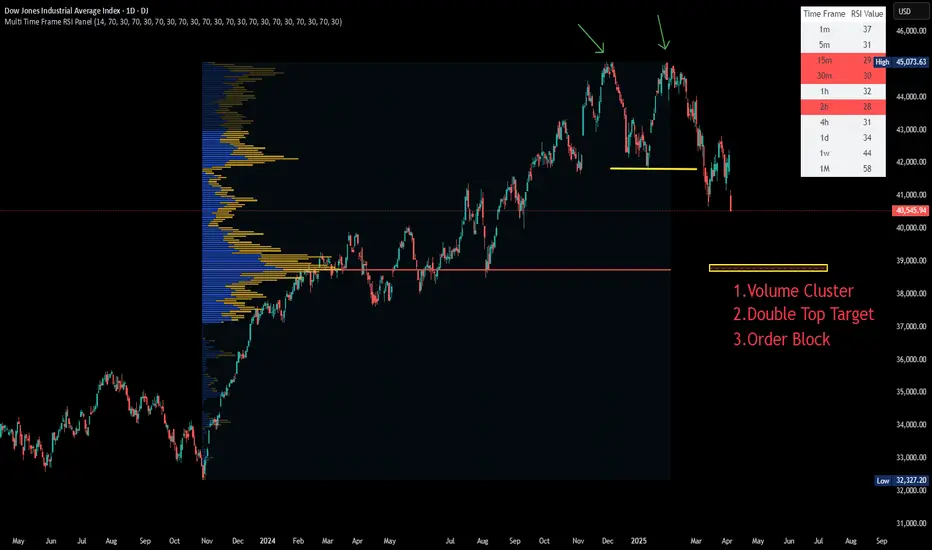
Trade Idea : US30 Short ( MARKET )Technical Analysis Overview:
1. Daily Chart:
• The index is in a clear downtrend, with price action breaking below the moving average.
• MACD is deeply negative, with a bearish divergence and downward momentum.
• RSI at 37.28, indicating approaching oversold territory, but not yet reversing.
2. 15-Minute Chart:
• Strong downward momentum with sharp drop visible.
• MACD is heavily negative, confirming bearish momentum.
• RSI is at 32.71, indicating oversold conditions, but no clear sign of reversal yet.
3. 3-Minute Chart:
• Sharp sell-off followed by consolidation.
• MACD is negative but appears to be flattening, suggesting potential for a short-term bounce or continued consolidation before the next move.
• RSI at 44.38, showing mild recovery from previous lows but still below the midpoint (50).
Trade Idea:
• Position: Short (Sell)
• Entry Level: 41,250 (near minor resistance or after a weak bullish retracement)
• Stop Loss (SL): 41,800 (Above recent consolidation zone or resistance)
• Take Profit (TP): 40,400 (Previous support area with good potential for price to test)
FUSIONMARKETS:US30
