Path to 100 VIXI wrote this note on TVC:VIX a few days ago:
www.tradingview.com
And am now expanding it a bit more.
As someone who was working middle office during the original 2016 Trump Election, Brexit, during the Taper Tantrum and a few other major events - I want to lay out my principles on trading the VIX because spikes like this bring a lot of "first time" VIX traders to something that trades like NOTHING ELSE in the market.
This is not a stock in a short squeeze, this is not a generic index.
This is like nothing you've ever traded before. In fact, I'd encourage you to take advantage of TradingView's chart options and instead look at the chart of -1*$TVC:VIX.
That alone should give you pause.
----------------------------------
So - let's start with the principles of the finance business as laid out in the masterclass which was the movie "Margin Call" .
"John Tuld: There are three ways to make a living in this business: be first, be smarter, or cheat."
1. Be First.
You are not first if you are buying above the historic average of VIX 20-21.
If you were buying CBOE:UVXY since Jan 2025, you'd be up 175% right now and likely looking to re-balance into your desired long term asset positions.
2. Be Smarter.
* Are you taking into consideration the VIXEX Cycle?
* Do you know the effect of VIXEX before or after monthly OpEx?
* Do you know the current implied volatility curve of options ON the VIX?
* Do you know that of the last 4 times the VIX has hit 50, it went on to 80+ 50% of the time after that?
* Yes, I've seen the charts going around about forward S&P X year returns but did you know that after the VIX spike to 80 in October 2008, the market (in a decreasing volatility environment) went on a further 35% decline in the next 4-5 months?
* Where is the MOVE? What are the bond indexes & bond volatility measures doing? And if you don't yet understand that equities ALWAYS reacts to what is going on in the rates / yield world... you'll find out eventually. I hope.
3. Cheat
When things start going wrong, everyone wants an easy solution.
That's why its called a relief rally. It feels like relief - the bottom is in, the worst part is over.
But that is what the really big players have the biggest opportunity to play with the day to day environment.
They know our heuristics. They encourage the formation of cargo cult style investing whether that's HODL in the cryptocurrencies or Bogleheads in the vanguard ETFs.
It's all the same and encourages you to forgot first principles thinking about things like:
1. Is this actually a good price or is it just relatively cheap to recent history?
2. Who's going to have to dilute to survive the next period of tighter lending, import costs from tariffs, or whatever the problem of the day is.
3. VIX correlation - volatility is just a description of the markets. Its not a description of the direction. There is periods where volatility is positively correlated to the price movement (like during earnings beats). Know about this and know when it changes.
4. Etc.
Some have pointed out that is more appropriately a measure of liquidity in the SPX.
When VIX is low, that means there is lots of "friction" to price movement. It means that there is tons of orders on the L2 book keeping the current price from moving in any direction too quickly.
When VIX is high, that means there is very low "friction" to price movement. It means there are very few orders on the L2 book and market makers can "cheat" by appearing to create a low volume rally and then rug pull that price movement very quickly (not via spoofing, more just dynamic management of gamma & delta hedging requirements).
Additionally - volume itself becomes deceptive. Volume is just indicating that a trade happened.
Its not telling you to what degree the spread between the bid and ask has blown out to 1x, 2x, or 5x normal and that trades are executing only at the highest slippage prices in that spread.
All of these things are considerations that the market makers can use to make a "buy the dip" situation that works heavily to their advantage.
TLDR: "If you can't spot the sucker in your first half hour at the table, then you are the sucker"
----------------------------------
So - why / when would VIX go to 100?
In 2020, its easy to forget that a culmination of things stopped the crash at -35%.
* March 17, 2020 VIXEX wiped out a significant amount of long volatility positions.
* March 20, 2020 Opex wiped out a significant proportion of the short term put positions
* March 20, 2020 Fed Reserve announced to provide "enhanced" (i.e. unlimited) liquidity to the
markets starting Monday March 23, 2020.
* April 6th, 2020 Peak of Implied Volatility (point where options "most expensive") - which meant that buyers / sellers started providing more & more liquidity following this point.
In 2025, we have yet to see:
* Any motion towards intervention from the Fed for liquidity.
* Any motion from the significant fundamental investors (we're not close to an attractive P/S or P/E on most stocks for Buffett & Co to start buying)
* Any significant motion from companies on indicating strategies about capital raises, layoffs, or other company level liquidity reactions.
* Any "reset" of options in either volatility or hedging. Numbers below as of April 9, 2025:
- SPY 2.8M Put OI for April 17
- VIX 3.5M Call OI for April 16
Just an example but maybe IF we see those clear and NOT get re-bought for May Opex... we might be ready to call a top here at 50 VIX.
Otherwise.... we're just at another stop on the path to 100.
VIX trade ideas

VIX - Extreme fear in the market: a unique opportunity?Extreme fear in the market: a unique opportunity?
An analysis of the most significant
VIX spikes (1987-2025) and subsequent stock market performance.
The VIX (Volatility Index) is an indicator that reflects the level of fear or uncertainty in the market based on expectations of volatility in the S&P 500 Index.
The VIX's 118% surge from April 4 to April 7, 2025 was the fifth largest 3-day surge in market history.
This surge 🚀 reflects the high level of uncertainty that has developed in the markets.
It is very difficult to make informed investment decisions during such periods.
But we can rely on historical patterns.
After the 20 largest VIX spikes, the S&P 500 Index has consistently delivered exceptional returns:
- After 1 year: 16.5% (vs. 12% in normal periods)
- After 3 years: 45.9% (vs. 39.5% in normal periods)
- After 5 years: 83.0% (vs. 74.4% in normal periods)
The difference in returns over the 4 years is 10.2% above average.
Over the past 40 years, there has only been one negative return (the 2007 spike before the financial crisis), while most extreme fear events have become outstanding buying opportunities. For example, the August 2011 spike was followed by an impressive 117% return over the next five years.
When market panic reaches extreme levels, institutional capital typically steps in against retail sales, setting the stage for stronger long-term growth. History shows that these moments of maximum fear often represent optimal entry points for patient investors.
It is essential to realize that historical patterns do not always hold true in the future. Each crisis has unique characteristics and causes that can lead to different outcomes.
These statistics provide good mathematical expectations, not guarantees.
This has always been the case in the market, and proper handling of math expectations and risk management are the foundations of profitable strategies.
Best regards EXCAVO
_____________________
Disclosure: I am part of Trade Nation's Influencer program and receive a monthly fee for using their TradingView charts in my analysis.

VIX Option Flow Signals Volatility Spike A massive wave of institutional option activity is pointing toward an upcoming surge in volatility—and likely a pullback in equities even more. Here's what the VIX flow is telling us:
🧠 Key Takeaways:
🔺 Aggressive Call Buying on VIX
Heavy blocks on VIX 22–42.5 calls, with most trading at the ask, signaling urgency.
Standout trades include:
1,407x April 22C @ $10.73 – $1.51M
2,535x May 60C @ $1.55 – $394K
5,770x April 40C @ $2.95 – $1.7M
📅 Short- to Mid-Term Focus
Expiries are clustered around April 16 and May 21, suggesting a volatility spike is expected within the next 1–6 weeks.
💵 Big Premiums Paid
Multiple trades between $500K and $1.7M, indicating strong conviction or heavy portfolio hedging.
📉 Minimal Put Activity
Very few puts being bought on VIX, signaling no expectations for volatility to fall.
📊 What This Means for Markets (SPY/QQQ)
This type of flow usually precedes a market correction, a macro catalyst, or event risk. Whether it's CPI, earnings season, or geopolitical flare-ups—institutions are bracing for turbulence.
🔮 Prediction:
Expect a spike in the VIX and downward pressure on major indices like SPY and QQQ in the coming 1–3 weeks.
This flow doesn’t lie—smart money is prepping for a move.

VIX Clips 60 as Market Volatility and Tariff UncertaintyThe VIX Clips 60 as Market Volatility and Uncertainty Surge on Tariff Announcement
The CBOE Volatility Index (VIX), often dubbed the “fear gauge,” surged past the 60 threshold this week—the highest level since August 5, 2023—as markets reacted violently to an unexpected announcement by the U.S. President regarding global tariffs. The sharp rise in the VIX, which measures market expectations of 30-day volatility, underscores the profound uncertainty now gripping investors, with the Dow Jones Industrial Average plummeting over 1,000 points and the S&P 500 entering correction territory. The trigger? A sweeping tariff policy unveiled by the administration on Liberation Day, a symbolic holiday marking a shift in economic strategy, which has sent shockwaves through global markets.
The VIX at 60: A Sign of Extreme Fear
The VIX typically hovers around 15-20 under normal conditions, reflecting moderate uncertainty. However, readings above 30 indicate heightened anxiety, and levels above 50 are rare, historically occurring during major crises like the 2008 financial collapse or the 2020 pandemic sell-off. This week’s spike to 60 marks a dramatic escalation, signaling a market gripped by fear. Analysts attribute this to the suddenness and scale of the President’s tariff announcement, which caught investors off guard after a period of relative calm.
The Liberation Day Tariff Announcement
On Liberation Day—a holiday commemorating historical freedoms—the administration announced a 25% tariff on a broad range of imports from key trading partners, including China, the EU, and others, effective immediately. The move, framed as a “national economic security initiative,” aims to curb perceived trade imbalances and protect domestic industries. However, its immediate impact has been severe:
Scope and Speed: The tariffs apply to $500 billion in goods, targeting sectors like semiconductors, automotive parts, and consumer electronics. The abrupt implementation, with no prior warning or negotiation, has left businesses scrambling to adjust supply chains.
Political Context: The announcement coincided with domestic political tensions, including debates over inflation and job creation. The White House argued the tariffs would “level the playing field” for American workers, but critics warned of retaliation and inflationary pressures.
Market Chaos: Sectors Under Siege
The tariff shockwave rippled across asset classes:
Equities: The S&P 500 fell 2+% on Monday, its worst single-day drop since March 2020. The Nasdaq, heavily weighted in tech stocks reliant on global supply chains, plunged over 5%.
Sectors: Semiconductor firms like Intel and AMD tanked, while automakers such as Ford and Tesla declined sharply.
Expert Analysis: A Volatility Tipping Point
Historical Parallels and Economic Risks
The current volatility mirrors past crises:
2008 Financial Crisis: The VIX hit 80 as Lehman Brothers collapsed, but the current crisis stems from policy, not financial contagion.
2020 Pandemic Sell-Off: The VIX spiked to 82 as lockdowns paralyzed economies, but today’s uncertainty is self-inflicted.
However, the tariff-driven uncertainty poses unique risks:
Inflation: Higher import costs could push inflation back above 4%, complicating the Fed’s rate-cut path.
Global Growth: The World Bank warns that trade wars could shave 2% off global GDP by 2025. Emerging markets, reliant on exports, face currency crises.
Looking Ahead: Can Calm Return?
Markets may stabilize if the administration signals flexibility. Potential pathways include:
Negotiations: A G20 summit in September offers a venue for de-escalation, though diplomatic progress is uncertain.
Policy Reversal: If tariffs are delayed or narrowed, the VIX could retreat. However, the President’s rhetoric suggests a hardline stance.
Corporate Adaptation: Companies might pivot to domestic suppliers, but such shifts take years, prolonging volatility.
Conclusion: A New Era of Uncertainty
The VIX at 60 marks a pivotal moment. Markets are now pricing in not just the immediate tariff impact but a broader shift toward protectionism and policy-driven instability. For investors, the path forward is fraught with uncertainty. While short-term volatility may ebb with reassurances, the long-term consequences—trade wars, inflation, and geopolitical friction—could redefine global economics for years.
With Liberation Day’s tariffs reshaping the landscape, one thing is clear: the era of low volatility is over. The question now is whether policymakers can navigate this new turbulence—or if markets will remain hostages to fear.

Market Prep 4/7Probably a low today. I expect the cash session to reach 4800-4750 by close and maybe sooner.

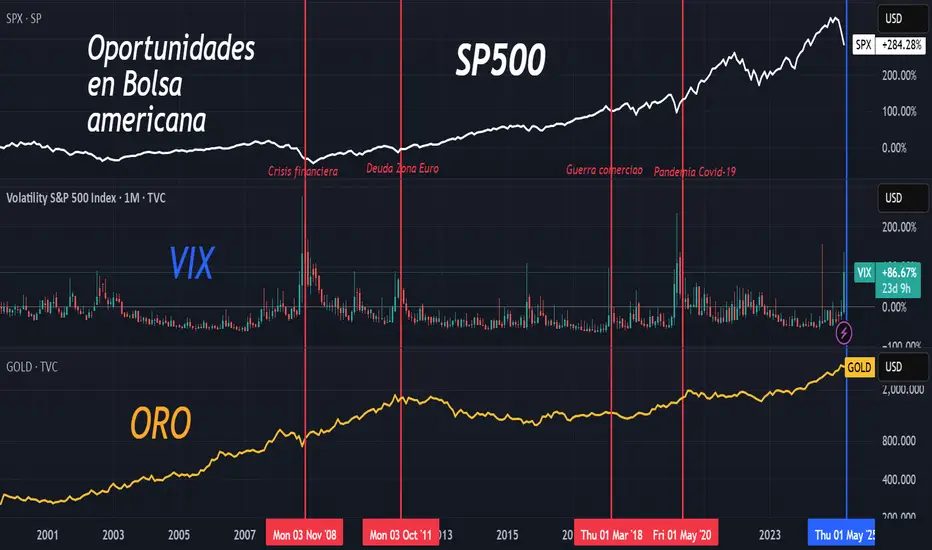
Oportunities in American Stocks sp499We used to have some equities and stocks in a continuing growth now the thing has changed
Don’t Get Trapped! Today’s Market Could Make or Break YouMarket Meltdown or Setup for Generational Wealth? What Traders Need to Know Today 🔥📉
As of April 7, 2025, global financial markets are experiencing significant volatility following the announcement of new tariffs by President Donald Trump. U.S. stock futures indicate a sharp decline at the market open:
* S&P 500 Futures: Down approximately 4.5%.
* Dow Jones Industrial Average Futures: Down around 4%.
* Nasdaq-100 Futures: Down more than 5%.
In such a turbulent environment, traders should exercise heightened caution. Here are some strategies to consider:
1. Prioritize Capital Preservation: Increased volatility can lead to unpredictable market movements. It's advisable to reduce position sizes and set strict stop-loss orders to manage potential losses.
2. Avoid Impulsive Decisions: Rapid market changes can tempt traders into reactive decisions. Stick to your pre-defined trading plan and avoid making trades based on short-term market noise.
3. Stay Informed: Keep abreast of ongoing developments related to trade policies and economic indicators. Reliable news sources and official statements can provide crucial insights that may impact market conditions.
4. Consider Defensive Assets: In times of market downturns, some investors shift towards traditionally safer assets like government bonds or gold. Assess if incorporating such assets aligns with your risk tolerance and investment strategy.
5. Evaluate Long-Term Positions: For long-term investors, market corrections can present opportunities to acquire quality assets at reduced prices. However, ensure that any new positions are in line with your overall investment goals and risk profile.
Given the current market instability, it's essential to remain vigilant and disciplined. Consulting with a financial advisor can also provide personalized guidance tailored to your individual circumstances.

Go Long on VIX as Market Fear Peaks with Trade Tensions
-Key Insights: The VIX has surged to 45.31, the highest level since the COVID
crash, signaling extreme fear in the markets. With trade tensions between the US
and China intensifying and economic fears prevailing, market volatility remains
high. This environment presents a potential opportunity to go long on VIX as
investors seek protection from downside risks.
-Price Targets: Based on current analysis, set price targets for VIX as follows:
- T1: 50
- T2: 55
- S1: 43
- S2: 42
These targets account for continued volatility with potential upside in VIX as
market fear sustains.
-Recent Performance: The VIX's recent performance highlights a significant surge
correlating with increased market volatility. The index has climbed sharply from
previous levels as investors react to negative market drivers, including
indiscriminate selling across various asset classes like stocks, gold, and
cryptocurrencies.
-Expert Analysis: Analysts show cautious optimism in the medium term due to the
heightened volatility but remain wary about immediate long-term entries. Current
market fears pivot around US-China trade tensions, which analysts believe are
central to sustained volatility. Opportunities for day trading are emphasized,
but experts advise prioritizing risk management strategies.
-News Impact: The ongoing trade war between the US and China, alongside
geopolitical developments and a lack of immediate response from central banks
like the Federal Reserve, continues to drive market uncertainty. Declines in
commodities like crude oil and copper underscore economic fears, with the VIX
reflecting this sentiment. Investors are advised to stay vigilant and adjust
strategies according to evolving market conditions.
The VIX Triangle: Countdown to a Bull Run or a Market Meltdown?🧠 What Is the VIX and Why It Matters Right Now
The Volatility Index (VIX), often called the “fear gauge,” has surged to nearly $60, a level we at Vital Direction had anticipated weeks in advance. This dramatic move has injected high volatility across global financial markets — particularly the SPX500, Nasdaq, DAX, and key Asian exchanges like China, Singapore, and Australia.
Such a spike in fear typically signals a pivotal turning point in market sentiment — the kind that leads either to a massive relief rally or a further collapse.
📈 Elliott Wave Analysis: Is VIX About to Complete a Triangle?
Our proprietary Elliott Wave analysis suggests the VIX is forming a classic triangle structure, with wave D likely completed and wave E expected to take the index down to around $16 by mid-September 2025.
This scenario fits with a standard corrective wave pattern, indicating that market panic may be peaking — and that a bullish reversal could be imminent if the structure holds.
⚠️ Critical Technical Level: A sustained breakout above $65.73 would invalidate this triangle structure. That would imply a much more severe market breakdown and trigger deeper fear-driven selloffs across global equities.
📊 SPX500 Forecast: Rare Risk-Reward Setup in Play
If the VIX follows our expected path and declines to $16, we believe the SPX500 and broader US markets could be on the verge of a massive bull run.
This would mark the return of risk-on sentiment and potentially spark fresh highs in major indices and high-beta stocks such as Tesla, Apple, and Amazon.
🎯 Our View: All scenarios remain possible, but we see exceptional risk-to-reward potential building across U.S. equities — particularly in the SPX500. This is one of the cleanest technical setups we’ve seen in months.
🚨 Final Thoughts: All Eyes on the VIX
The VIX is now the key chart to watch.
A move down to wave E at $16 = potential bull market ignition.
A breakout above $65.73 = likely market meltdown and sharp selloffs.
This is a textbook example of how Elliott Wave Theory and volatility analysis can provide a true edge in market timing.

Why Did the #VIX Explode?Trump protests escalated the markets sharply. The VIX exploded because nobody knows what will happen.
💢Why did the #VIX explode?
What we see in the chart is not just a panic, it is an ‘uncertainty shock’.
Although Trump has only been in office for 3 months, he is facing serious street protests due to his aggressive policies and rhetoric.
Such crisis situations are enough to momentarily shake the confidence of global investors in the US, because markets are emotionless, shaped according to events.
Due to the protests, the S&P and NASDAQ have been feared to sell hard
Investors play hedge in such situations.
At the same time, algorithms may even be opening temporary long positions in anticipation of ‘Will the FED intervene?’.
Let's take a look at the scenarios;
If the protests grow, if the clashes spread:
🔸VIX overflows over 50
🔸S&P500 experiences serious selling pressure
🔸Gold and bonds come to the fore
If Trump steps back or the situation calms down:
🔹VIX is quickly withdrawn
🔹Indexes may regain strength
🔹Investors switch to risk-taking again
In short, if the protests grow, this could be not just a VIX jump, but the potential collapse spark of 2025.
#vix #spx #spx #spx500 #nasdaq #nasdaq100

VIX spikingHello y'all. I have no detailed analysis other than this chart looks interesting and we can see historically what this has meant for the economy, although correlation is not causation, of course.
Stay vigilant.

$VIX Hits 45! $BTC Historically Pumps Soon AfterThe TVC:VIX has only hit above 45 on 5 occasions in the history of CRYPTOCAP:BTC
Each time it did, BTC pumped at least 20%

$VIX spike to $80-100 incomingI think there's a large spike coming in VIX despite most people turning bullish on the market and bearish on the VIX.
Price has maintained elevated levels for the past few months, all of the RSIs are in extreme bullish territory and the move looks very similar to the spike that we got on August 5th.
Have no clue what will cause it, whether it's the fed meeting, gov't shutdown or some other outside factor, but the chart is looking like we should see a spike next week up to the $80-103 level.
Let's see how it plays out.

VIX SURGES 50% – Is a Market Crash Unfolding? The Volatility Index (VIX) just skyrocketed 50.90% to 45.30! This is one of the largest single-day spikes in recent history, signaling extreme fear in the markets. Historically, VIX levels this high have only occurred during major financial crises like:
✅ 2008 Financial Crisis
✅ COVID Crash (2020)
So, what’s driving this surge in volatility?
📊 Understanding the VIX Levels
The VIX measures market fear and uncertainty based on S&P 500 options activity.
🟥 Above 25 – 🚨 High Volatility = Market panic, extreme uncertainty
🟧 15-25 – ⚠️ Medium Volatility = Elevated risk, possible correction
🟩 Below 15 – ✅ Low Volatility = Calm market conditions
Right now, we’re deep into the “fear zone” at 45.30, which suggests that investors are in full risk-off mode.
Why Is Volatility Exploding?
1️⃣ Stock Market Sell-Off – The NASDAQ and S&P 500 are plunging as investors flee risk assets.
2️⃣ Recession Fears – Economic indicators are flashing warning signs, and Fed policy remains uncertain.
3️⃣ Geopolitical Risks – Global tensions and economic instability are adding to investor anxiety.
4️⃣ Institutional Hedging – Large funds may be loading up on downside protection, further driving up volatility.
What’s Next?
If the VIX keeps climbing past 50, we could be looking at an even bigger market meltdown.
A reversal below 25 could indicate that fear is cooling off and stabilization is ahead.
Watch for safe-haven moves if money continues flowing into gold, bonds, and the dollar, the fear trade isn’t over yet.
#BearMarket #Recession

130 pm updateMixed signals from the VIX and SPY, but I go over the general idea for the next few weeks....

Emergency VIX Analysis... 30+When I woke up this morning, I had to run my son & his friend to school. When I got back home and sat down in front of this computer, my eyes widened and I said "MY GOD!" Someone said capitulation is a feeling. Well honey... this is it. Spiked VIX, huge gaps down, nausea, & nerves shook. On to the analysis.
We are wicking from the top as of now. But this journey has been a lesson of what can happen during times of a a heightened VIX (sustained time over 20). Here are a couple of things that I have learned and confirmed with my own eyes since the new year (2025).
Monthly wicks should not be ignored. Price needs to regain the top of the wick and hold for further move up.
VIX divergence is a thing. General observations...
VIX up, mkt down = mkt down as VIX continues up
VIX down, mkt up = mkt up as VIX stays down
VIX holding above 20 in a range is still bearish. After major spikes, watch for this. Methodical sell off likely to occur.
If you have other observations to express... please do. Taking a breath as we navigate these bearish times .

VIX Angry Crab Is Set to Spike .The VIX Angry Crab is about to make its move, and it’s ready to pinch! Starting from a cozy 18, this volatile crustacean is eyeing its next targets: TP1, TP2, and TP3.
Whether it’s a scuttle upward or a sideways shuffle, traders beware—this crab doesn’t just crawl, it spikes!
Keep your stop-loss nets ready and your trading claws sharp because when the Angry Crab gets riled up, it’s not just a market indicator; it’s a market mood swing.
As always, make your decisions wisely—after all, even the boldest crab can sometimes get caught in a tide.
SEYED.

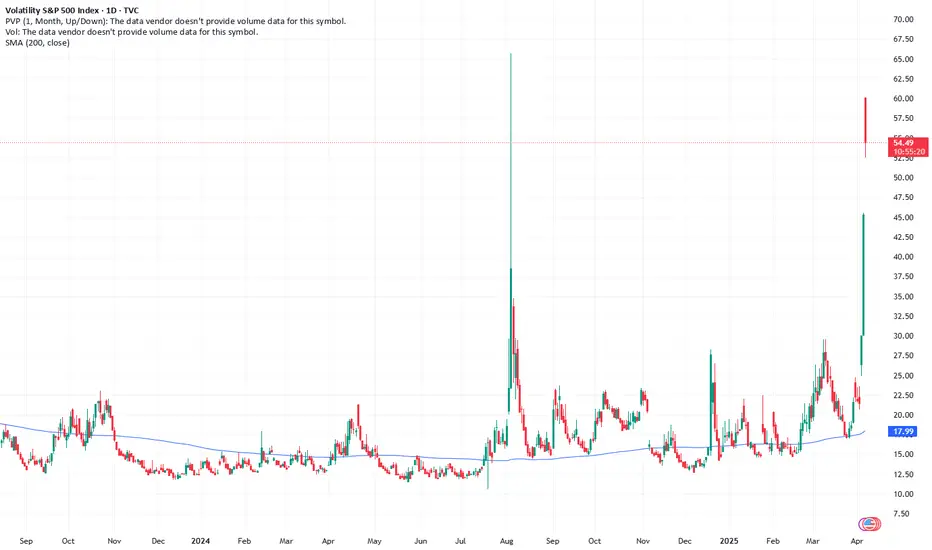
VIX + CandlechartVIX is also referred to as Fear index . VIX above 30 indicates higher volatility in markets . VIX is currently at 39.23. The current green candle body is full and is in progress . We need to wait till the month end to see if the body sustains or forms a shadow.

High volatility till the end of 2025The vix shows high volatility cycles of 46 weeks. Indexes have started a correction phase that will last till the end of 2025

Six conviction trades for 2025: seize the new market narrativeWhile developed economies have shifted to easing policies, opening the way for a broadening of the market away from technology mega stocks, the economic outlook remains uncertain. The violent reaction to DeepSeek’s launch early in the year clearly highlights the nervousness of markets and their ultra concentration. In the first few weeks of the year, the Trump administration has also been implementing its agenda at breakneck speed, leading to heightened uncertainties around trade frictions, inflation dynamics, and geopolitical upheaval. In that context, it is important to rethink investment positionings that may have worked in 2024, acknowledging the potential for volatility and numerous changes of directions.
In this uncertain environment, WisdomTree’s research team presents its six highest-conviction investment ideas for 2025.
1. Can the Magnificent Seven dominate for a third year in a row?
Few storylines have captured the investor imagination recently as much as the Magnificent Seven —a cohort of mega-cap technology stocks that propelled US equity benchmarks to remarkable gains. While these tech giants remain influential, we see scope for 2025 to become a year of ‘broadening out’.
Macro rationale
Resilience in corporate fundamentals and earnings growth: high quality growth stocks continue to be supported by strong fundamentals and growth could benefit from continued momentum after two years of domination.
Value resilience and broadening: with uncertainty increasing around the Federal Reserve’s (Fed) trajectory and inflationary pressures created by potential tariffs, value stocks may benefit and offer some diversification. Energy and Financials should also benefit from a wave of deregulation under the new Trump regime.
The case for a value/growth barbell strategy in US equities: a barbell strategy between US large cap quality Growth and US large cap Value equities leverages complementary strengths to navigate 2025. This approach allows investors to:
Capitalise on the Value factor’s extreme discount to Growth.
Enable investors to capture opportunities across market cycles.
Create a balance between growth potential and valuation-driven safety.
2. Unlocking value in Japan
Japan’s economic transformation story continues to gain traction as the country moves beyond four decades of stagnant nominal growth and sporadic deflationary episodes. While 2024 was the best year for Japanese equities since 1989, we believe that the Japanese renaissance still has further room to run.
Macro rationale
Resilience in corporate fundamentals and earnings growth: high quality growth stocks continue to be supported by strong fundamentals and growth could benefit from continued momentum after two years of domination.
Favourable currency tailwinds: the yen’s multi-year weakness augments the competitiveness of Japanese exporters, fuelling strong earnings from overseas revenue. Stable core inflation (outside of food) and talks about bond purchases by the Bank of Japan (BOJ) indicate that the BOJ will prevent the yen from appreciating too much.
Earnings and tariffs: Corporate earnings growth remains very strong after 2 years of improvement, and our analysis shows that the market is underreacting to those fundamentals. Furthermore, Japan may be able to secure a tariff carve-out from the US, leading to strengthening competitive positioning versus Europe and China.
3. A Trump card for emerging markets small caps
Emerging markets (EM) have struggled over the past decade, underweighted by many global investors and burned by repeated episodes of dollar strength, trade frictions, and slower growth in China. However, the narrative is a lot more positive going into 2025.
Macro rationale
An EM comeback: with the Federal Reserve maintaining an accommodative stance on monetary policy, China unleashing coordinated fiscal and monetary stimulus, and a wave of EM sovereign ratings upgrades, tailwinds have been picking up strongly for emerging markets.
But some clouds remain on the horizon: unfortunately, the Trump administration’s focus on a strong dollar and tariffs could slow down the recovery.
EM smalls caps as the solution: EM small caps typically derive a larger share of revenues from their home countries, insulating them somewhat from US tariffs or the dollar ‘s strength. In a scenario where the global trade outlook remains uncertain, these domestically oriented firms can thrive on internal consumer growth, as rising middle-class demographics in markets like India, Indonesia, and parts of Latin America continue to drive local consumer demand.
4. Cybersecurity at the crossroads of AI, geopolitical tensions, and quantum computing
The first few weeks of 2025 saw a resurgence of software stocks, with cybersecurity companies jumping in front of semiconductors or AI stocks. Continued corporate and government spending, as well as the imperative to protect the AI revolution, position cybersecurity for robust growth in 2025.
Macro rationale
AI’s security gap: rapid AI adoption brings higher data volumes and more software vulnerabilities, forcing enterprises to bolster their cyber defences. We expect a wave of spending on next-generation cloud solutions, zero-trust architecture, and quantum-proof encryption.
Elevated geopolitical risks: heightened tensions—from continuing conflicts and new trade disputes—translate into more frequent state-sponsored cyber-attacks. This, in turn, drives increased defence budgets and corporate vigilance.
US deregulation: since the US election, software companies have benefitted from deregulation expectations. Cybersecurity, cloud, and blockchain posted some of the strongest thematic gains in the first few weeks of the year.
5. Precious potential: silver’s breakout moment
While gold often steals the headlines, silver has quietly staged a meaningful rally, underpinned by both safe-haven demand and its essential role in green technologies, such as solar photovoltaics. 2025 could be silver’s ‘catch-up’ year.
Macro rationale
Haven meets industrial: silver exhibits a unique duality—part precious metal and part industrial commodity. If risk aversion flares, silver typically follows gold upward. If global growth holds steady, silver benefits from manufacturing demand. Countries worldwide, led by China and the US, are rapidly expanding solar capacity. Newer solar cell technology requires even higher silver content, providing a price tailwind.
Gold correlation: geopolitical tensions and looser monetary policy are offering gold new tailwinds, and silver will also benefit from the catch-up effect.
Limited supply growth: silver’s byproduct nature makes supply tight, as mining companies are not incentivised to expand production simply for silver alone. This supply-demand imbalance supports a more bullish price outlook.
6. Institutional adoption of digital assets is redefining multi-asset portfolios
After navigating a series of regulatory speed bumps, digital assets, led by bitcoin, have entered 2025 with growing mainstream acceptance. Key catalysts have included the expansion of physical bitcoin exchange-traded product (ETP) listings across major exchanges and the gradual emergence of regulatory frameworks that remove operational frictions. We believe most multi-asset portfolios remain structurally under-allocated to cryptocurrencies as a neutral position in digital assets (as illustrated by the market portfolio) should be around 1.5%.
Macro rationale
Portfolio diversification: bitcoin’s correlation to equities and bonds is low, providing a diversification benefit. Even small allocations have, historically, improved risk-adjusted returns.
Institutional inflows: pension funds, endowments, and sovereign wealth funds are steadily warming to digital assets, pointing to a rising tide of flows. As coverage by mainstream analysts grows, digital assets are increasingly viewed through the lens of asset class fundamentals rather than speculation alone.
Technological leaps: alongside bitcoin, developments in Ethereum scaling, stablecoins for global payments, and the tokenisation of real-world assets are reshaping how capital markets function. The resulting network effects may boost confidence in the broader crypto ecosystem.
Conclusion
In an environment that may reward conviction and flexibility, these six investment ideas offer distinct avenues to harness the opportunities emerging in 2025. Whether you seek cyclical upside, defensive yield, or secular growth themes, we believe these high-conviction calls exemplify WisdomTree’s mission: delivering innovative, research-driven solutions in a world of constant change.
This material is prepared by WisdomTree and its affiliates and is not intended to be relied upon as a forecast, research, or investment advice, and is not a recommendation, offer or solicitation to buy or sell any securities or to adopt any investment strategy. The opinions expressed are as of the date of production and may change as subsequent conditions vary. The information and opinions contained in this material are derived from proprietary and non-proprietary sources. As such, no warranty of accuracy or reliability is given and no responsibility arising in any other way for errors and omissions (including responsibility to any person by reason of negligence) is accepted by WisdomTree, nor any affiliate, nor any of their officers, employees, or agents. Reliance upon information in this material is at the sole discretion of the reader. Past performance is not a reliable indicator of future performance.

Consider Going Long on VIX Amidst Persistent Market Uncertainty
-Key Insights: The VIX, known as the "fear gauge," reflects market sentiment and
is currently indicating sustained volatility. As geopolitical and economic
uncertainties persist, a long position on the VIX could be advantageous. This
strategy may serve as a hedge against potential market downturns, as the VIX
tends to spike during periods of increased volatility and investor anxiety.
-Price Targets: For the upcoming week, consider these levels for a long position
on the VIX: Target 1 (T1) at 22, Target 2 (T2) at 25. Implement stop levels to
manage risk: Stop Level 1 (S1) at 18, Stop Level 2 (S2) at 16.
-Recent Performance: The VIX recently surged by over 15%, reflecting notable
market jitters. This increase aligns with heightened volatility observed across
major indices, underscoring the current market's nervousness. This upward
movement indicates a reaction to complex global factors, including economic
releases and geopolitical developments.
-Expert Analysis: Analysts emphasize the pivotal role of inflation concerns and
geopolitical tensions in driving market volatility. The consensus is that these
factors will continue to create uncertainty in the markets. Expected
fluctuations may present both opportunities and risks, highlighting the need for
strategic positioning in volatility indices like the VIX.
-News Impact: Recent geopolitical developments, particularly tariff
announcements, have exacerbated market anxiety, directly impacting volatility
metrics such as the VIX. As key economic data releases loom, including the non-
farm payroll report, market participants should anticipate potential spikes in
volatility. These events could lead to further upward movements in the VIX as
markets respond to emerging information.

VIX needs to go down for bullish on all coins and stocks% waves down, and a correction to the 382 fib. If we go down from here we should see some really nice waves on crypto and stocks.

Will the Fear Gauge Flash Red?The Cboe Volatility Index (VIX), Wall Street's closely watched "fear gauge," is poised for a potential surge due to US President Donald Trump's assertive policy agenda. This article examines the confluence of factors, primarily Trump's planned tariffs and escalating geopolitical tensions, that are likely to inject significant uncertainty into the financial markets. Historically, the VIX has proven to be a reliable indicator of investor anxiety, spiking during economic and political instability periods. The current climate, marked by a potential trade war and heightened international risks, suggests a strong likelihood of increased market volatility and a corresponding rise in the VIX.
President Trump's impending "Liberation Day" tariffs, set to target all countries with reciprocal duties, have already sparked considerable concern among economists and financial institutions. Experts at Goldman Sachs and J.P. Morgan predict that these tariffs will lead to higher inflation, slower economic growth, and an elevated risk of recession in the US. The sheer scale and breadth of these tariffs, affecting major trading partners and critical industries, create an environment of unpredictability that unsettles investors and compels them to seek protection against potential market downturns, a dynamic that typically drives the VIX upward.
Adding to the market's unease are the growing geopolitical fault lines involving the US and both China and Iran. Trade disputes and strategic rivalry with China, coupled with President Trump's confrontational stance and threats of military action against Iran over its nuclear program, contribute significantly to global instability. These high-stakes international situations, fraught with the potential for escalation, naturally trigger investor anxiety and a flight to safety, further fueling expectations of increased market volatility as measured by the VIX.
In conclusion, the combination of President Trump's aggressive trade policies and the mounting geopolitical risks presents a compelling case for a significant rise in the VIX. Market analysts have already observed this trend, and historical patterns during similar periods of uncertainty reinforce the expectation of heightened volatility. As investors grapple with the potential economic fallout from tariffs and the dangers of international conflicts, the VIX will likely serve as a crucial barometer, reflecting the increasing fear and uncertainty permeating the financial landscape.
