10 yr yield topped . btw The charts is telling me the market as to rates is topped . So I see the FED taking baby steps as the data will start to see Unemployment to be on the up swing and that supply chain to open up
TNX.P trade ideas

SOMETHING TO THINK ABOUT!Taking the long view of the last forty years of prosperity where BTFDs and HOLD THE COURSE were the prevailing mantra. But that is paradigm is now over and the new paradigm has yet to emerge. My GURUs are split between A STOCK PICKERS MARKET and THE FINANCIAL SYSTEM WILL CRASH, But Precious metals and other inflation hedges.
But what are you going to do? That is the real question!

make or break area🦉 TNX at this strong local resistance, if we break above we can target 2.559-3.036, if we reject look for a dip to trend support (1.45-1.50) like and follow for more! 💘

TNX - Daily / The Break of SymmetrySince July we began suggesting the ROC large break in early 2021 was a precursor to
a decades-long reversal in the Bond Market.
A Historic event seemingly lost on Convention.
The longer-term downtrend can easily be observed in both Weekly and Monthly
Charts - within those 2 TF's you will see the Long Term Channels UTL.
______________________________________________________________________
I pay a great deal of attention to Symmetry and Time, as it is as important as Price.
______________________________________________________________________
We can see in the chart above, 10 Year Yields decisively broke out as our pivot for
higher was 1.961.
Initially, it was front-run by 1 Pip during the Pre-Open - for bonds the action begins
at 8 AM EST.
The rest is history.
Extensions will trade into March IMHO.
Buyers since the FAKE 153 TOSS have been beaten down. Many are still insisting on
remaining in the Bid,
Buy the Dippers @ 153 / 151 / 149 / 147 / 143 / 142 / 139 / 136 continue to walk themselves
into continuing losses.
The Waffle House opened for Drive-Thru and the parking lot pileup ensued.
________________________________________________________________________
Forward CASH is not only being discounted for 007s, but for Corporate Jumbos aka
Mega Caps.
A clear sign of Depression 10X from August 2020 - a leading indicator by 18 months
historically.
Right on TIME - March 2022.
__________________________________________________________________________
You cannot fix stupid you can, however - you can take it's $.
Rates will continue to persist to the Larger time frames @ 3.5%.
This is the point of truncation late this year when 5/5 concludes for the Equity Complex
at New ATHs. Even the TLT baggies will gain small relief as all JUNK is hoisted higher in
one final Tulip Phase.
A multi-year Bear Market will ensue, collaterals will be "Reset" and Bonds, as we long warned
become perpetual.
Fluidity / Mobility matter most.
Unfortunately, the vast majority will remain snared.

SPY vrs 40 YEARS OF DECLINING INTEREST RATESIt just gets curiouser and curiouser.
Will Powell act? He is definitely no Volker! About 1982, under Volker, 30 year rates hit 18%. What next: a long period of low rates with catastrophic inflation or ...
door #2 - Higher rates and a stagnant or falling market.
I may be wrong, but I suspect the FED doesn't want to hurt THE MONEYED CLASS unless they have to.

10 Year Rate: Price keeps moving up!Quick Analysis on 10 Year Treasury Yield on a 1D Linear Chart.
1) The US 10 Year Treasury Yield has been respecting a falling channel for multiple decades going back to the 1980s.
2) It has broken out of the top trendline of the falling channel with a recent re-test of the S/R line.
3) The measured move of the falling channel would bring it back to Pre-2008 ranges (LONG-TERM). The measured move is noted.
4) There was a Bull Flag Pattern forming on the charts within the falling channel pattern, which helped the price move higher. The measured move for the SHORT-TERM is noted.
5) I discussed this breakout in the first week of December 2021 when the price was still at around 1.40ish. PAY ATTENTION!
What are your opinions on this?
If you enjoy my ideas, feel free to like it and drop in a comment. I love reading your comments below.
Disclosure: This is just my opinion and not any type of financial advice. I enjoy charting and discussing technical analysis. Don't trade based on my advice. Do your own research! #cryptopickk

US 10 Yr Treasury: Weekly Chart UpdateQuick Analysis on 10 Year Treasury Yield on a 1W Linear Chart.
1) The US 10 Year Treasury Yield has been respecting a falling channel for multiple decades going back to the 1980s.
2) It is currently headed to the top trendline of the channel with a possibility to break in the coming months.
3) The measured move of the falling channel would bring it back to Pre-2008 ranges.
4) This may fall in line with the US Dollar strengthening (in the idea section below).
5) If US 10 Year Treasury Yield goes lower, there is not much more room for it to get to 0.
What are your opinions on this?
If you enjoy my ideas, feel free to like it and drop in a comment. I love reading your comments below.
Disclosure: This is just my opinion and not any type of financial advice. I enjoy charting and discussing technical analysis . Don't trade based on my advice. Do your own research! #cryptopickk

Ten Year Treasure Yield Topped !TNX is topped. On major resistance area. Only possible way is going down.

$spy $tnx Target achieved. OUt of short bond and now longMy target for the ten year has been reached and my short on bonds is done. I've reversed and gone long now. Good luck!

40 Years of TNX and SPX and Their Inverse CorrelationFor the last 40 years, I (we) have invested in a never-ending Bull Market in stocks.
During this time:
Stay the Course and Buy the Dips worked.
But as Ray Dalio said recently: THE PERIOD OF EASY MONEY IS OVER!
The new paradigm will either be Zero or Rising Rates, neither of which will be kind to long term investors.
The BIG MONEY has already begun to or completed exiting stocks. That started around January 1st.
Be very careful what you do now!

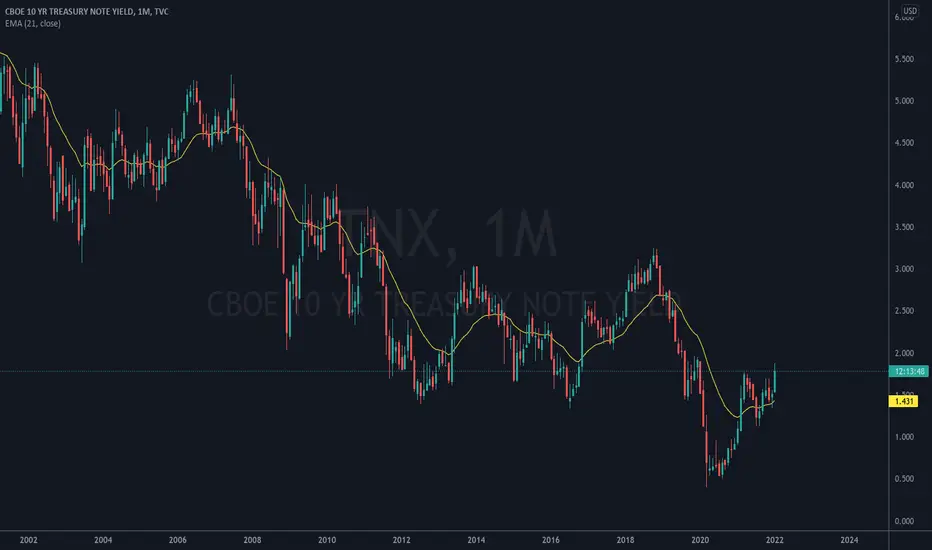
40 YEARS OF EASY MONEY HAS ENDEDThis chart of the TNX shows it all. Now zero interest for awhile or rebounding rates and their consequences.

Inversion of the yield curve 10 year minus 2 year yieldsThe yield curve between the 10 and 2 year has been collapsing since March 2021. It is erie to behold that the inversions of the yield curve were occurring 1-2 years before past recessions occurred in 2000 and 2008 and even before the recent pandemic. One can see when complete inversion occurs when the basis point difference goes BELOW ZERO. It would seem quite possible we are seeing the beginning of another recession as the yield curve flattens. One can also see periods of steepening and reflation when the opposite trend occurs. This is a useful tool for equity investors to see when the water is safe for investing. Right now, it appears caution is advised and a recession may be imminent.

$spy $tnx What's NextThings get very interesting from here. Stocks did not follow bond prices lower as bonds made new low. Which do you buy here? Stocks or bond? or.....Do you sell stocks and buy bonds? or just sell stocks? Wonder what @allstarcharts thinks?

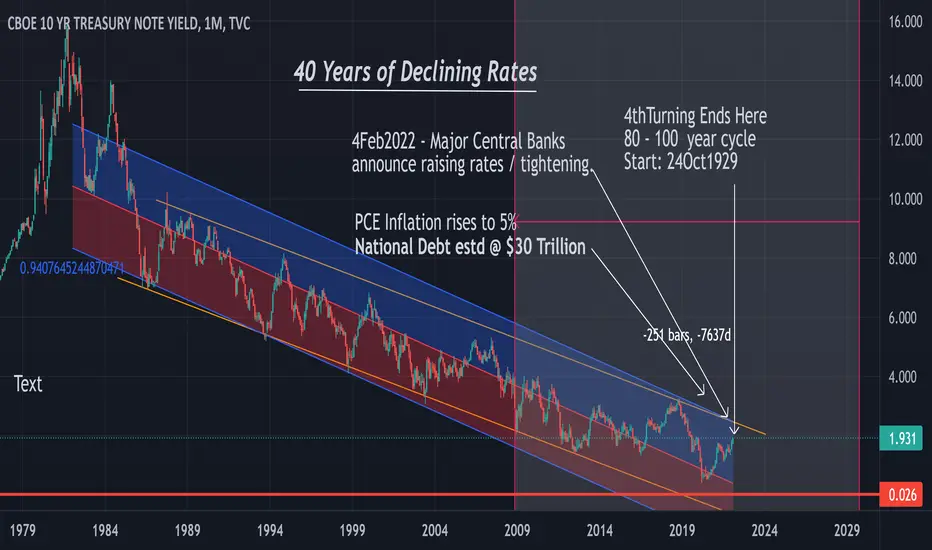
40 Years of Declining RatesMy complete chart as of this am when the major central banks announced tightening.

10Y Treasuries continue their way to 5%When ABCD-ab-12 are already competed, and wave 3 of c is already underway, the market is left with very little time to think what to do next.
As I said earlier - the move in treasuries is unstoppable and will cause a major market crash, bringing SPX to ~1500, EURUSD to below 0.87.

THE 40 YEAR BEAR MARKET IN 10 YEAR TREASURY NOTE INTEREST RATEThe attached chart shows 40 years of declining 10 year rates. As we all know, that rate is the basis for mortgage rates and just about everything else. During that half cycle the housing market boomed, the stock market boomed and generally speaking, corporations and individuals prospered.
But that trend has ended.
Thursday I would have said that rates would either remain low for an indefinite period while inflation soared or rates would be raised to quell inflation. But Friday Central Banks around the world announced tightening.
The party is over!
It is time to batten down the hatches, lock in long term profits on stocks, rentals and any other investments that correlate inversely with interest rates.
Obviously the major players saw this coming and started bailing at the first of2022.
Now us little fish must do what we can to avoid losing the wealth we have.
As an aside, it was announced last year that Bill Gates was diversifying into farm land. Obviously that anticipates food shortages and inflation.............
I will post more on this once the picture becomes clearer.
midnitepoet
Traders' guide: 10 yr Yield + markets positively linkedFirst - if you think markets always move opposite to yields, please be open to learning something new. Covariance, in statistics, is the relationship between two random variables. This chart indicates periods of negative (blue) and positive (yellow) covariance between the 10 year yield and SPY. If you think about it, this makes sense because there are times when rising rates give investors more confidence in the economy. Traders can benefit from knowing the general relationship.
> Yields change in response to central bank activity - I cannot explain why the covariance flips
> Other factors influence markets but yield is reliable for intraday moves
> 1.77 has been key support for the yield recently, and hence for markets
> Above 1.83, markets get spooked and covariance becomes negative (you can see this in yellow boxes also)
> Below 1.74,1.73 should increase selling momentum
How am I using this information to plan trades?
> I believe yields will drop further and take markets lower, so I am looking for swing put trades
> This strong upward rally has brought indices and stocks to moving average and price resistance areas, which technically also indicate swing puts
> I have successfully day traded DIA and QQQ calls and puts using yield changes a guide
> I was too early in buying swing puts on 31 Jan, but since they expire 18Feb I can hold the loss for now
> As I finish writing this, yield moved up from 1.748 to 1.771 and markets have also been moving up - I see this as a good time to buy swing puts

TNX - Back to the Box10 Yr Yields are catching the FED YCC shove at present, it's feeble but there.
Powell's Backtrack yesterday was frankly pathetic.
"Rates will remain near Zero for the near term"
blah blah blah... idiocy.
___________________________________________________________________
The Stock Market is the Economy is what this fraud meant to say, but could not.
One day, he will.
Until then, the DX and TNX are going to continue to Range and Consolidate.
There's another accident ahead, regardless of the protestations of the Bond Gurus,
007s and Bandits.
They never seem to catch the Drift, always buying and claiming the New Bond Bull
is beginning.
After 4.5 decades it's over fanbois.
If you can't sort it out... it's your Capital being eaten alive by Inflation.

Bond market leading fed once again as predictor of stock market?If any of the key treasury/bond yields reach the downtrend resistance trendline, we should see the start of bear makret/crash in stock market within months but this cycle seems very close to the top already.

The TNX is breaching major resistanceThe next target technical levels are between 2.5 and 3 % on the 10 year. If this plays out its lights out for the speculative parts of the markets.
TNX - 10Yr Yields Sell Offers and Bond VX / Trouble
Bond Bagholders just never learn - this Secular Cult is doomed to extinction.
The two-year Treasury yield posted its biggest single-day jump since the
market volatility of March 2020.
Of course, this was after Federal Reserve Chair Jerome Powell promoted
the Policy Flip Flop that the Fed will raise rates in March, and left the screen
porch door open for a quicker than-anticipated pace of rate increases.
The Dot Plot is wiggling in excitement.
IN reality, the FED will begin to Temper expectations.
It is what they do - Lie Cheat Steal / Delay.
10 Yr Yields have seen another fantastic ROC-driven Spike which advanced
well ahead of the Pre-Spring Meltup in 2021.
__________________________________________________________________
TNX will provide a very large indication as to how the preset Wedge on the ES/NQ
resolve, likely this week...
Keep it in purview at all times, sudden violent reactions are to be expected.

U.S. 10yr Yield driving marketsStochastic %D is headed lower on all three charts. I will probably remain bearish until SKEW and fear/greed indicators signal "time to buy"
Left chart:
> daily 10yr yield may be a double top and it comes down from here
> markets are positively correlated with yield movements for now
> yield is at 200ma resistance on weekly chart
> yield will respond - how? - to Fed balance reduction and no more asset purchases
Top right chart:
> 30min chart of 10yr yield shows 1.71 is critical level
> there is a lag between yield and market movement, so swing trades will work well
> lower yields may initially cause markets to rise, so be ready for market turns and take profits
Bottom right chart
> 30m chart of Dow Jones is an example of markets heading lower to retest lows
> when you look at daily/weekly charts, it is likely that markets move even lower
> stocks that look "sold off" on 30m/daily still have room down on weekly
> at the same time, markets may bounce first on lower yields, as there is room on daily to move up to 20sma

TNX - 10 YR T-Note Yield - Overblown?This thing is way ahead of where quarterly money flows suggest it should be - I think it will pull back and consolidate 1.10 - 1.150 range. Also looks to be exhibiting the same post-crisis recovery that it followed after the GFC. I'm pretty sure all of these anti-fed pumpers were out there barking about it back then as well.
Also, Bitcoin (all cryptos) still look like crud, barely hanging on minus over 30% and still tired.
Stocks looking real good in terms of quarterly money flows. This recent pull back looks like profit taking to me (maybe another 5% down and reverse but I think we are near the end of the correction. Oil also holding up and actually creeping higher, suggesting demand remains (for now); again, we know that the American consumer IN 2007 - FIFTEEN YEARS AGO - was able to support $100+ / barrel oil. Today we are tickling $86 / barrel.
Fear sells. Listen to the data.
God Bless.
#GoChiefs!
