TNX.P trade ideas


Key to S&P bottom formation is 10 YR Treasury Note Yield (TNX)Until we see Monthly ROC of Treasuries >0 followed by <0 the S & P (SPX) cannot form a bottom. Caveat small sample size. NOT ADVICE. DYOR.
Construction details on chart.


For those calling for the end of the bond bull market...... especially now that it has been nationalized, negative rates for 10 year are around the corner.

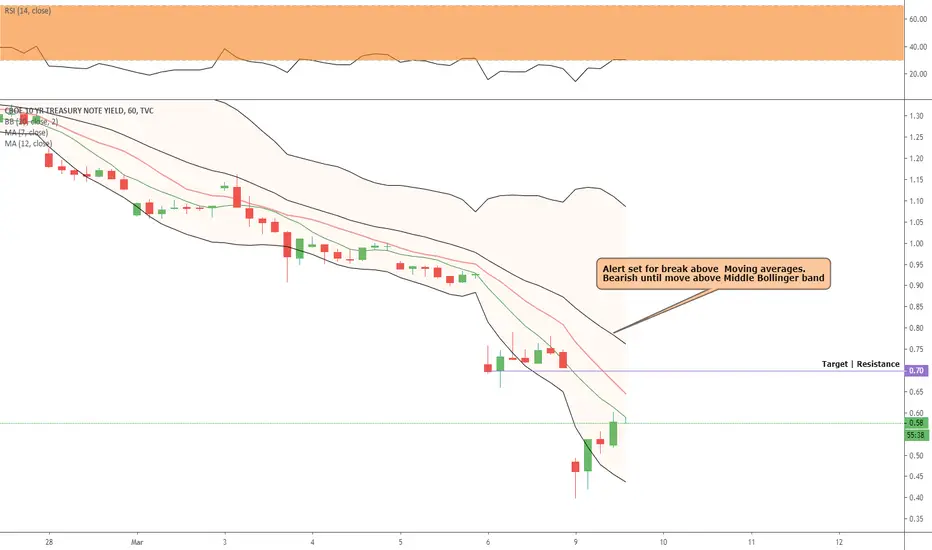
Watch the 10 yr as it gives market advice Under .7 the tnx is pointing to
More volatility and more losses in the markets.

Macro its the skewing of the forwards probability space, it matters, its a better take on the Phenomena.
I know the the real world interpretations f the symbols charted are extremely relevant , now .
I want a budget and a team to take "parabolic approach to deeper completion.

10-yr yield head and shoulder top projects to 0%I posted about this weeks (months?) ago. The 10 year came back to the neckline and looks like it's failing. We will challenge 0%. Treasury bills may go negative for a while.


10 Year Treasury Note drop haltedTime will tell if its a dead cat bounce or the beginning of a much welcomed reversal.
This week will certainly test its stability as the perfect storm is in full force today.

Booming economy he says..debt based economy looks as if the debt load is too much. people are fleeing to safety. people are selling stocks. people are panicking because of covid 19. rates cuts cant help. QE cant help either. tighten your chin straps its getting real. bond market is falling like a rock. do your DD but I believe metals is the only way to go in this environment.

10 year T-Note yield weekly bullish divergence. Daily RSI LOW.This looks like a bottom for the time being.
The divergence on the RSI is not to be ignored.

TNX 10 treasury WeaknessTNX the index related to interest rate in the usa has showed a weakness recently. Will the usa lower rates? will the usa maintain its current rate? We dont know but we follow the trend and by now it shows weakness so sell it.

TNX to 0% per HS top As predicted last week. Going to zero. Euro will fly. Gold, who the hell knows?

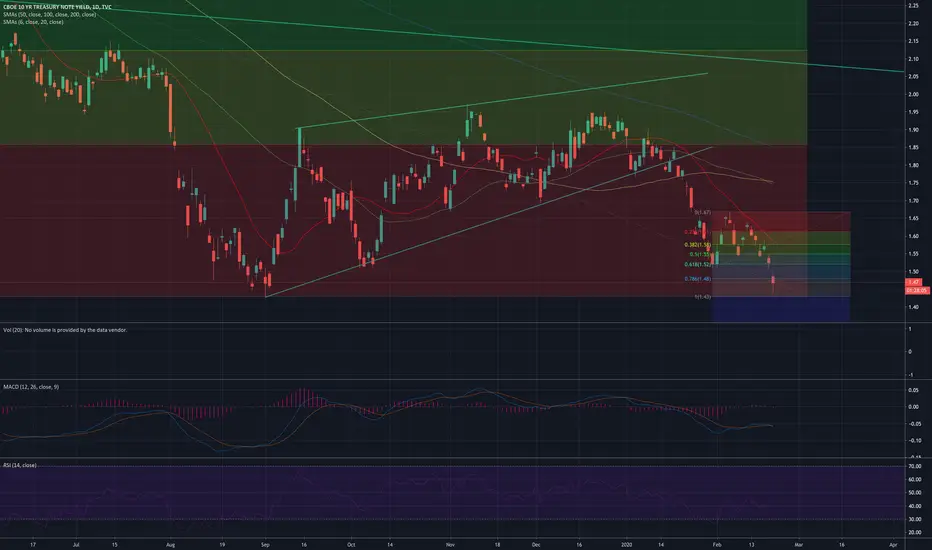
US 10-year yield could retest former low of 1.34 pctThere is a map of a consolidation for US 10-year yield.
The range is quite volatile between 1.50 and 2.00.
The wave B should complete with a drop to the 1.50 and then wave C could unfold up to 2.00.
After that the drop should resume to retest 1.34.


Ten Year Interest Rates Bottom at Major SupportToday 2/24/20 TYX - 30 year US Interest rates made a new low for the secular bear market that began in 1981.
This low was unconfirmed by 10, and 5 year rates.
TNX - 10 year interest rates bottomed 1 tick above the major bottom made in July 2016, also close to a new moon.
Daily RSI has a significant bullish divergence.
The daily TNX bar was completely outside the lower Bollinger Band. Please see my 2/24/20 GLD post.
Just like the Gold market, tremendous evidence of a possible major turn taking place.
Mark

TNX - 10 year yields short term bottom?Maybe. Impulse leg seems to suggest a potential turn right around here. I've got 1.43. Stocks taking it on the chin again today but selling for now is somewhat orderly and subdued. Watching closely for a break of the 1.43 range. If so we will need to visit the mid-2016 1.34 range and test for support there. Time will tell. Be safe my friends.
TNX - Ten Year Yields SinkingAs mentioned here two months ago, ten year yields continue to fall and it looks like we are going to test support in the 1.4 area. Markets appear to be tinkering on the precipice of frivolity and exercising caution here would be prudent. Market was down over 300 in a blink of an eye today with seemingly little or no support. Stay safe my friends.

S&P 500 PE and US 10 Year note PE for comparison... 1.2S&P 500 PE and US 10 Year note PE for comparison... 1.2 updated version minor improvements
The last two cycles, bonds were most of the time more expensive than stocks... the same thing happened in the 1940s in the US interested rate history, unfortunately, there is not historical data to be showed here about that particular time....

