We've seen this Soybean pattern beforeThis bottoming pattern has shown up in each of the past 6 moths
QS21! trade ideas

Soybean Futures ( ZS1! ), H4 Potential for Bearish MomentumTitle: Soybean Futures ( ZS1! ), H4 Potential for Bearish Momentum
Type: Bearish Momentum
Resistance: 1433.75
Pivot: 1409.75
Support: 1391.75
Preferred case: On the H4 chart, we have a bearish bias. To add confluence to this, price is under the Ichimoku cloud which indicates a bearish market. If this bearish momentum continues, expect price to possibly continue heading towards the Pivot at 1409.75, where the 38.2% Fibonacci line is.
Alternative scenario: Price may go back up to retest the resistance at 1433.75, where the 50% Fibonacci line is.
Fundamentals: There are no major news.

Soybean Futures ( ZS1! ), H4 Potential for Bearish MomentumTitle: Soybean Futures ( ZS1! ), H4 Potential for Bearish Momentum
Type: Bearish Momentum
Resistance: 1484.50
Pivot: 1409.75
Support: 1431.50
Preferred case: On the H4 chart, we have a bearish bias. To add confluence to this, price is crossing under the Ichimoku cloud which indicates a bearish market. If this bearish momentum continues, expect price to possibly continue heading towards the Pivot at 1409.75, where the 38.2% Fibonacci line is.
Alternative scenario: Price may go back up to retest the support at 1431.50, where the 50% Fibonacci line is.
Fundamentals: There are no major news.

Soybean Futures ( ZS1! ), H4 Potential for Bearish MomentumTitle: Soybean Futures ( ZS1! ), H4 Potential for Bearish Momentum
Type: Bearish Momentum
Resistance: 1484.50
Pivot: 1409.75
Support: 1431.50
Preferred case: On the H4 chart, we have a bearish bias. To add confluence to this, price is crossing under the Ichimoku cloud which indicates a bearish market. If this bearish momentum continues, expect price to possibly break the support line at 1431.50 where the 50% Fibonacci line is located before heading towards the Pivot at 1409.75, where the 38.2% Fibonacci line is.
Alternative scenario: Price may go back up to retest the resistance at 1484.50, where the previous swing high and 78.6% Fibonacci line is.
Fundamentals: There are no major news.

Soybean Futures ( ZS1! ), H4 Potential for Bullish MomentumTitle: Soybean Futures ( ZS1! ), H4 Potential for Bullish Momentum
Type: Bullish Momentum
Resistance: 1484.50
Pivot: 1409.75
Support: 1431.50
Preferred case: The current bias for ZM1! on the H4 chart is bullish . To add to this bias, the price is currently trading above the Ichimoku cloud , indicating a bullish market. Overnight price had some bearish momentum, with the price currently trading at 1447.25. If the bullish momentum continues, expect price to possibly head towards the resistance at 441.4, where the previous high and 100% Fibonacci line are located.
Alternative scenario: Price may head back downwards breaking the 418.8 support level , where the 50% and 23.6% Fibonacci lines are located, before heading towards the pivot line at 1409.75 where the 38.2% Fibonacci line is located.
Fundamentals: There are no major news.

Soybean Futures ( ZS1! ), H4 Potential for Bullish Momentum Title: Soybean Futures ( ZS1! ), H4 Potential for Bullish Momentum
Type: Bullish Momentum
Resistance: 1484.50
Pivot: 1409.75
Support: 1431.50
Preferred case: The current bias for ZM1! on the H4 chart is bullish. To add to this bias, the price is currently trading above the Ichimoku cloud, indicating a bullish market. Overnight price had some bearish momentum, with the price currently trading at 1455.00. If the bullish momentum continues, expect price to possibly head towards the resistance at 441.4, where the previous high and 100% Fibonacci line are located.
Alternative scenario: Price may retrace downwards and head towards the 418.8 support level, where the 50% and 23.6% Fibonacci lines are located.
Fundamentals: There are no major news.

Soybean Futures ( ZS1! ), H4 Potential for Bullish MomentumTitle: Soybean Futures ( ZS1! ), H4 Potential for Bullish Momentum
Type: Bullish Momentum
Resistance: 1484.50
Pivot: 1409.75
Support: 1431.50
Preferred case: The current bias for ZS1! on the H4 chart is bullish . To add to this bias, the price is currently trading above the Ichimoku cloud , indicating a bullish market. If the bullish momentum continues, price may head towards the resistance at 1484.50, where the previous high and 78.6% Fibonacci line is located.
Alternative scenario: Price may retrace downwards and head towards the 1431.50 support level , where the 50% Fibonacci line is located.
Fundamentals: There are no major news.

Soybean Futures ( ZS1! ), H4 Potential for Bullish Momentum Title: Soybean Futures ( ZS1! ), H4 Potential for Bullish Momentum
Type: Bullish Momentum
Resistance: 1484.50
Pivot: 1409.75
Support: 1431.50
Preferred case: The current bias for ZS1! on the H4 chart is bullish. To add to this bias, the price is currently trading above the Ichimoku cloud, indicating a bullish market. If the bullish momentum continues, price may head towards the resistance at 1484.50, where the previous high and 78.6% Fibonacci line is located.
Alternative scenario: Price may retrace downwards and head towards the 1431.50 support level, where the 50% Fibonacci line is located.
Fundamentals: There are no major news.

Soybean Futures ( ZS1! ), H4 Potential for Bullish MomentumTitle: Soybean Futures ( ZS1! ), H4 Potential for Bullish Momentum
Type: Bullish Momentum
Resistance: 1484.50
Pivot: 1350.00
Support: 1407.75
Preferred case: On the H4 chart, the overall bias for ZS1! is bullish . To add confluence to this, price is above the Ichimoku cloud which indicates a bullish market. Overnight price had bullish momentum upwards with price currently trading at 1449.75 at time of writing. If this bullish momentum continues, expect price to head towards the resistance line at 1484.50, where the 23.6%, 78.6% Fibonacci lines and 61.8% Fibonacci projection line are located.
Alternative scenario: Price may retrace downwards towards the the support line at 1407.75, where 2 of the 38.2% Fibonacci lines are located.
Fundamentals: There are no major news.

Bottoms converge and reach a retracement area, so it is expectedBottoms converge and reach a retracement area, so it is expected that the price will drop as shown

SOYBEAN // a zone to break before shortThe market made a sharp impulse wave down in June, then it built up a countertrend. A break of this countertrend is valid already, it just thought it would go for another corrective round before... we'll see :)
All-in-all, important levels are marked on the chart, the short trigger zone is to be watched closely, and to be modified in case the countertrend remained valid, as it is now, and built another waves up.
Trade safe! ⚪️⚫️
--------------------------------------------------------------------------------
ANYWAY, a lot of Qs about the direction of the price. But it doesn't matter.
WE JUST REACT!
Remember that trading is a business.
SIZE your TRADES according to your risk aversion!
----------------------------------------------------------

Soybean Futures ( ZS1! ), H4 Potential for Bullish MomentumTitle: Soybean Futures ( ZS1! ), H4 Potential for Bullish Momentum
Type: Bullish Momentum
Resistance: 1484.50
Pivot: 1350.00
Support: 1375.75
Preferred case: The current bias for ZS1! on the H4 chart is bullish . To add to this bias, the price is currently trading above the Ichimoku cloud , indicating a bullish market. Price had some bullish momentum upwards toward the end of last week, and it is currently trading at 1409.50. If the bullish momentum continues, price may move towards the resistance at 1484.50, which contains the 23.6% and 78.6% Fibonacci lines. There is also a 61.8% Fibonacci projection line there too.
Alternative scenario: Price may retrace downwards and head towards the 1375.75 support level , which is just below the 50% and 23.6% Fibonacci lines.
Fundamentals: There are no major news.

Soybean Futures ( ZS1! ), H4 Potential for Bullish Momentum Title: Soybean Futures ( ZS1! ), H4 Potential for Bullish Momentum
Type: Bullish Momentum
Resistance: 1484.50
Pivot: 1350.00
Support: 1375.75
Preferred case: The current bias for ZS1! on the H4 chart is bullish. To add to this bias, the price is currently trading above the Ichimoku cloud, indicating a bullish market. Price had some bullish momentum upwards toward the end of last week, and it is currently trading at 1409.50. If the bullish momentum continues, price may move towards the resistance at 1484.50, which contains the 23.6% and 78.6% Fibonacci lines. There is also a 61.8% Fibonacci projection line there too.
Alternative scenario: Price may retrace downwards and head towards the 1375.75 support level, which is just below the 50% and 23.6% Fibonacci lines.
Fundamentals: There are no major news.

Daily ZS analysisDaily ZS analysis
A long position with the target and stop loss as shown in the chart
The trend is up, we may see more upside
All the best, I hope for your participation in the analysis, and for any inquiries, please send in the comments.
He gave a signal from the strongest areas of entry, special recommendations, with a success rate of 95%, for any inquiry or request for analysis, contact me

SOYBEANS // nice RR aheadHi✋🏽
Within the short trend, we have seen a nice countertrend built by the buyers and the sellers. It seems that this countertrend is turning in the direction of the main short trend.
What do you think???
Trade safe! ⚪️⚫️
--------------------------------------------------------------------------------
ANYWAY, a lot of Qs about the direction of the price. But it doesn't matter.
I JUST REACT!
Thanks for reading my analysis!🤘🏽
Remember that trading is a business.
SIZE your TRADES according to your risk aversion!
----------------------------------------------------------

SOYBEANS // short trend may continue after retestHi Everyone!✋🏽
As you probably know, I analyze price action and price went into countertrend on H4, testing the previous D/H4 south breakout with a nice wick. From here after 1-2-3 and through the short trigger zone, chances are high that targets on the chart will be met.
If countertrend never brakes all the way through the long trigger zone, I switch to the long side.
What do you think???
Trade safe! ⚪️⚫️
-----------------------------------------------------------------------------------------------------------
If you liked my analysis, please remember to support the idea with a BOOST , or COMMENT!
ANYWAY, a lot of Qs about the direction of the price. But it doesn't matter.
WE JUST REACT!
Thanks for reading my analysis!🤘🏽
Remember that trading is a risky business.
SIZE your TRADES according to your risk aversion!
----------------------------------------------------------

Daily ZS analysisDaily ZS analysis
Sell trade with target and stop loss as shown in the chart
The trend is down and we may see more drop in the coming period in the medium term
All the best, I hope for your participation in the analysis, and for any inquiries, please send in the comments.
He gave a signal from the strongest areas of entry, special recommendations, with a success rate of 95%, for any inquiry or request for analysis, contact me

SOYBEAN short scenarioHi Everyone!✋🏽
Soybean is technically in a downtrend. The first target that is the last daily low, where the correction of the short impulse wave has started. Can be reached until the validity zone stands the pressure from the buyers.
ANYWAY, a lot of Qs about the direction of the price. But it doesn't matter. WE JUST REACT!
Trade safe! ⚪️⚫️
----------------------------------------------------------------------------
Thanks for reading my analysis!🤘🏽
Remember that trading is a risky business.
SIZE your TRADES according to your risk aversion!
Please remember to support the idea with a BOOST or COMMENT
with your highly appreciated opinion!
----------------------------------------------------------------------------

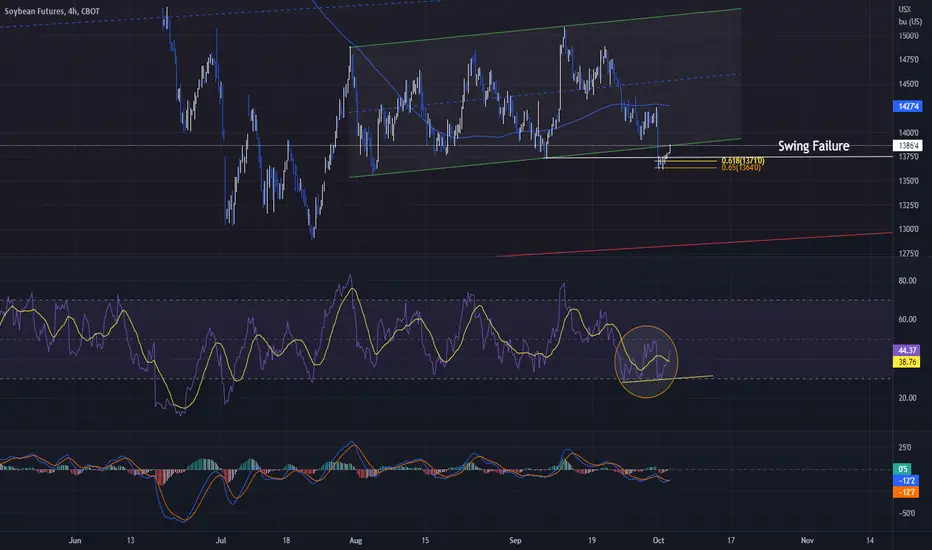
Took a long at the GP on soybeansSoybeans is looking decent with a nice bounce off of the GP and a technical swing failure of the local lows. The price must close above the parallel channel for me to hold this long.