CELO could manage a (+220%) rise.CELO is on the verge of breaking an important level of $1,045 and is showing momentum shifting to bullish with moneyflow increasing in the higher timeframes that could result in a possible (+220%) move. The target is siting between value are low/point of control of last bull run with fibonacci levels and anchored vwap in the same region of $2,22 to $3,36.
A weekly candle close above $1,045 will be significant to reach these levels from 2022.
CELOUSD trade ideas

Alt coin that would blast - Inverted H&SAlt coin that would blast - Inverted H&S
Buy This alt coin, it if forming bullish pattern
Enjoy and Keep learning and earning
GK Trademanthan

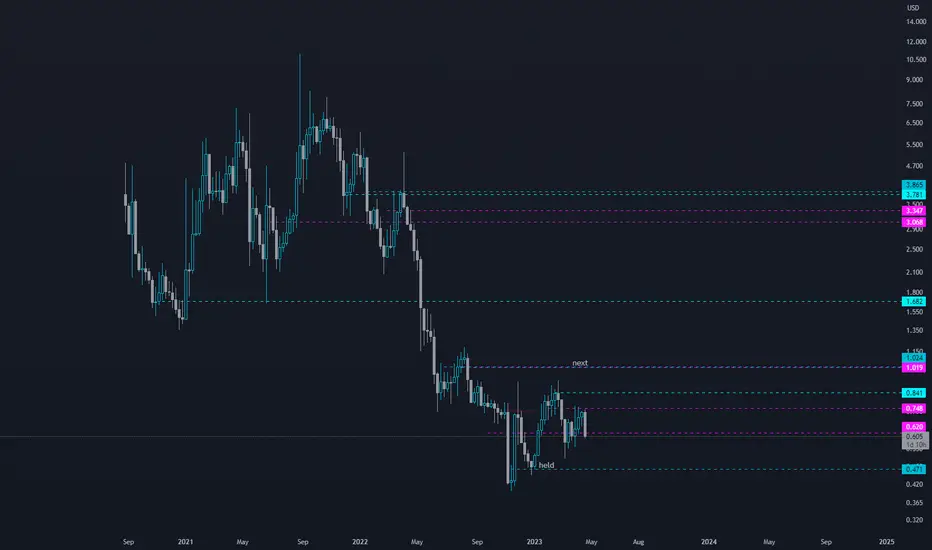
Celo (cgldusd) Weekly chart indicates the double bottom breakout. . .has been validated. Now jsut waiting for price action to head to the full double bottom breakout target. In the current price zone, a mild correction before reaching the full target wouldn’t surprise me. In doing so it would help it create an inverse head and shoulders for its follow up bull pattern. Also a chance it just skips the correction and heads straight to the full target first. Either way I expect the target to be hit. *not financial advice*

CELO WedgeCELO is in a wedge after the bear market selloff. 0.40 cents has been huge support. They have some agreement with chainlink which maybe a catalyse for higher price action in the next cycle. I am buying around these prices for the next cycle. It could go lower, so not FA.

✴️ Celo | Bottom Catch, Potential 2,300% To All-Time HighHere we potentially have a long-term bottom as Celo hits a new All-Time Low in June 2023.
After the ATL there is no follow through, bears are weak and all the indicators are starting to turn green.
Short-term we have months of higher lows and currently developing, a break of EMA10 as resistance; this is the weekly timeframe.
Any type of bullish action can lead to the break of the descending triangle marked on the chart and thus a bottom low confirmed.
A confirmed bottom can be significant as it implies that a new trend can develop.
👉 The next Cryptocurrency bull-market is expected to last around 1.5 to 2 years.
From a traders perspective, this is an amazing chart setup.
The risk is small, quite limited and can be easily defined... The growth potential is unlimited.
👉 Just to previous All-Time High we get a massive 2,300% potential or 24X. If we consider a new All-Time High, we don't know what to think or expect other than something great.
Patience is key... 2024 is just around the corner... Those staying around will be rewarded bigly.
Thanks a lot for your continued support.
Namaste.

CELO IS BEARISH (1D TF)For CELO, by examining the waves on the chart, a large diamond pattern can be identified. It seems that it has now entered the descending G wave of this diametric.
The red zone is a strong supply that can push the price down towards the TPs. In this red area, we are in the middle of sell/short trades.
I also specified the invalidation level, closing a daily candle above this level will invalidate the analysis.
For risk management, please don't forget stop loss and capital management
When we reach the first target, save some profit and then change the stop to entry
Comment if you have any questions
Thank You

$CGLD short term move to $.73-.79?Kind of a risky trade, but I'm of the belief that we'll see one more BTC bounce before the move down.
If it does happen, then I think OTC:CGLD has the chance at 20-30% upside here.
I think it's likely to hit the top resistance at $.79.
Let's see what happens over the coming days.

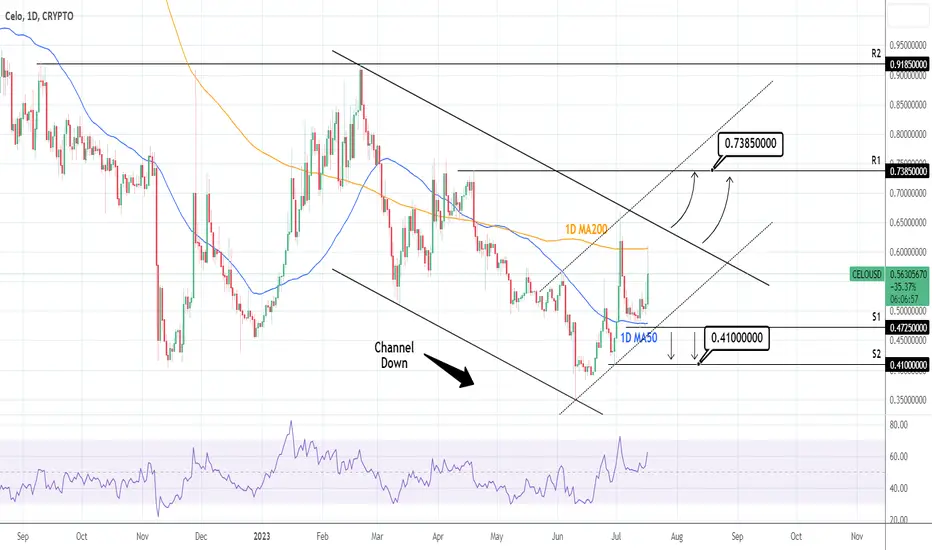
CELOUSD: Neutral right now. Trade the breakouts.CELOUSD hit today the 1D MA200 after rebounding on the 1D MA50, forming the S1 (0.47250), being stranded essentially between the two. The 1D timeframe remains on bullish technical indicators though (RSI = 61. 619, MACD = 0.011, ADX = 41.243), making a bullish breakout above February's Channel Down quite likely. We will wait for that top to break and buy aiming at the R1 (TP = 0.73850).
Conversely, if the S1 breaks, we will sell aiming at the S2 (TP = 0.41000).
## If you like our free content follow our profile to get more daily ideas. ##
## Comments and likes are greatly appreciated. ##
✴️ Celo Recovers Above Support & Goes Bullish (450% Potential) Celo pierced through its November 2022 low/support and quickly moved back above it. Notice that this happened 10-June, the same date that Compound and the rest of the Altcoins hit bottom.
The fact that CELOUSD is now back above this level, marked here with a blue dashed line, tells us that the bearish wave is over and the bullish potential is on.
The current candle trades above EMA50 and EMA100.
EMA100 being a medium to long-term gauge indicator. Closing daily above it and the long-term bullish potential is confirmed.
The current chart setup and signals are pointing to a massive bullish wave that can range between 400 and 450%.
Namaste.

CELO $1 possible by end of February CELO $1 possible by end of February
10x leverage would be safe from 0.71 entry
Would start to TP at 0.82 if you are short term trading, if not set orders at .65 and let her ride.
I dont see this coin going below $.60 again.
RSI looks bullish, longer time frame accumulation / distrubution is at all time lows on the accumulation side, volume is picking up on multiple exchanges.
Good luck all.
I will be entering this trade at 0.71 with 25% of my On-risk-trading capital and using another 15% at 0.65 limit buys.

CELOUSD on a strong bullish fractal of the past.Celo (CELOUSD) is above its 1D MA200 (orange trend-line), supported by the 1D MA50 (blue trend-line) since January 12. With the 1W RSI on Higher Lows, the Bear Cycle seems over and will officially get confirmed after it breaks above the November 28 High (0.9225).
We have already spotted two previous fractals that so far are very similar to the price action since the November 14 Low. Both of those sequences reached at least the 2.0 Fibonacci extension before retracing. The current 2.0 Fib is a little under 1.9000, which is our medium-term target on CELO from now on.
-------------------------------------------------------------------------------
** Please LIKE 👍, FOLLOW ✅, SHARE 🙌 and COMMENT ✍ if you enjoy this idea! Also share your ideas and charts in the comments section below! **
-------------------------------------------------------------------------------
💸💸💸💸💸💸
👇 👇 👇 👇 👇 👇

Celo forming a beautiful inv h&s patternCurrently wicking below the neckline on the right shoulder…I’m not 100% confident it will trigger a breakout on the first candle of the right shoulder to reach the neckline, so I arbitrarily moved the measured move line a few daily candles forward to give it some time to fight the neckline resistance…whenever we see that it has clearly triggered the breakout above the neckline then I will readjust the dotted green measured move line accordingly to the point of the break out. For now it’s just been placed there arbitrarily. Will update when and if we have a valid breakout….there’s no guarantee we will even validated a breakout just yet. The way the market is going recently probability currently favors a breakout slightly, but my guess is it will take a few candles testing the neckline first as we can see that the current daily candle is wicking down exactly after testing the neckline. *not financial advice*

CELOthis coin is wild because its sold nowhere besides coinbase and im not sure why. either way apparently the feds love it and here it seems like it regained support so hopefully it bounces here and my theory plays out.

Bullish divergence in CELO (CELOUSD)Celo is showing a rise on the DMI (histogram), while the price has been slowly falling, setting up a divergence.
Long targets:
0.91
1.02
Short targets:
0.69
0.50

Cello/USDT AnalysisHello traders.
1. Weekly chart
Stochastic RSI pointing up.
The price has reached the 1.68 target of the projection and also the diagonal Fibo channel, a well-known target.
2. Daily chart
I plotted two possible scenarios, an optimist with a green arrow and a pessimist with a red arrow.
The price apparently corrected on the 50% retracement:
The correction also respected the Arnaud Legoux moving average of 89:
And it stayed above the exponential moving averages of 8 and 21:
Analyzing 21-period Bollinger Bands, with regularized exponential mean and Extreme Stochastic DMI:
The price tried to stay above the average for 3 times as per the red circles.
It's testing again, to see if it goes back down to the green circle.
The Extreme Stochastic DMI indicates bullish continuation pointing up.
3. 4-hour chart
Price appears to be undefined in the range between the 200 exponential and simple moving averages
The price needs to stay above 1,272 Fibo channel, otherwise it will test the next level at 1,382.

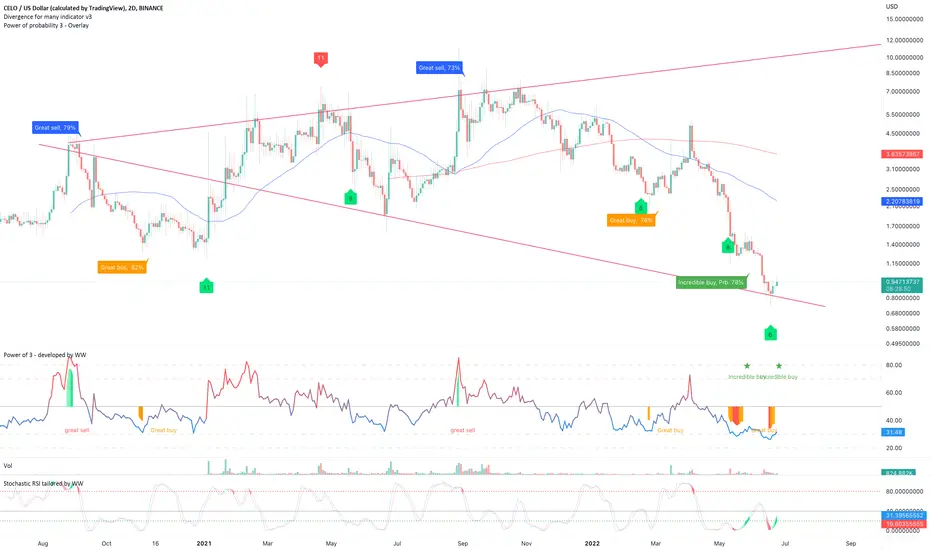
CELO - Bullish divergenceOn the above 2-day chart price action has corrected 90% since the sell signal last August. A number of reasons now exist to be bullish, including:
1) The ‘incredible buy’ signal.
2) Regular bullish divergence. Multiple oscillators are printing positive divergence with price action. A very similar picture on the 2-day BTC pair (below).
3) RSI resistance breakout.
4) Price action is now testing a trend line of significant historical support and resistance.
Is it possible for price action to fall further? For sure.
Is it probable? Very unlikely.
Ww
Type: trade
Risk: <=6% of portfolio
Timeframe: 3 - 8 month
Return: Somewhere between $10-15
BTC pair
CELOUSD - Recovery PotentialOn left the Weekly chart is displayed showing a recovery on the bottom band of the Gaussian Channel
This adds support to the theory on the right, which observes price in both cases retesting a trend line and being rejected
Recovery hodls potential

CELO holding my consolidation box perfectly; relative strengthCELO is doing better than most cryptos. Watch for the breakout from this consolidation box to determine
direction of trade. (See chart)

CELO BO of 2 H&S; following my fractal n a smaller degreeUpdate from a previous post.
So far CELO is still following my 2020 fractal but in a smaller scale. Notice there are 2 H&S formations; big & small. However it came back down to the neck of the bigger H&S & broke below the neckline. If this is a Beartrap, CELO will breakout of the consolidation zone soon & proceed to the breakout zone above all anchored VWAPS.
Worst case scenario is that CELO will remain in the consolidation zone for a while pending BO.
Not trading advice

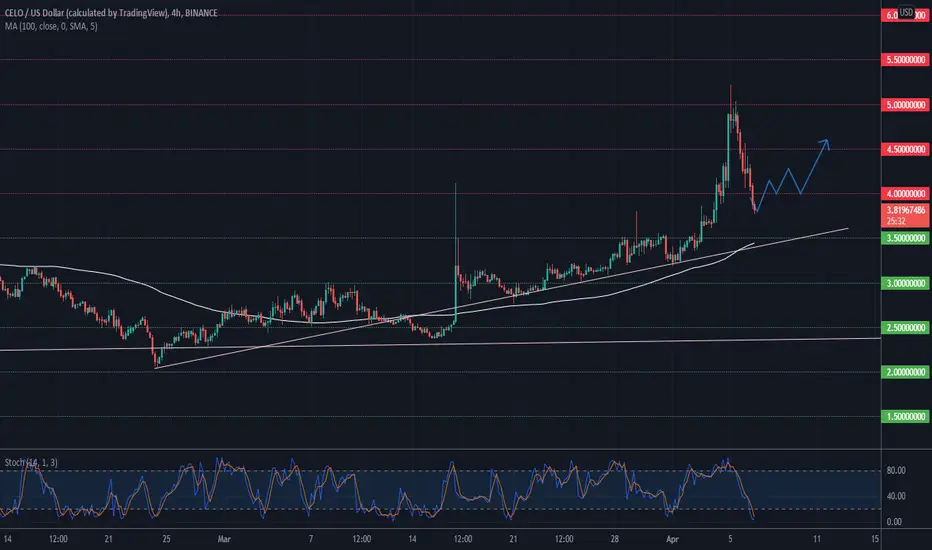
Celo Price Analysis — April 6CELO resumed a bearish momentum on Wednesday, as the cryptocurrency erased most of the gains it accrued in April.
The payments cryptocurrency fell below the $4.000 psychological level a few hours ago, after a sharp rejection from the $5.218 peak, its highest point since January 14. In a way, this correction was a much-needed one following the 62% parabolic rally recorded between April 1 and 3.
That said, I foresee a bearish slowdown at the $3.850 figure as trading conditions enter oversold territories on the 4-hour stochastic indicator. As such, we should see a return to the $4.000 psychological level in the coming hours, followed by a drawn-out consolidation around that line and an eventual rebound over the coming days.
Meanwhile, my resistance levels are at $.4.000, $4.500, and $5.000, and my support levels are at $3.500, $3.000, and $2,500.
Total Market Capitalization: $2.01 trillion
Celo Market Capitalization: $1.6 billion
Celo Dominance: 0.08%
Market Rank: #64
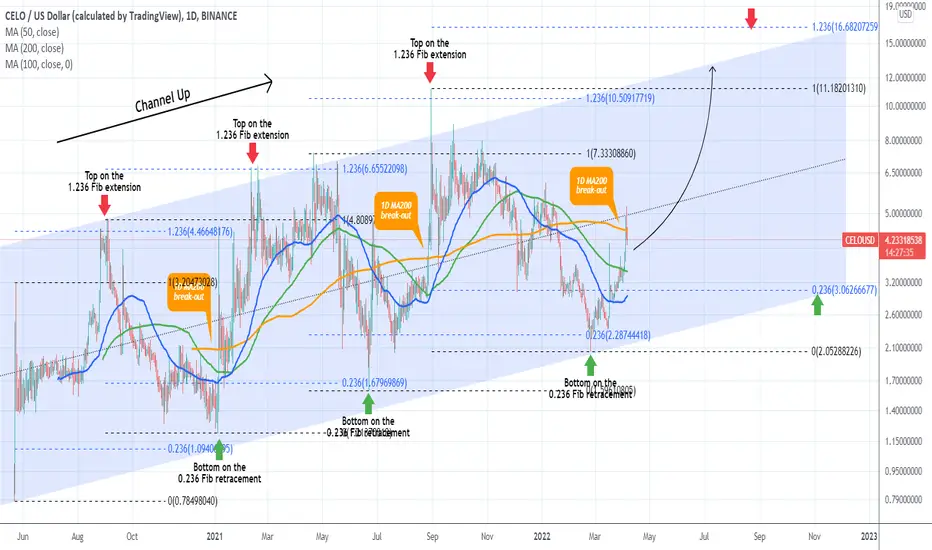
CELOUSD The most structured Channel Up in the marketCelo (CELOUSD) has seen a very strong rise since the start of the month that resulted in breaking above the 1D MA200 (orang trend-line) for the first time since January 17. The wider pattern of roughly the last two years has been a Channel Up, with highly structured Higher Highs (tops/ red arrows) and Higher Lows (bottoms/ green arrows).
In fact the past two 1D MA200 crosses following a Channel Up Higher Low, have been the final signal for the rally towards the new Higher High. That is technically around the 1.236 Fibonacci extension in relation to the previous top. Similarly the Higher Lows are around the 0.236 Fibonacci retracement level. At the moment the 1.236 Fib ext on the current wave is around $16.68 but if you are long on Celo it might be safer to start taking profits as soon as the price hits the Higher Highs trend-line of the Channel Up.
--------------------------------------------------------------------------------------------------------
** Please support this idea with your likes and comments, it is the best way to keep it relevant and support me. **
--------------------------------------------------------------------------------------------------------
Great Long For CELOHi guys
CELO just Ended the (F) leg in 4th of March (Triangle)
So We better Long it for (G) Wave
If you want us to talk more about (G) wave
(G)s are Really Fast and Strong Most of the times
Did you notice the Celo Nowadays?
It got really strong vs BTC in these last days
Note that: There are 2 Scenarios for G Wave
1st: TP is Above $7.7 - in this Scenario we Except G to have sharp moves and fill the Triangle(in F Wave)
2nd: We Expect CELO to Break the Resistance and Reach +$30 within 120 Days
You know about Celo's Goals for 2025, Right? :)
So this is why i can say 2nd Scenario is more likely
I was waiting for this Moment for almost 6 Months
Lets see What is Gonna happen to CELO
