CELOUSDT is testing the 0.618 Fibonacci LevelThe price had a breakout from the descending channel on the daily timeframe ant it tried to have another breakout from the weekly resistance without any success.
Now the market is creating a head and shoulders on the daily timeframe and the price is testing the 0.618 Fibonacci level.
If the price is going to lose the support, we could see a retest of the dynamic support around 3.6$
–––––
Follow the Shrimp 🦐
Keep in mind.
🟣 Purple structure -> Monthly structure.
🔴 Red structure -> Weekly structure.
🔵 Blue structure -> Daily structure.
🟡 Yellow structure -> 4h structure.
CELOUSDT.PS trade ideas

$CELOwe have A BEAUTIFUL hidden divergence with RSI indecator
tell us the price ging down
line 2 is stronger then other for buying order

celo---usdtDue to the formation of the channel and the reversal of the price from the support area of the channel and also the creation of an inverted hammer pattern on the bottom of the channel, it is expected that the resistance area of the channel will increase in price.

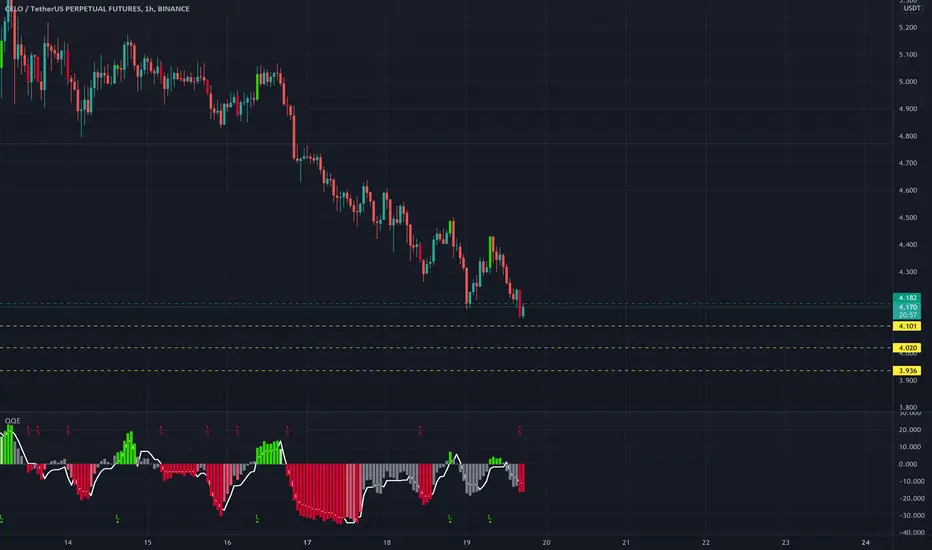
High Risk CELOUSDTPERP Short on the hourly time frameI am not taking this signal, but here's a high risk short. High risk because of BTC's weekly position. Nevertheless, this is an 8X short with liquidation as the SL and 3 TPs on the chart. This is a pullback entry short.

CELOUSDTBetween fibonacci levels of 0.5 and 0.618, limit buy orders can be placed with a ladder.
The current price doesn't look bad either, but bitcoin could ruin everything.

CELO/USDTANY FEEDBACK WOULD HELP ME OUT, SO I CAN UNDERSTAND IF IM DOING THIS RIGHT!!!
CELO/USDT. As you can see from the chart we have a descending triangle pattern occurring, making lower lows and lower highs. Using the Fib retracement from the highest point of each high, we can see each time the new highs are hit exactly on the golden ratio, where the current candle is you see we are directly on the golden ratio meaning that we could see it bounce off. However from the RSI indicator we have crossed over showing not a lot of buying pressure. Could see this dip down below following the descending triangle pattern.

celousdtcelousdt if break the flag it will going for 6000usd
celo agar parchamesh ro beshkane mitone 6000 dollar ro bebine .
movafagh va piroz bashid. ❤❤❤❤

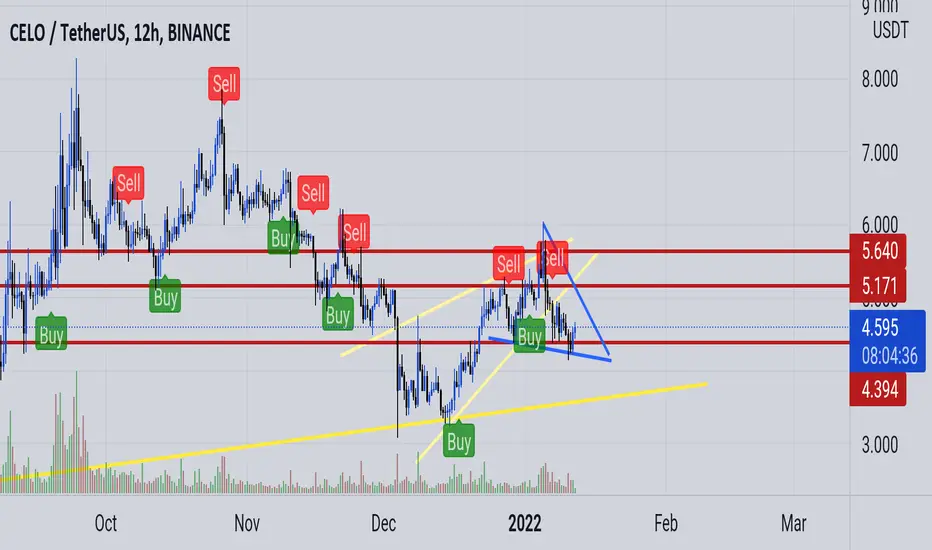
CELO, it's worth waiting for clear preconditions. CELO is in a big value area. It is worth highlighting that the price has broken the trend line and tested it as support. This is a good signal. At the moment the price is in the middle of this range and there are no clear prerequisites to open a position.
In case of a squeeze and breakout of the key level, there could be a good buying opportunity.
Write in the comments all your questions and instruments analysis of which you want to see.
Friends, push the like button, write a comment, and share with your mates - that would be the best THANK YOU.
P.S. I personally will open entry if the price will show it according to my strategy.
Always make your analysis before a trade.


Mixed signals on CELOOn the positive side, CELO has broken the Trend Resistance and the 4-hour chart (not shown) suggests we may bounce off the new support line. That bullishness, however, should be tempered with the Daily chart which suggests Buyer Exhaustion is on the horizon. In addition, I'm seeing negative pressure that could signal a sharp downward move. The chart is too risky for me, I need to see some Daily bullish signals before considering a long.
----------------------------------------------------------------
These are my personal views and not financial advice. Please do your own research before investing.
I'd love to hear your thoughts, ideas and feedback. Feel free to Comment and I'll try and get back to you quickly.
If you appreciated this analysis, consider Liking or Following . Thanks!


celousdt long commenttp 1 done 10.5%
take profit never wrong
this is comment for my previous analysis
always dyor and happy profit


CELOUSDTThis project is very potential number one on the mobile platform. 2022 I think it will thrive. buy it sell levels 7$-10-12$ buy and thank you laster

CELO-USDT LONG/BUYMulti-time Frame Analysis.
Entry=5.23, SL=4.25, TP1=6.2, TP2=9.2, TP3=10.8. R/R=6.5
Good luck with your trading !

#CELO Needs to close daily above 5.28#CELO in its #USDT pair broke out static resistance in area of 5.26 and we need to wait for good entry after confirmation
If #CELO close daily above the resistance level (Red area) it can pump more than 15%
Good Entry after Success break out : 5.4
Stop loss : 4.96

CELOUSDT SETUPCELOUSDT, there is some bullish indication in the CELO, as the price bounced from a strong support zone, it has retested the breakout and retraced. So we are expected the bulls will chase some near-term targets around 6.50-7.0. Good Luck!


CELO bullish channelkondisi CELO terlihat masih uptrend ada kemungkinan kenaikan akan berlanjut bila tembus di resistance area nya
