CETUS: The Smart Investment for Short-Term Growth! (12H)Since we placed the red arrow on the chart, the CETUS correction has begun.
It seems to be a double correction, with two diametric patterns—one butterfly and one diamon. connected together.
Currently, we appear to be in wave f of the diamond diametric. Once the correction completes and reaches the green zone, wave g could finish.
We’ll need to see if after wave g, we have wave x, wave h, or a post-pattern movement!
The targets are marked on the chart. A daily candle close below the invalidation level will invalidate this analysis.
For risk management, please don't forget stop loss and capital management
When we reach the first target, save some profit and then change the stop to entry
Comment if you have any questions
Thank You
CETUSUSDT.P trade ideas

CETUSUSDTWe can attempt to short CETUSUSDT from specified level as it make LH , also 0.5 FIB Level occur indicate that it moves downward.
SL , TP mention in chart.

cetus short term goalThere are alot of DEX's previously, Notable ones were Cake and radiyum
If radiyum topped at 1.5bn mcap and cake at 6bn mcap, cetus would require a price of 1.6 to reach 1bn mcap so a 5x before even reaching previous ranges of similar projects.
if we know this and we expect coins to perform stronger this season i dont think a 3bn mcap at a price of 5 is far fetched, we will see.
GOOD LUCK!!
tp1:1.6 easy!!

Bullish in short termBINANCE:CETUSUSDT is bullish in short term. However, it will take minor correction before going up.

cetus - boxThe price is in the box, after the breakthrough I wait for the targets that I marked on the chart to be reached.

Cetus on daily frame As we know cetus = cow
The same move I expect after breaking out 0.39
Its gonna explode toward 0.41 then small correction which will give it the chance to go above 1$

Cetus on daily frame As we know cetus = cow
The same move I expect after breaking out 0.39
Its gonna explode toward 0.41 then small correction which will give it the chance to go above 1$

CETUS #cryptoI don't have much understanding of cryptocurrency. I have purchased this and a few other coins based solely on technical charts. Since it's a very risky investment, I've only invested a small amount.


Cetus Protocol | CZ, Cetus & BinanceWhen the Protocol Is More Stable than Your Love Life!
Cetus is a decentralized exchange aka DEX and concentrated liquidity protocol developed on the Sui and Aptos blockchains. Its mission is to establish a robust and adaptable liquidity network that simplifies trading for users and assets. Cetus aims to deliver an optimal trading experience and enhanced liquidity efficiency to DeFi users by building a concentrated liquidity protocol alongside various interoperable functional modules
Cetus Protocol pumped 60% after Binance Partnership News!
Also the trading volume jumped 900%, now you see why CZ end up in jail
The price of Cetus is $0.42, reflecting an 11% decline over the past 24 hours. The ATH of $0.49 was achieved on November 10, 2024, putting the current price down by 12% from its peak
Cetus Protocol has a circulating supply of 588.30 million tokens out of a maximum of 1 billion. Over the last 24 hours, its trading volume has reached $172.43 million. CETUS’s lowest recorded price was $0.026 on June 12, 2023, making the current price approximately 1,500% higher than its all-time low.
Cetus Protocol is traded on 21 markets across 25 exchanges, with Binance being the most active. It holds a 0.01% share of the cryptocurrency market, with a market capitalization of $ 251 million

#CETUS: Driving Innovation in DEX LiquidityDescription:
This trading idea highlights CETUS, the utility token powering the Cetus Protocol, a decentralized exchange (DEX) designed to optimize liquidity and trading efficiency in the decentralized finance (DeFi) space. CETUS facilitates governance, incentivizes liquidity providers, and supports seamless transactions on the platform. With its focus on improving automated market-making (AMM) mechanisms and cross-chain interoperability, Cetus Protocol positions itself as a cutting-edge solution in the evolving DeFi ecosystem. As DeFi adoption grows, CETUS could play a significant role in enhancing decentralized trading experiences.
That said, it is essential to understand that cryptocurrency markets are highly volatile and influenced by external factors like regulatory developments, technological advancements, and market sentiment. Trading or investing in CETUS carries inherent risks, requiring a robust strategy and diligent risk management.
Disclaimer:
This trading idea is for educational purposes only and does not constitute financial advice. Trading cryptocurrencies like CETUS involves substantial risk, including the potential loss of your entire investment. Perform thorough research, evaluate your financial circumstances, and consult with a professional advisor before making any investment decisions. Past performance is not indicative of future results.

Cetus on 1 day chart Cetus is a protocol crypto currency
Its in up trend buy and wait they gonna pump it


cetusBased on the pattern formed, the Cetus token is on a support level, and considering it has been consolidating at the end of a downtrend, it could start moving towards higher targets with the influx of capital.

CETUSUSDT.P LONG $CETUS
CMP! or 0.31989
TP1: 0.41220
TP2: 0.48859
Sl:
Manual exit if we
Fall below 0.30870
(4h) — $0.29993
RR: 1:5
DYOR

Cetus usdt long ideaLonging Cetus after the restest of 0.351 area with stop loss at 0.30 , this oone potential because cetus is a leading dex on sui and sui memes are trending in the market , also prefer for spot for those who want to take less risk compared to the perps.

CETUS $0.15 | The Next Big DEX ++powered by TiA & & Luna FUNDSlike Solana's MEME fever took BONK to insane rewards
now comes CETUS that shall tae SUi & super coins to next level of madness
we all know that the designated or preferred DEX
shall be discounted towards FWB:1BN before the PUBLIC starts shilling its meme and other issues
CETUS is the Pancake Velodrome or DEX of SUi
and SUi intends be as sexy as ETH and SOLANA
cost of BANKER $0.007 cents
Show of Commitment $0.50
Pre arranged Settlement $1.60 | $2.20
Turnover of Float for next cycle $4.0++
Strategy: Buy and Hold
Catalyst Fresh Capital allocation at premium in progress

Cet chartCet chart with key levels done on Spirals.
Bullish trendline if it`s broken and support does not hold most likely will drive the price down.
Each level can reject to lower values.

CETUS/USDT LONGBased on the CETUS/USDT 1-hour chart provided, here is an analysis for a potential long setup:
Key Observations:
Trend Analysis:
The chart shows a recent strong bullish momentum indicated by multiple Breaks of Structure (BOS). The price has surged upwards, confirming bullish sentiment.
The formation of a Weak High near the current price indicates a potential retest or breakout zone.
Support and Resistance Levels:
The nearest support level is around $0.3330–$0.3400, where the price recently consolidated before pushing upward.
The next resistance zone is near the Weak High level at approximately $0.3450–$0.3500. A breakout above this level could lead to further upward movement.
Chart Patterns:
The chart shows an ascending triangle pattern, with higher lows converging towards a resistance level. This pattern often signifies a continuation of an uptrend and increases the likelihood of a breakout.
Indicators:
RSI (Relative Strength Index): The RSI is positioned in the higher range, indicating bullish momentum but approaching an overbought condition. Caution is advised, as overbought RSI levels can precede a pullback.
Moving Averages: The price appears to be supported by a shorter-term moving average (possibly the 50-period MA), which aligns with an upward trend confirmation.
Long Trade Analysis:
Potential Long Entry:
A long position could be considered if the price breaks above the Weak High near $0.3450, confirming further bullish momentum.
Stop-Loss:
Below the nearest support at $0.3330 to manage risk effectively.
Take Profit Targets:
First Target: $0.3700, where previous price action has shown potential resistance.
Second Target: $0.4000, which aligns with the next significant historical resistance zone.
Alternative Scenario:
If the price fails to break above $0.3450 and instead retraces, monitor the $0.3330–$0.3400 support area for a potential re-entry opportunity.
Conclusion:
This analysis suggests waiting for confirmation of a breakout above the $0.3450 level for a safer long entry. It’s crucial to monitor the RSI for signs of divergence or a potential pullback and adjust stop-loss and profit targets accordingly.

CETUS THE SUI DEX THAT IS READY TO MOON!Here we can see a clear Fib movement that has been placed right along BTC trying to chase the ATH. Any FIB level should be taken seriously as Profit levels.

cetus long term goalListen yall,
RAYDIUM is a dex for Solana and it reached 1 bn mcap, now assuming SUI is the next big thing, at 1.6 we will have 500 mil marketcap and at 1bn 3.2 and assuming every cycle is stronger and outperforms the previous cycle, breaking 1bn mcap for cetus is not difficult.
Now let us hope SUI meets our expectations to see this possibility.
Charles the maker of ADA said that Sui coin is everything that Solana should have been so who knows.
If this reaches 1.6 ill run naked in the streets

Cetus Protocol Double-Top: Correction Or Higher High?Hello again, this project we are reviewing for the first time and the chart is now pointing toward a strong correction.
➖ CETUSUSDT produced a double-top pattern, with a higher high, and soon proceeded to move back below its March 2024 peak price.
The pair produced a strong bullish wave between August and October. If you compare the volume between early 2024 and last month, you can see a huge difference. Trading volume is much lower this time around even though prices moved higher than in March.
➖ As soon as CETUSUSDT moves back below the top that was hit in March, the chart potential becomes extremely bearish.
Just as there was a correction after the last bullish wave, this bullish wave is also likely to lead to a correction.
It goes like this:
➢ As long as CETUSUSDT trades weekly below 0.22, bearish potential is dominant.
➢ On the other hand, if CETUSUSDT moves and closes weekly above 0.22, which is the last major high before the recent one, the conditions turn bullish.
Since the price is now below this level, black line on the chart, the conditions are bearish and we can expect lower prices next.
Thank you for reading.
Namaste.

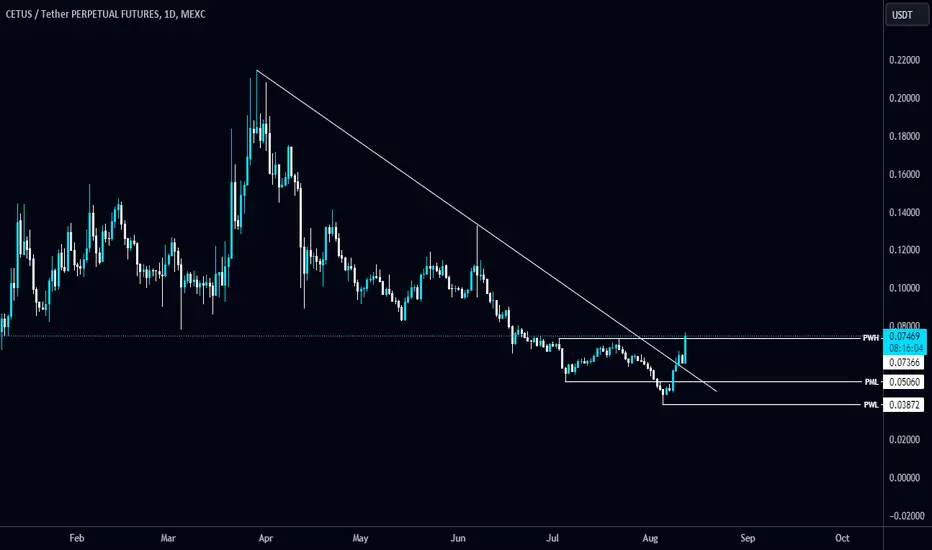
#CETUS/USDT breaks the diagonal trendline in Daily TF!#CETUS/USDT breaks the diagonal trendline in Daily TF!
$CETUS breaking the PMH $0.07366. Wait for BO and holding above as a support to remain bullish. The local support level is PML $0.0506.