CHZUSD LongThis appears to be forming a cup and handle. I put it on the 4 hour to show the support levels on the way up. You could easily zoom out to the daily and see the pattern better. Would have to continue and show a break at the neckline and hold support on chart for validation. Please any comments would be great as I'm new to TA, thanks!
CHZPERP trade ideas

CHZ Chart gearing up for SOSI found a couple of great trend lines going all the way back to the start of Chiliz. Since the launch, they have since changed their logo and am curious to see how this runs. There is a lot of potential here and considering it is a "sports trading social token" I am curious to see if it runs with the olympics. Just a thought to throw out into the universe. As much as I can see, this is a pretty clean Wycoff chart heading up into the SOS phase. I am learning as I have sat studied through the bear market that the charts are the charts and the narratives are what run the show to keep the MM going. ;-)


CHZUSD (4H) - Bullish reversalHi Traders
CHZUSD (4H Timeframe)
Waiting for the upward break of 0.0776 resistance level, which will complete a bullish trend reversal pattern to go LONG. Only the downward break of 0.0716 would cancel the bullish scenario.
Trade details
Entry: 0.0776
Stop loss: 0.0716
Take profit 1: 0.0813
Take profit 2: 0.0872
Score: 6
Strategy: Bullish reversal

CHZ/USDT Secondary trendLogarithm. Time frame 3 days. Secondary trend. Downward channel.
After the rebound, the price is squeezed in a narrow 124-144 zone. The chart shows the percentages to the key support/resistance levels from this price squeeze zone.
Risk Management.
It is worth noting that the price of the coin is at a super profit, I have clearly shown this on the chart, which shows the entire main, long-term trend (the entire trading history). Consequently, when working on a coin, you need to keep this in mind and limit potential losses. Observe the risk management.
A local trend. The time frame is 1 day.
CHZ/USD Local trade. Pivot zone.
Main trend Time frame 1 week.

Chz to 0.095CHZ broke throught the resistance line and started to make signs of an uptrend .
It is supposed to hit 0.095 this month

CHZ creating a momentumCHZ is creating momentum on 4hrs and 1hrs TF as keep breaking structure to the upside…. Also, CHZ is one of the coin that mostly pump during weekend because is easy to manipulate…. Is good to take at CMP or wait for retest for the 1hr bullish OB below and use the indicated price in the chart as target
Follow for more market update

CHZ/USD (Chiliz) Longterm Analysis CHZ/USD (Chiliz) Longterm Analysis
We see that 959 days have passed since the peak. this is quite a long time. we are in a parallel channel. i think it will make an upward attack with the market movement in the near future. the rsi level also confirms this.
the red line is a very important support
>>You can easily see the levels on the chart. <<
Now the upward breakout is a matter of time on the weekly chart.
>>In the rally towards the end of 2024, I think that mana will be strongly accompanied. I think it will exceed the old ath level.
CHZ/BTC 1w

CHZUSD (Daily) - Bearish breakoutHi Traders
CHZUSD (Daily Timeframe)
The market is in a downtrend, and we are waiting for an entry signal to go SHORT below the 0.05463 support level. Only the upward break of 0.06543 would cancel the bearish scenario.
Trade details
Entry: 0.05463
Stop loss: 0.06543
Take profit 1: 0.04796
Take profit 2: 0.03716
Score: 8
Strategy: Bearish breakout

CHZUSDTAs we can see the coin is chilling below the support and look like it is getting ready to take a dip further down.

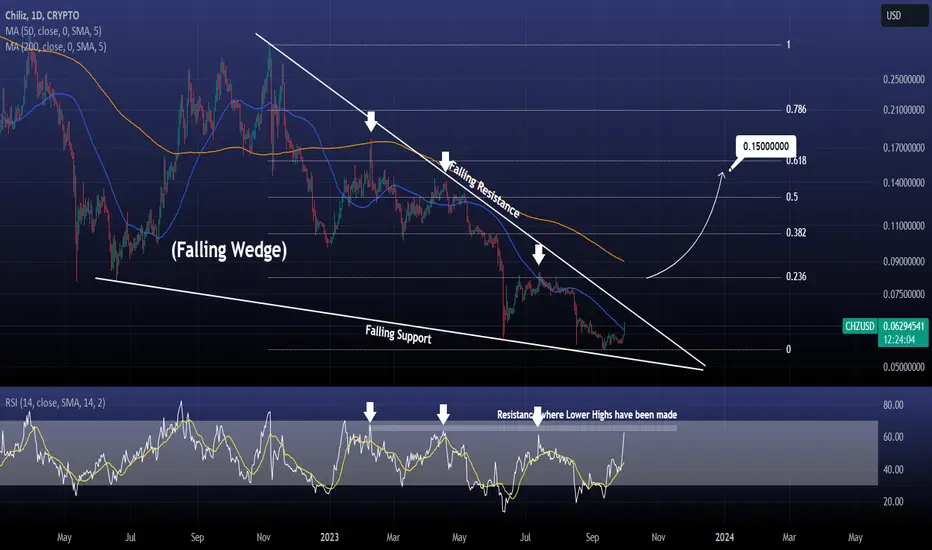
CHZUSD Giant Falling Wedge about to break upwards?Chiliz / CHZUSD crossed today over the 1day MA50 for the first time in 2 months.
Even though that is a significant bullish signal, it is still not as strong as a potential break over the top of the Falling Wedge pattern would be.
As a result, a break over the Falling Resistance would target the 0.236 Fibonacci level and 1day MA200.
Buy when a 1day candle closes over the 1day MA200 and target 0.15000 (a little under the 0.618 Fibonacci).
Note that the 1day RSI is on the Resistance level which has priced 3 Lower Highs on the Falling Wedge. This is why wee need to see a clear breakout.
Follow us, like the idea and leave a comment below!!
Spot buying $CHZ ChilizThis pair looks extremely short squeezed hence a reversal is highly probable.
also,
Football mania is catching up!
Hence buying this sentiment is ideal

CHZ/USD Local trade. Pivot zone.Logarithm. Time frame 1 day. Local trend. The reversal zone (price squeezed) in the descending channel.
After the rebound, the price is squeezed in a narrow zone of 124-144. The chart shows the percentages to the key support/resistance levels from this price squeeze zone.
Risk management.
It's worth noting that the price of the coin is at a super profit, I've clearly shown this on the chart, which shows the entire main, long-term trend (the entire trading history). Consequently, when working on a coin, you need to keep this in mind and limit potential losses. Observe the risk management.
Secondary trend. Time frame 3 days.
CHZ/USDT Secondary trend

✴️ Chiliz | Weak But Not For Long...We can see that CHZUSD (Chiliz) is trading below its May 2022 low which is a signal of weakness.
Many other Altcoins are already above EMA50 and EMA100 daily but this one is lagging behind.
As I explained before, with thousands and thousands of Altcoins, some will move ahead and the rest will follow.
The market moves in sections, in groups.
We have a lower low in June and a V shape recovery.
We have a very strong bullish divergence with the MACD which is very telling as these divergences only develop when a reversal is about to happen. This being a year long divergence tells us everything we need to know.
Here is the MACD chart:
That's pretty much it.
Wishing you a good day!
Salutations.


CHZUSD (4H) - Bullish reversalHi Traders
CHZUSD (4H Timeframe)
Waiting for the upward break of 0.1041 resistance level, which will complete a bullish trend reversal pattern to go LONG. Only the downward break of 0.0974 would cancel the bullish scenario.
Trade details
Entry: 0.1041
Stop loss: 0.0974
Take profit 1: 0.1082
Take profit 2: 0.1148
Score: 7
Strategy: Bullish reversal

my idea about chzmy idea about chz
my opinion is positive for chz.
These trades reflect my trading history and are not investment advice

$CHZ bound for possible breakout or new ATH? FWB:CHZ seems interesting. Previously it consolidates at around 570 days. As soon as it breakout, rallied for over 3100% in 35 days. Currently, on the downtrend for over 2 years or > 766 days. If it breaks the parallel line resistance, could it repeat the previous pattern and form a possible bullish flag? Hmmm, lets see. Alert set at parallel lines. Watch out. Trade cautiously.

CHZUSD Bearish It printed the LH and LL and is looking Bearish at the moment and it could give a profit if it follows the downtrend


CHZ Still stuck in tight bandCHZ is currently trading in a tight resistance/support band. The direction of the crypto market in general will determine direction, but as shown here, the likely upside movement should the market rise is much greater than the immediate downward movement should the markets move down.
These bands are partly based on both monthly and quarterly trends, so expect them to expire by the end of the current week.

CHZUSD Inverse Cup and HandleCHZUSD forming a inverse cup and handle? Will the price test the descending channel support?
Mind that the channel support meets weekly oversold and the $ 0.05 support.
What do you think it will happen?

