USO USD Oil consider buying. Finally!
USOUSD has opened up in Asia Friday with nice volume and very early a Higher High in price.
There's even a hint of a pullback in price.
CL-OIL trade ideas

USOILUSOIL is in reversaal zone.
Trend will be reversal from here.
Aligator face is open upward which indicates it will go up from here.
we buy at CMP.

USOIL BULLS ARE STRONG HERE|LONG
Hello, Friends!
USOIL pair is in the uptrend because previous week’s candle is green, while the price is obviously falling on the 9H timeframe. And after the retest of the support line below I believe we will see a move up towards the target above at 76.57 because the pair is oversold due to its proximity to the lower BB band and a bullish correction is likely.
✅LIKE AND COMMENT MY IDEAS✅

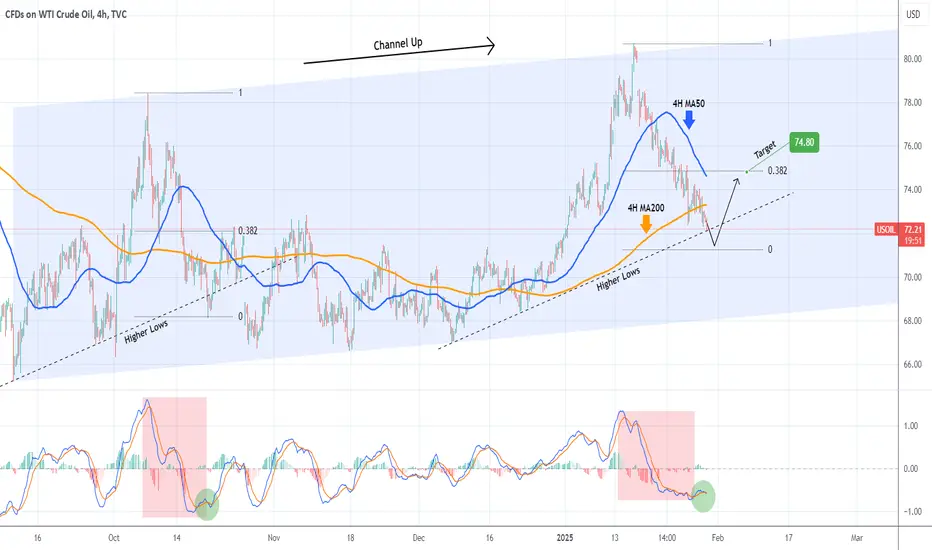
WTI OIL on a Bearish Leg but short-term rebound expected.WTI Oil (USOIL) has been trading within a Channel Up pattern that is unfolding its latest Bearish Leg. This Leg just hit the Higher Lows trend-line from the last bottom, which is so far no different than what took place during the previous Bearish Leg on October 18 2024.
The 4H MACD sequences among the two fractals are very similar so, as the October price action did, we expect a marginal breach of the Higher Lows followed by an instant rebound above the 4H MA50 (blue trend-line) and towards the 0.382 Fibonacci retracement level. As a result our short-term Target is $74.80.
-------------------------------------------------------------------------------
** Please LIKE 👍, FOLLOW ✅, SHARE 🙌 and COMMENT ✍ if you enjoy this idea! Also share your ideas and charts in the comments section below! This is best way to keep it relevant, support us, keep the content here free and allow the idea to reach as many people as possible. **
-------------------------------------------------------------------------------
💸💸💸💸💸💸
👇 👇 👇 👇 👇 👇
The Oil price & its pullback is almost ready to turn back around
The only thing I might keep a watchful eye on is the Dollar which now is also puling back but possibly moving higher soon.& hopefully I have a Buy on the daily chart soon on the oil price.
What are traders thoughts about the traditional inverse relationship between oil and the dollar?
What we know is that the Dollar has already made a significant move in it's rally and now it's time for the weekly candle in oil to pump this thing higher.
It won't be as lucrative pulling into a petrol station.

Could the price bounce from here?WTI Oil (XTI/USD) is falling towards the pivot which has been identified as an overlap support and could bounce to the 1st resistance.
Pivot: 72.88
1st Support: 71.49
1st Resistance: 75.29
Risk Warning:
Trading Forex and CFDs carries a high level of risk to your capital and you should only trade with money you can afford to lose. Trading Forex and CFDs may not be suitable for all investors, so please ensure that you fully understand the risks involved and seek independent advice if necessary.
Disclaimer:
The above opinions given constitute general market commentary, and do not constitute the opinion or advice of IC Markets or any form of personal or investment advice.
Any opinions, news, research, analyses, prices, other information, or links to third-party sites contained on this website are provided on an "as-is" basis, are intended only to be informative, is not an advice nor a recommendation, nor research, or a record of our trading prices, or an offer of, or solicitation for a transaction in any financial instrument and thus should not be treated as such. The information provided does not involve any specific investment objectives, financial situation and needs of any specific person who may receive it. Please be aware, that past performance is not a reliable indicator of future performance and/or results. Past Performance or Forward-looking scenarios based upon the reasonable beliefs of the third-party provider are not a guarantee of future performance. Actual results may differ materially from those anticipated in forward-looking or past performance statements. IC Markets makes no representation or warranty and assumes no liability as to the accuracy or completeness of the information provided, nor any loss arising from any investment based on a recommendation, forecast or any information supplied by any third-party.

The monthly Oil cycle since April fool's day 2020. Am I a fool?
I will keep this brief as it might be a Fibonacci witch-hunt. The oil bull-run commenced in April of 2020 & that commencement is flagged with a green vertical broken line. Note the Fibonacci zero-level as well from 04/2020 and a trend line extended to oil's high price made in March 2022.
You will see ChartPrime's 'smart money indicator' print a green bullish up arrow (thick) in Oct. 21.
Th monthly chart clearly shows the very bottom AlgoAlpha volume indicator where volume was at a peak coinciding with the higher monthly price around the 1st & 2nd quarters of 2022 and as this indicator turns red on lesser volume we see that monthly candles turn bearish red as you would expect and down price goes to July 2023 which for reference I also denoted with a vertical broken white line.
Did I say something about making this short? I will try & wrap this up.
I continue to be bullish for oil purely from its higher TF charts. Here is why in brief form.:
1. Fib levels are more precise in higher TF's, correct me if I'm wrong? Price is still in the golden zone near 50%.
2. Oil on this chart was in a consolidation period since Sep. 2024 but look what price is doing in the monthly candle we are currently in. I.e.. It is breaking higher. (I picked an oil long trade a few weeks back, around Xmas, check my TV publication if you would prefer)
3. The volume indicator is at the lows of historical volume but Algo' in their instructions state a geen circle print is quite likely a bullish turning cycle in volume. Plus weekly & daily volume is very high.
Look, there's much more indicating another strong run and if and whennprice breaks higher of the Sep '23 candle it will be a huge breakout to test those early 2022 highs. This could coincide with a world recession and a breakout in the oil price.

US OILUS OIL has made a double bottom with bullish divergence. A long position can be considered on the breakout

Bullish bounce?USO/USD is falling towards the support level which is an overlap support and could bounce from this level to our take profit.
Entry: 72.78
Why we like it:
There is an overlap support level.
Stop loss: 71.50
Why we like it:
There is a pullback support that is slightly above the 71% Fibonacci retracement.
Take profit: 75.04
Why we like it:
There is a pullback resistance level.
Enjoying your TradingView experience? Review us!
Please be advised that the information presented on TradingView is provided to Vantage (‘Vantage Global Limited’, ‘we’) by a third-party provider (‘Everest Fortune Group’). Please be reminded that you are solely responsible for the trading decisions on your account. There is a very high degree of risk involved in trading. Any information and/or content is intended entirely for research, educational and informational purposes only and does not constitute investment or consultation advice or investment strategy. The information is not tailored to the investment needs of any specific person and therefore does not involve a consideration of any of the investment objectives, financial situation or needs of any viewer that may receive it. Kindly also note that past performance is not a reliable indicator of future results. Actual results may differ materially from those anticipated in forward-looking or past performance statements. We assume no liability as to the accuracy or completeness of any of the information and/or content provided herein and the Company cannot be held responsible for any omission, mistake nor for any loss or damage including without limitation to any loss of profit which may arise from reliance on any information supplied by Everest Fortune Group.

update usoilHow are you doing with these good markets, friends?
Today we have an update oil as well
In the past days and weeks I talked about rising from the 69.750 areas as a key to rising when oil was negative on the daily frame negative and we have a rise to the $80 point
And we will see more rising with the break of the 72.500 area and indeed we saw this rise as we expected
And I told you that it is expected that we will see a decline with reaching this level and indeed today we saw a somewhat violent decline from the small time frames
We have two scenarios
The first is that the daily time frame is still positive but we will see a decline on the small time frames and this will take us to levels perhaps 73 and rise again
The other scenario is if it is broken strongly next week or this week with the weekly closing it will turn into a negative daily frame and we will go to lower areas
We will see more decline until 69
You have this chart you can check the break of each line where the market will go

Crude Oil Update – Jan 29📊 Crude Oil FX:USOIL Update – Jan 29
Lol, the market somehow found its way to our buy-zone! 🤔
🔹 The big question now— do we take the trade or wait?
🔹 Ignoring the fundamental report this time, focusing purely on technicals.
🔹 If price dips lower, even better—we’ll get a stronger buy entry. If not, we wait for a clear bullish breakout before making a move.
Keeping a close watch—stay tuned! 👀🔥

Oil analysis before interest ratesIf oil manages to break its downtrend line upwards and exit the channel, it will move towards the specified target.

Oil testing supportCrude prices were a touch softer in early trade this morning. Yet prices for WTI appear to be oscillating around $73.85 – a level which represents the 50% retracement of the rally from early December to the recent high of $80.61. It also marks a point on the downwardly-sloping trendline which was broken above nearly three weeks ago, and is now being retested as support. Could this mark the end of a correction from recent highs? And if so, could that mean that oil is now consolidating ahead of another rally attempt? It’s certainly possible, particularly as the daily MACD has pulled back sharply from the overbought levels seen two weeks ago. But aside from the technical picture, there are plenty of unknowables on the fundamental side. Chief amongst these is what President Trump is going to do about tariffs. Soon after his inauguration, just over a week ago, he threatened 25% tariffs on Canadian and Mexican imports from 1st February, along with a mention of a 10% tariff (down from 60%) on China. On Monday, Scott Bessent was confirmed as the new US Treasury Secretary. He began his appointment by calling for a universal tariff of 2.5% on all imports to the US. This surprised market participants, most of whom had come to expect that tariffs would be threatened/applied on a ‘case-by-case’ basis. As far as oil is concerned, both Canada and Mexico export oil to the US.

USOIL Will Go Higher From Support! Buy!
Take a look at our analysis for USOIL.
Time Frame: 7h
Current Trend: Bullish
Sentiment: Oversold (based on 7-period RSI)
Forecast: Bullish
The market is trading around a solid horizontal structure 73.23.
The above observations make me that the market will inevitably achieve 75.54 level.
P.S
We determine oversold/overbought condition with RSI indicator.
When it drops below 30 - the market is considered to be oversold.
When it bounces above 70 - the market is considered to be overbought.
Like and subscribe and comment my ideas if you enjoy them!

Get set to buy the Oil Price with support on Daily TF.
We have 3 Daily candles adjacent to prior support. I like this zone. I thought Oil was going up a week ago but this i the golden moment coming into play, pull out MACD Zero Lag indicator and lets wait for Signal line have to receive an upwards and bullish cross by the Macd line.
Prefer price action, hey so do I, but my Macd is like a child I care about.


WTI OIL: Bearish Channel with a Potential Upside BreakoutWTI OIL: Bearish Channel with a Potential Upside Breakout
WTI CRUDE OIL continues to trade within a well-defined downward price channel , with minor breakouts failing to gain traction due to the lack of consolidation. This price action suggests that the market remains under bearish pressure, but the structure itself hints at a possible reversal.
According to classic technical analysis, prolonged movement within a descending channel often leads to an upward breakout , as selling momentum weakens and buyers step in. To confirm this bullish scenario, we need to see a strong breakout above the upper boundary of the channel , followed by price stabilization and a retest of key resistance levels.
On the other hand, if sellers maintain control and we see increased bearish momentum, oil could continue drifting lower within the channel, delaying the potential breakout.
Should closely watch volume dynamics and key resistance levels for signs of a shift in market sentiment.

CRUDE OIL - in plain and simple viewObserving crude without noise and with lens of pure price action. It's the law of physics that things cannot be compressed for too long, hence I see range break soon, with bias on upside as lot of pending liquidity is there with imp FIB levels already tested.

Market Analysis: Oil Takes a HitMarket Analysis: Oil Takes a Hit
Crude oil is showing bearish signs and might decline below $72.20.
Important Takeaways for Oil Price Analysis Today
- Crude oil prices failed to clear the $80.00 region and started a fresh decline.
- There is a key bearish trend line forming with resistance at $73.85 on the hourly chart of XTI/USD at FXOpen.
Oil Price Technical Analysis
On the hourly chart of WTI Crude Oil at FXOpen, the price struggled to clear the $80.00 resistance zone against the US Dollar. The price started a fresh decline below the $76.35 support.
The price even dipped below the $75.00 level and the 50-hour simple moving average. The bulls are now active near the $72.20 level. A low was formed at $72.16, and the price is now consolidating losses. If there is a fresh increase, it could face resistance near the 23.6% Fib retracement level of the downward move from the $79.44 swing high to the $72.16 low at $73.85.
There is also a key bearish trend line forming with resistance at $73.85. The first major resistance is near the $75.80 level or the 50% Fib retracement level of the downward move from the $79.44 swing high to the $72.16 low.
Any more gains might send the price toward the $76.35 level. Any more gains might call for a test of $79.45. Conversely, the price might continue to move down and revisit the $72.20 support. The next major support on the WTI crude oil chart is $70.00.
If there is a downside break, the price might decline toward $70.00. Any more losses may perhaps open the doors for a move toward the $68.50 support zone.
Trade on TradingView with FXOpen. Consider opening an account and access over 700 markets with tight spreads from 0.0 pips and low commissions from $1.50 per lot.
This article represents the opinion of the Companies operating under the FXOpen brand only. It is not to be construed as an offer, solicitation, or recommendation with respect to products and services provided by the Companies operating under the FXOpen brand, nor is it to be considered financial advice.

WTI: Will oil return to the upward trajectory?!WTI oil is located between EMA200 and EMA50 on the 4-hour timeframe and is moving in its ascending channel. In case of a downward correction towards the demand zone, the next opportunity to buy oil with a suitable reward for risk will be provided to us. A valid breakdown of the drawn downtrend line and preservation of the channel will pave the way for oil to reach the drawn ranges.
Under the pressure of imminent sanctions planned by the Trump administration and the debts Iran now owes to China, the country has begun offloading crude oil that had been stored in Chinese warehouses for years. This oil, shipped to China between 2018 and 2019 but not officially declared in Chinese customs records, was kept in isolated, pre-designated storage facilities. With storage costs reaching hundreds of millions of dollars, Iran is now obligated to cover these expenses. So far, 5.4 million barrels of oil have been removed from a Chinese port, transported by a total of four tankers.
According to a Bloomberg report, OPEC+ is likely to maintain its current supply policy in its meeting next week. This decision contradicts the request of U.S. President Donald Trump, who has urged oil producers to increase output to lower prices and exert more economic pressure on Russia to end the war in Ukraine. Under the current plan, oil supply restrictions will remain in place for this quarter and will gradually ease starting in April.
Donald Trump plans to sign an executive order to initiate the development of a “next-generation” missile defense system in the United States. This system, modeled after Israel’s Iron Dome, is designed to protect the U.S. from ballistic missile attacks, hypersonic missiles, advanced cruise missiles, and other modern aerial threats.
According to the released information, the executive order aims to establish an advanced space-based missile defense system capable of detecting and neutralizing missiles launched toward the U.S. Conceptually, this resembles Israel’s Iron Dome, which has been used for years to intercept and destroy rockets fired from Gaza. The U.S.government has already invested billions of dollars in developing Israel’s Iron Dome, and the American military possesses its own missile defense systems.
The order describes missile attacks as a “catastrophic threat,” but no details have been provided regarding the project’s costs or timeline. Developing a comprehensive missile defense system for a country as geographically vast as the U.S. is a highly complex and costly endeavor. Additionally, the emergence of next-generation missile threats, such as hypersonic missiles that travel at extremely high speeds, presents significant technical challenges. This indicates that the project will require substantial investment and time for completion.

Trump's pressure on OPEC prompted the drop in USOIL prices.
President Trump's steadfast dedication to lowering oil prices is driving the decline in WTI prices. During the WEF in Davos, Switzerland, he made it clear that he would demand Saudi Arabia and OPEC to reduce the price of crude oil. He boldly stated that lower oil prices could potentially lead to an end to the war in Ukraine. According to CSIS, Trump's call for reduced oil prices is a positive move for consumers and businesses but it is the one that the US oil industry will regard with caution.
Failing to rise above EMA21, USOIL shows consolidation near 73.40. The price remains within the descending channel, and both EMAs have widened apart, indicating a potential continuation of the bearish momentum. If USOIL fails to breach EMA21, the price may fall further to the support at 71.50, where the channel’s lower bound coincides. Conversely, if USOIL breaches above EMA21 and the channel’s upper bound, the price could gain upward momentum to 74.50

CRUDE OIL Will Go UP! Buy!
Hello,Traders!
CRUDE OIL made a massive
10% bearish correction but
Then it hit a horizontal support
Of 72.89$ and a bullish rebound
Is already happening so we
Are bullish biased and we will
Be expecting a further move up
Buy!
Comment and subscribe to help us grow!
Check out other forecasts below too!

USOIL Maintains a Persistent Bearish BiasThe WTI barrel has experienced a loss of over 8% since mid-January, mainly because the peace agreement between Israel and Palestine has come into effect without issues, and Trump’s ongoing comments about increased production in the United States have contributed to the bearish sentiment. Both factors have led the market to expect growing supply and weak demand prospects, which has inevitably sustained bearish pressure on crude oil prices.
Lack of Clear Trend:
Recent movements have caused the barrel to accumulate a prolonged bearish correction, casting doubt on the bullish trendline established since December 2024. Now, the price faces a key support zone, which could serve as a decision point for a potential sustained bearish trend.
ADX:
The ADX line has consistently oscillated above the neutral level of 20. However, recent movements show a current downward slope, indicating a lack of clear trend in the market. If the ADX line continues to decline, the current bearish movement may struggle to break through the existing support zone.
MACD:
Both MACD lines are consistently declining, and the histogram remains below the neutral line at 0. This indicates that bearish pressure continues to dominate in the short term. However, recent histogram readings have not reached progressively lower levels, suggesting indecision in the current bearish movement, which could allow for short-term upward corrections.
Key Levels:
$72: The current support level on the chart. Oscillations below this level could further increase bearish pressure and pave the way for a more defined downward trend.
$78: The last high reached by the barrel of crude oil. Bullish oscillations that revisit this level could revive the short-term upward trend that was forming since December.
By Julian Pineda, CFA - Market Analyst
