CL-OIL trade ideas

CRUDE OIL WILL GROW|LONG|
✅CRUDE OIL went down to retest a horizontal support of 73.00$
Which makes me locally bullish biased
And I think that a move up
From the level is to be expected
Towards the target above at 75.00$
LONG🚀
✅Like and subscribe to never miss a new idea!✅

USOIL WANT TO BUY 📢 Trading Alert: USOIL ANALYSIS 📊
📉 Support Touched: $72.70
📈 Buy Confirmed Above: $73.00
🎯 Target Levels:
Level 1: $75.30
Level 2: $78.50
Level 3: $80.00
⏳ Indicator: EMA50
⏱ Time Frame: 1H
💡 Stay vigilant and manage your risks! 🚀


WTI Oil - Potential Long Opportunity61.8 retracement after bullish run after consolidation for weeks
72.735 strong resistance turned support
4H 200 ema
If price pushes past 61.8 after bounce looking at 78.6% and then 100% and then 127.2%

USOIL LONG!!I saw an opportunity on oil price rejecting from the 15 MIN BISI and taking out the London low there's probabilities price will continue expanding higher to the NDOL, that's my take xoxo.

USOIL MARKERT ANALYSIS AND PRICE PREDICTION USOIL, is selling now, its on a journey downward to mitigate an order block at an institutional renegotiation zone. After mitigation, price will consolidate there and decision will be taken in favor of the Bull. Price Will break a "W" structure and will retrace a bit to give the Bulls a perfect Entry at 61:8% discount price. Watch out for this moves in few Days to come and go long with it when price reaches the perfect entry position.
Entry, Take Profit and stop loss are clearly marked out on the chats.
GOOD LUCK GUYS!

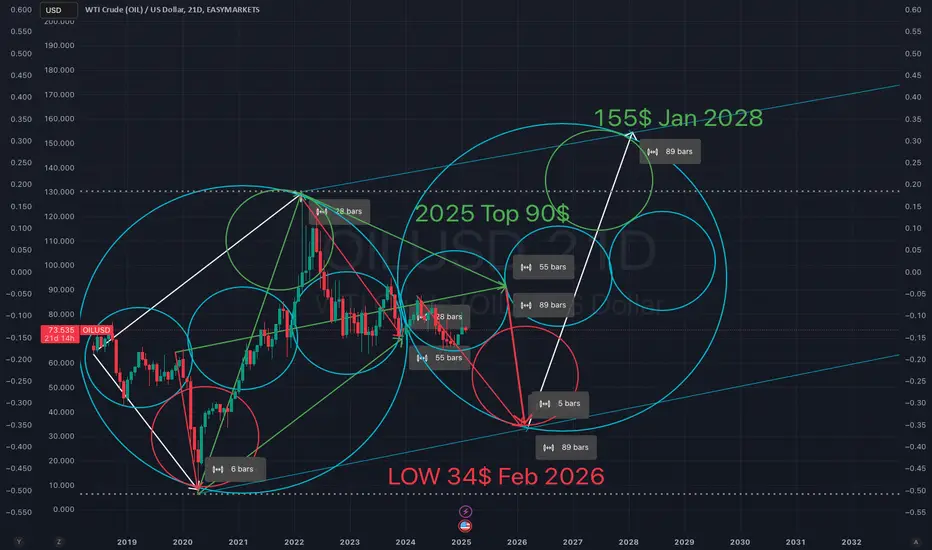
USOIL Market’s DNA – 21DChart , 28, 55, 89, Bars Leading the Way
Not just looking at price—But decoding time itself. Oil moves in a structured, self-repeating time cycle, and now, with the 21-day chart, 28-bar sequences, and Fibonacci cycles, we have the market’s blueprint.
This is beyond trading—this is the hidden time geometry of markets. Let’s break it down. 🧵👇
1️⃣ The 21-Day Chart: Where Time Becomes Visible
📅 The 21-day timeframe is where oil’s cycles reveal their structure.
📊 Every major move follows precise bar counts, proving the market follows timing, not random price action.
🕰️ News reacts to the market, but time controls it first.
This is where we decode the future.
2️⃣ 28 Bars – The Micro-Structure That Sets the Bigger Move
🔵 Every larger trend begins with 28-bar fractals.
🔄 It’s the market’s heartbeat—the foundation of oil’s timing structure.
📊 The energy of 28 builds into 55, and 89 bars, creating the Fibonacci wave.
👉 If the 28-bar structure continues, then the next move is already written.
3️⃣ 28 Bars – The Perfect Symmetry Between Expansions & Corrections
🌀 28 bars mark the equilibrium between cycles.
📈 It’s the tipping point: does oil expand higher or reverse?
🎯 Every major event aligns with a 28-bar cycle, proving that time, not price, dictates direction.
📏 Historical Cycle Confirmations:
✅ COVID Low (2020) → Ukraine War Top (2022) = 28° angle steep rise.
✅ Ukraine War Top (2022) → Dec 2023 Low = 28-bar structured correction.
✅ Next move? The next 28-bar cycle will confirm oil’s next major shift.
👉 If oil respects this, the next major move is already locked in.
4️⃣ 55 & 89 Bars – Fibonacci’s Dominance in Time
🔹 55 bars → Corrective phase, rebalancing the trend.
🔹 89 bars → Defines macro tops & bottoms, marking cycle expansions.
📊 Proven Historical Fibonacci Cycles in Oil:
✅ COVID Crash (2020) → Ukraine War Top (2022) = 55 bars
✅ Ukraine War Top (2022) → Dec 2023 Low = 55 bars
✅ Now heading toward the next 89-bar cycle completion.
📌 This is the natural law of time unfolding in the market.
5️⃣ Where Are We Right Now in the Cycle?
📅 Short-Term:
🔹 We are inside a 28-bar transition phase—this is decision time for oil.
📅 Mid-Term:
🔹 2025 projected top (~90 USD) aligns with the next 89-bar Fibonacci cycle completion.
🔹 2026 projected low (~34 USD) falls perfectly into a 55-bar correction sequence.
📅 Long-Term:
🔹 Final 155-bar macro-cycle → January 2028 marks the next major cycle peak.
👉 We are already inside the structure—only time will reveal the path.
6️⃣ What This Means for Trading: We’re Not Guessing, We’re Seeing
📌 This is bigger than price—it’s the market’s time structure.
📌 If this cycle holds, oil’s movement is already prewritten.
📌 We are not following news; we are following time itself.
🚀 Are we heading toward a 2025 peak and a 2026 drop? What happens after the next 28 bar sequence? Let’s discuss! 👇
WTI - Daily TradingRange ZoneBLACKBULL:WTI is oscillating between two key trend lines, and after hunting liquidity under the last bullish leg, another upward move is possible. This setup presents buy opportunities on lower time frames, and I’ll update this idea accordingly.
Additionally, oil remains within a broader trading range, reacting precisely to the mid-zone, which has previously acted as dynamic support. This level could push prices higher in the short term.
📈 Watch for potential bullish setups and follow for timely updates!

3000 Pips projectionGBPUSD : While there’s potential for a bullish continuation, the key condition is for the price to close above 1.2575 on the 4HTF. If this condition isn’t met, the bearish bias takes precedence, with a projection of over 200 pips to the downside before confirmation.
XAUUSD : Stay alert to the two potential scenarios previously outlined. Prepare for a significant market swing as price action unfolds.
USOIL : Anticipate a major market movement, with price expected to hit the 71.35 zone. If the stated conditions align, this could trigger a possible 1000-pip swing to the upside.
EURAUD : A clear structural shift is evident. We’ll wait for a decisive confirmation before targeting a 500-pip move to the upside, contingent on meeting the specified conditions.
Don't see what you'd love to see, only see what the market shows you.
Patience is the Way!Ieios.

Oil Market Update: Bearish Trend ContinuesOil Market Update: Bearish Trend Continues
The oil market is currently facing a bearish trend, with prices experiencing a significant decline. The highest price was recorded on January 15th at $80.73 per barrel, and it has since dropped to $74.50 per barrel, representing a depreciation of nearly 8.5% over about 9 days
Technical Analysis:
Technically, the price decline has broken several support levels, confirming the bearish trend. The next potential targets for the oil price are $73.00 and $71.30, which are critical support levels.
Key Factor Driving the Decline:
U.S. President Donald Trump demanded OPEC lower oil prices and the world drop interest rates in a speech to global business and political leaders and warned them they will face tariffs if they make their products anywhere but the U.S.
You may find more details in the chart!
Thank you and Good Luck!
❤️PS: Please support with a like or comment if you find this analysis useful for your trading day❤️

USOIL have barrels for you!Pretty obvious PoC line would attract that like bees are to for honey!!!! Struggling in the orange box is what you would want for a breakout!!!

USOIL H4 I Bullish Bounce Based on the H4 chart, the price is approaching our buy entry level at 72.698, which aligns with a strong overlap support level. This level is expected to act as a potential reversal point in the bullish setup.
Our take profit is set at 74.884,an overlap resistance zone where price may encounter selling pressure.
The stop loss is placed at 71.193, below the previous swing low, providing room for price fluctuations while ensuring the bullish setup remains valid.
High Risk Investment Warning
Trading Forex/CFDs on margin carries a high level of risk and may not be suitable for all investors. Leverage can work against you.
Stratos Markets Limited (fxcm.com/uk):
CFDs are complex instruments and come with a high risk of losing money rapidly due to leverage. 63% of retail investor accounts lose money when trading CFDs with this provider. You should consider whether you understand how CFDs work and whether you can afford to take the high risk of losing your money.
Stratos Europe Ltd (fxcm.com/eu):
CFDs are complex instruments and come with a high risk of losing money rapidly due to leverage. 63% of retail investor accounts lose money when trading CFDs with this provider. You should consider whether you understand how CFDs work and whether you can afford to take the high risk of losing your money.
Stratos Trading Pty. Limited (fxcm.com/au):
Trading FX/CFDs carries significant risks. FXCM AU (AFSL 309763), please read the Financial Services Guide, Product Disclosure Statement, Target Market Determination and Terms of Business at fxcm.com/au
Stratos Global LLC (fxcm.com/markets):
Losses can exceed deposits.
Please be advised that the information presented on TradingView is provided to FXCM (‘Company’, ‘we’) by a third-party provider (‘TFA Global Pte Ltd’). Please be reminded that you are solely responsible for the trading decisions on your account. There is a very high degree of risk involved in trading. Any information and/or content is intended entirely for research, educational and informational purposes only and does not constitute investment or consultation advice or investment strategy. The information is not tailored to the investment needs of any specific person and therefore does not involve a consideration of any of the investment objectives, financial situation or needs of any viewer that may receive it. Kindly also note that past performance is not a reliable indicator of future results. Actual results may differ materially from those anticipated in forward-looking or past performance statements. We assume no liability as to the accuracy or completeness of any of the information and/or content provided herein and the Company cannot be held responsible for any omission, mistake nor for any loss or damage including without limitation to any loss of profit which may arise from reliance on any information supplied by TFA Global Pte Ltd.
The speaker(s) is neither an employee, agent nor representative of FXCM and is therefore acting independently. The opinions given are their own, constitute general market commentary, and do not constitute the opinion or advice of FXCM or any form of personal or investment advice. FXCM neither endorses nor guarantees offerings of third-party speakers, nor is FXCM responsible for the content, veracity or opinions of third-party speakers, presenters or participants.

Covid based crash scenario on oilA possible covid crash scenario on oil as we look at it going into negative figures. A break of the yearly low confirms covid pandemic will hit. High supply of oil with no demand (lockdown) oil prices fall

Retest 74OIL Retest at as u can see in th drwaings ,BUT 88 is Near, cup and handles formin....
Waht do you think Guys??

XTIUSD MARKET FORECAST BEARSH TRADE🔥 Big Breakdown XTI/USD Trading Setup
📌 Entry Level: 76.30
📉 Target Levels:
Take piont 75.20
Take piont 74.30
Take piont 73.50
Take piont 72.50
⚙️ Stop Loss Adjustment:
Once the market reaches Target 1 (75.20), move the stop loss to the Entry Point (76.30) to secure the trade.
📈 Indicator Used: EMA50
🚨 Strategy Reminder:
Stick to the plan and manage your risk wisely. Let the market work in your favor.

USOIL- XTI - Buy IdeaLook to Buy OIL as it retests an important support turned resistance level. EMA 89 is also supporting at Daily time frame. Other fundamental factors like seasonality, the US economy, and institutional data also support buying the Oil.

1W ChoCh Sell Just Beginning1W ChoCh Sell Just Beginning last low $0 in 2020 Possible Take profit it's make 3 Waves Higher Low But have strong Support in Blue order box It's need Clearly.

US OIL READY TO SELL.. WEEKLY ANALYSISHello everyone here is my Todays US OIL Market Analysis Please check and share your opinions in the comments section thanks
today on Monday 27th January 2025 US OIL Currently trading at (74.50)with a key pivot point (76.10).I am supporting the (Sell Side) today as the price remains below key levels.
The markets next movement depends on its behavior around this critical level.
Bearish Scenario: If US OIL remains below the pivot point (76.10) it will bring US OIL towards the following targets:
Target 1: 73.00
Target 2: 71.00
Target 3: 69.00
Support: 68.00
Bullish Scenario: If US OIL breaks the pivot point (76.10) and close a 4H candle above it, this could open the path for further upside movement potentially
Resistance: Supply zone: 77.00/ 78.00
Long term Resistance: 79.00/ 80.00
Key Levels:
Pivot Point: 76.00
Target 1: 73.00
Target 2: 71.00
Target 3: 69.00
Support: 68.00
Resistance: 75.00
Supply zone: 76.00
Long term Resistance 79.00/80.00
Trend Outlook
Bearish Trend: Below 75.00 and 76.00
Bullish Trend: Above 76.00/77.00
a confirmed close in a 4H candle
If you like my analysis dont forget to like follow. and comment Thanks

USOIL - Bearish Head and Shoulders Hello Traders !
The USOIL failed to break the resistance level (80.148 - 79.652).
The price formed a head and shoulders pattern.
Currently, The neckline is broken !
So, I expect a bearish move📉
________________
TARGET: 74.450🎯

US OILUS OIL is making a falling triangle pattern on the weekly timeframe. The new administration in US is skeptical on high prices of oil, it is assumed that the US will want lower prices of oil in order to boost up economic activity amidst cease fire in the middle east region. Having all this is consideration and reviewing the pattern on the chart we can expect the oil prices to fall drastically once it breaks down the triangle. As the analysis is on weekly timeframe, it might take a few months to achieve the levels of 45 to 50. On the other hand if there is such a development that can shoot up the oil prices than this analysis should be considered null and void. As you all may know oil prices is one of the few commodities that is driven by news and events rather than pure charts analysis.

President Trump urged OPEC to increase oil productionPresident Trump urged OPEC to increase oil production and lower prices in order to help end the war in Ukraine, threatening tariffs and sanctions if a deal is not reached. Oil prices fell in response to Trump's statements, with Brent crude dropping to $77.94 per barrel and West Texas Intermediate falling to $74.11 per barrel. OPEC has not officially responded to Trump's calls for increased production, and the market remains uncertain about potential outcomes. In addition, the reversal of U.S plans to impose sanctions on Colombia eased concerns about potential disruptions to oil supply from the South American nation. Also the impact of sanctions on Russian oil production may be limited, but some risk premium is justified due to the potential leverage in future negotiations.
On the technical side, the price of crude oil has found sufficient resistance on the upper band of the Bollinger bands and has since entered an aggressive bearish trend which seems to be slowing down around the $74 area. The faster 50-day moving average is still above the slower 100-day indicating that the overall bullish momentum is still in effect despite the rapid decline. On the other hand, the Stochastic oscillator is in extreme oversold levels hinting that there might probably be a bullish correction in the upcoming sessions. If this scenario plays out then the next major technical resistance area might be seen around $76 which is the 23.6% of the daily Fibonacci retracement level.

WTI Under PressureThe effects of the ceasefire in the Middle East are now beginning to be reflected in the price of WTI.
We currently expect the rally of recent weeks to be largely reversed and assume that the WTI price will approach the USD 73.30 mark.
