WTI Crude Oil (USOIL) Daily Chart AnalysisCurrent Price: $71.16 (-2.70%)
Timeframe: Daily (1D)
1. Trend Analysis (Bearish Bias)
The price is in a downtrend, as shown by the descending green trendline.
Lower highs and lower lows indicate continued bearish momentum.
The price recently rejected the upper trendline, reinforcing the downtrend.
2. Key Support and Resistance Levels
Resistance Zone: $72.50 - $73.00 (Previous structure resistance).
Minor Support: Around $70.00.
Major Support Zone: $65.00 - $66.00 (Highlighted pink area).
3. Price Action & Market Structure
The recent price action shows rejection from resistance and a bearish engulfing candle, signaling more downside pressure.
A break below $70.00 could confirm further selling toward the $65.00-$66.00 support.
If the price bounces at $65.00, it could trigger a reversal or consolidation.
4. Trading Strategy
Bearish Setup:
Short below $70.00 with a target of $65.50-$66.00.
Stop-loss around $72.50 (previous resistance).
Bullish Reversal:
If price breaks above $73.00, consider a long position with a target of $75.00-$77.00.
Conclusion
The market is in a clear downtrend, and the price is approaching a key support area. A breakdown below $70.00 could lead to further downside, while a strong bounce from $65.00 may provide a bullish reversal opportunity.
Would you like additional indicators like RSI, MACD, or volume analysis?
CL-OIL trade ideas

USOIL 1H Analysis: Bullish Breakout or Reversal?📊 WTI Crude Oil (USOIL) 1H Chart Analysis 🛢️🚀
Current Market Status
Open: 73.33
High: 73.36
Low: 73.25
Close: 73.26 (-0.11%) 🔻
200 EMA: 72.40
Key Observations
✅ Strong Uptrend 📈
Price is trading above the 200 EMA (red line), indicating bullish momentum.
Recent candles show higher highs and higher lows, confirming upward movement.
✅ Consolidation Zone 📊
Price is currently in a range (orange box), suggesting a potential breakout.
Market is forming small candles, indicating indecision before a bigger move.
✅ Projected Breakout 🚀
The chart shows an anticipated bullish breakout above $74.00 - $74.85 target area (gray box).
If the price breaks above resistance, it may rally towards the next psychological level $75.00+.
❌ Risk Zone (Stop Loss Area) ⚠️
Support zone (bottom of the orange box) at $72.78 - $73.15.
If price breaks below this level, a bearish reversal could happen.
Trading Outlook
💡 Bullish Bias 📈: Look for a breakout above $73.50 - $74.00 for a long entry.
⚠️ Bearish Reversal Risk: A break below $72.78 may invalidate the bullish setup.
🔥 Potential Move:
🚀 Upside Target: $74.85 - $75.00+
🛑 Stop Loss: Below $72.78

USOIL - near resistance? what's next??#USOIL... market just placed his current resistance high so keep close that region that is around 73.40 to 74.00
of market holds that region in that case we can see a drop from here.
otherwise not ..
good luck
trade wisely

USOIL ANALYSISWaiting for certain confirmations but my overall bias is bullish for USOIL. Looking for buys between 2 zones>> 72.00 and 71.500. Lets wait and see.

USOIL Trend Analysis!Amid upside risks from Trump’s tariffs and downside pressures from policies favoring price cuts and overproduction, oil remains highly volatile, trading above key support levels while maintaining its broader downward trajectory from 2022 to 2025.
Critical support zones to monitor include $69.5, $66, and $64, which have acted as key rebound areas since December 2021. A firm close below the $64 support could accelerate losses toward the psychological $60 level and $55, aligning with the 0.618 Fibonacci retracement of the 2020–2022 uptrend.
On the upside, the upper boundary of the established channel serves as strong resistance near $78. A sustained close above $80 would signal a potential shift in sentiment, eyeing $84, $89, and $95, which align with waves A, C, and E of the triangle pattern, marked by the highs of September 2023, April 2024, and July 2024.
Key events to watch:
OPEC's monthly oil report
Trump’s tariff announcements
Fed Chair Powell’s testimony
U.S. CPI report

Bullish bounce off pullback support?WTI Oil (XTI/USD) is falling towards the pivot which has been identified as a pullback support and could bounce to the 1st resistance which acts as a pullback resistance.
Risk Warning:
Trading Forex and CFDs carries a high level of risk to your capital and you should only trade with money you can afford to lose. Trading Forex and CFDs may not be suitable for all investors, so please ensure that you fully understand the risks involved and seek independent advice if necessary.
Disclaimer:
The above opinions given constitute general market commentary, and do not constitute the opinion or advice of IC Markets or any form of personal or investment advice.
Any opinions, news, research, analyses, prices, other information, or links to third-party sites contained on this website are provided on an "as-is" basis, are intended only to be informative, is not an advice nor a recommendation, nor research, or a record of our trading prices, or an offer of, or solicitation for a transaction in any financial instrument and thus should not be treated as such. The information provided does not involve any specific investment objectives, financial situation and needs of any specific person who may receive it. Please be aware, that past performance is not a reliable indicator of future performance and/or results. Past Performance or Forward-looking scenarios based upon the reasonable beliefs of the third-party provider are not a guarantee of future performance. Actual results may differ materially from those anticipated in forward-looking or past performance statements. IC Markets makes no representation or warranty and assumes no liability as to the accuracy or completeness of the information provided, nor any loss arising from any investment based on a recommendation, forecast or any information supplied by any third-party.

Oil weekly forecast with key buy and sell levels Oil on the weekly with key levels and buy and sell suggestions.

USOIL Set To Grow! BUY!
My dear followers,
This is my opinion on the USOIL next move:
The asset is approaching an important pivot point 70.97
Bias - Bullish
Safe Stop Loss - 69.61
Technical Indicators: Supper Trend generates a clear long signal while Pivot Point HL is currently determining the overall Bullish trend of the market.
Goal - 73.22
About Used Indicators:
For more efficient signals, super-trend is used in combination with other indicators like Pivot Points.
———————————
WISH YOU ALL LUCK

WTIC Oil moving into recession territoryOil is the first thing that is reduced in demand when economies weaken

Supply and Demand DynamicsIncreases in U.S. crude oil production: The U.S. has been a significant contributor to global oil supply, and continued production growth can put downward pressure on prices.

WTI on high time frame
"Hello traders, focusing on WTI, the price has hit the daily order block at $73.5 and experienced a strong rejection on the 4-hour chart. The price has broken below the trend line and is indicating potential downward movement during the Asian session today. It's important to note that there is a CPI news release during the U.S. session today, so exercise caution in your trading decisions."
If you have any specific questions or need further assistance with your message, feel free to ask!

Oil - see if my plan worksHello traders, please feel free to share your trading ideas, and please give a Boost if you agree with my trading plan. My trading strategy is Price Action, which is the simplest strategy of trading on the price movement. A key part of my discipline is Stop Loss set when opening a trading position, which ensures every trading is risk managed. My 1 to 1 trading training is available, please message. Trade well and good luck!

WTI Crude retest of 13th February swing lowThe WTI Crude (US Light Crude) price action sentiment appears bearish, supported by the longer-term prevailing downtrend.
The key trading level is at 7200, 20th February swing low level. An oversold rally from the current levels and a bearish rejection from the 7200 level could target the downside support at 6964 followed by 6880 and 6830 levels over the longer timeframe.
Alternatively, a confirmed breakout above 7200 resistance and a daily close above that level would negate the bearish outlook opening the way for further rallies higher and a retest of 7250 resistance followed by 7316 levels.
This communication is for informational purposes only and should not be viewed as any form of recommendation as to a particular course of action or as investment advice. It is not intended as an offer or solicitation for the purchase or sale of any financial instrument or as an official confirmation of any transaction. Opinions, estimates and assumptions expressed herein are made as of the date of this communication and are subject to change without notice. This communication has been prepared based upon information, including market prices, data and other information, believed to be reliable; however, Trade Nation does not warrant its completeness or accuracy. All market prices and market data contained in or attached to this communication are indicative and subject to change without notice.

Oil Reversal in Sight? Technical Analysis🚀 Oil (XTI-USD) Reversal in Sight? Technical Analysis 📈
On the 4H chart, oil is holding above the 70.00 support level and attempting to break 71.20. If bulls manage to secure this level, we could see a move toward the local high of 73.10.
Technical signals supporting growth:
✅ RSI and Momentum divergence on 4H
✅ Attempt to break above the Alligator’s jaws on 1H
✅ Possible corrective move after the recent decline

USOILUSOIL is in bullish trend.
Storngly bullish trend potentially printing HH and HL.
Alligator also indicates trend will go up further.
We buy at CMP.

After a new base formed in December, a new channel has formedSeeing how this move plays out.
A base is created in December 2024.
Price falling below $70 affected the commodity and a new base price formed.
The markets are trying to recover from a long period of low income and low margins. We have started a new cycle.

USDWTI Technical Analysis.When the USDWTI weekly chart is examined; It is observed that the price movements continue in a triangle formation. It is evaluated that the USDWTI price can target the 107.00 level in price movements above the 75.95 level, but it is evaluated that it can retreat to the 34.57 level in price movements below the 65.47 level.

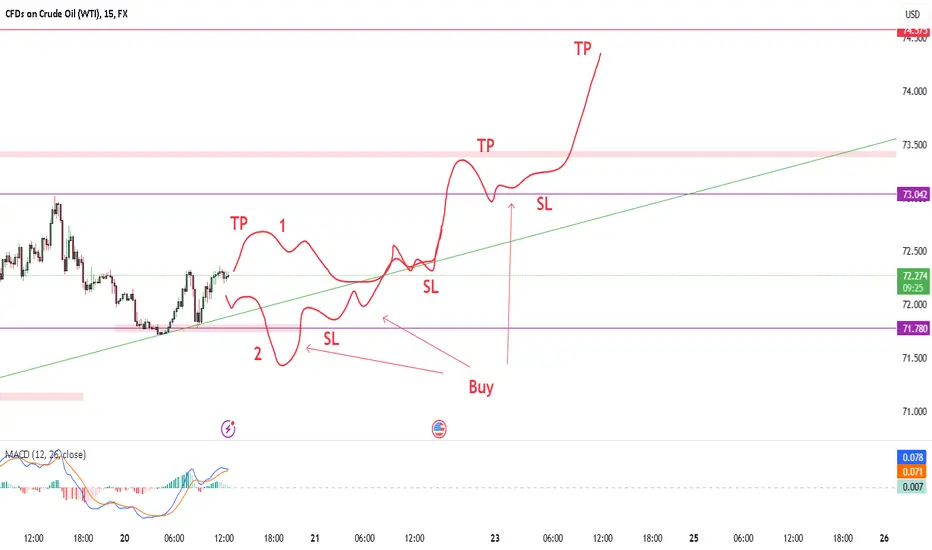
Oil - 2 possible buy opportunities Oil - 2 possible buy opportunities. Let's see how it works, always set SL.
WTI Crude Oil: Range-Bound Between Critical LevelsLooking at the H1 timeframe for WTI Crude Oil, we're observing a defined range structure:
Market Structure:
Trading within established range (70.17-73.18)
Recent rejection from 72.50 resistance
Moving averages clustered around current price
Multiple tests of both range boundaries
Key Levels:
Upper Range: 73.178
Current Price: ~72.23
Lower Range: 70.168
Immediate Support: 71.81
Technical Indicators:
Volume showing decreased activity in recent consolidation
Momentum indicators in neutral territory
Price oscillating between moving averages
No clear directional bias in indicators
Trading Considerations:
Respect range boundaries for entries
Watch for breakout confirmation with volume
Key resistance at 73.17 needs clear break for upside
Support at 70.17 crucial for maintaining range
BIAS: NEUTRAL
Clear range-bound conditions
No dominant trend direction
Price centered in trading range
Waiting for range breakout for directional bias

US OIL BULLISH 73Hey there on 1HTF US oil change there ways we now can see at this level we should see a bullish continue will reach next ath record 73 and 73.50
But if the price decline and comes downside and then we should see next support level is
Of US oil from 72 and 71.50 must be bullish candle to our next target 73 and 73.50

USOIL LOOKING BULLISH Check my USOIL analysis according to my personal analysis USOIL Looking Bullish Till my Given targets Which Are 75.00 this is also my Resistance zone for further bullish and 79.65, is my confirm target and Support zone is identified at 70.00 lets see how its works.

US oil for buy.Price was previously consolidating, broke out and retested the previous support zone,with a nice double bottom and a bullish pinbar. We go long.

