WTICOBeautiful trade on oil in which I manually closed for around +6% profit. Will be looking for more potential entries to the downside if presented but there are other pairs on watch.
CL-OIL trade ideas

Oil - Let's see if it worksHello traders, please feel free to share your trading ideas, and please give a Boost if you agree with my trading plan. My trading strategy is Price Action, which is the simplest strategy of trading on the price movement. A key part of my discipline is Stop Loss set when opening a trading position, which ensures every trading is risk managed. My 1 to 1 trading training is available, please message. Trade well and good luck!
Oil price drop as expectedYesterday I told you that the trend line was broken and it could fall.
Since I said it was down 250 pips, it's over a 3% drop.

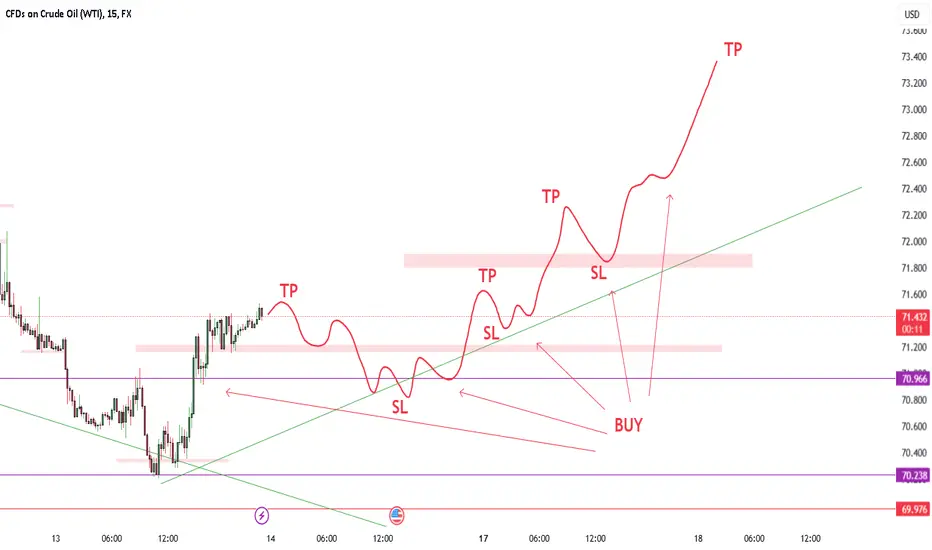
Oil updateNot much to update on oil as its doing exactly what it was setting up for in January.
I have a swing trade from the high, one of my targets should be reached by the end of this month. When price reaches my targets and a long set up appears I will take it.
for now I'm just riding my shorts.
All these levels I marked out in December and broke this move down. Price has been respecting all my levels for a month, I'm locked in. There is a lot of potential for a further decline in oil prices but ill attend to it when it gets there.
I have a lot of trades running that I don't post. There is a lot more detail and understanding of price action that goes into catching these pinpoint entries. my work speaks for itself, its less about profit and more about understanding price action. The profits will follow with good trade management.
let's see how it goes.

Crude remains under pressureCrude oil spent most of Wednesday morning drifting lower, giving back yesterday’s gains and more. Approaching midday, European time, front-month WTI was hovering above $72 per barrel, which, while off over a dollar from Tuesday’s high, was still a couple of dollars above the lows from last week. The daily MACD has flattened out, suggesting a small decline in upside momentum. On top of this, oil is nowhere near back to ‘oversold’ levels which would indicate a buying opportunity. Fundamentally, nothing major has changed this week, other than the unexpectedly-large build in US crude stocks as reported yesterday by the American Petroleum Institute (API). President Trump’s ongoing tariff programme may weigh on economic activity. The US Federal Reserve has said it is in no hurry to cut interest rates further, a point repeated yesterday in Fed Chair Powell’s testimony to the Senate Banking Committee in Washington. Mr Trump’s determination to increase US oil production could also add to supply, which is price-negative. Meanwhile, global demand growth has been falling thanks to China’s severe economic problems.
This communication is for informational purposes only and should not be viewed as any form of recommendation as to a particular course of action or as investment advice. It is not intended as an offer or solicitation for the purchase or sale of any financial instrument or as an official confirmation of any transaction. Opinions, estimates and assumptions expressed herein are made as of the date of this communication and are subject to change without notice. This communication has been prepared based upon information, including market prices, data and other information, believed to be reliable; however, Trade Nation does not warrant its completeness or accuracy. All market prices and market data contained in or attached to this communication are indicative and subject to change without notice.

Against the Trend? We can anticipate a short term crude long.
It is against the trend on 15 mins, but a very short 200-500 points long.

USOIL SHORTUSOIL
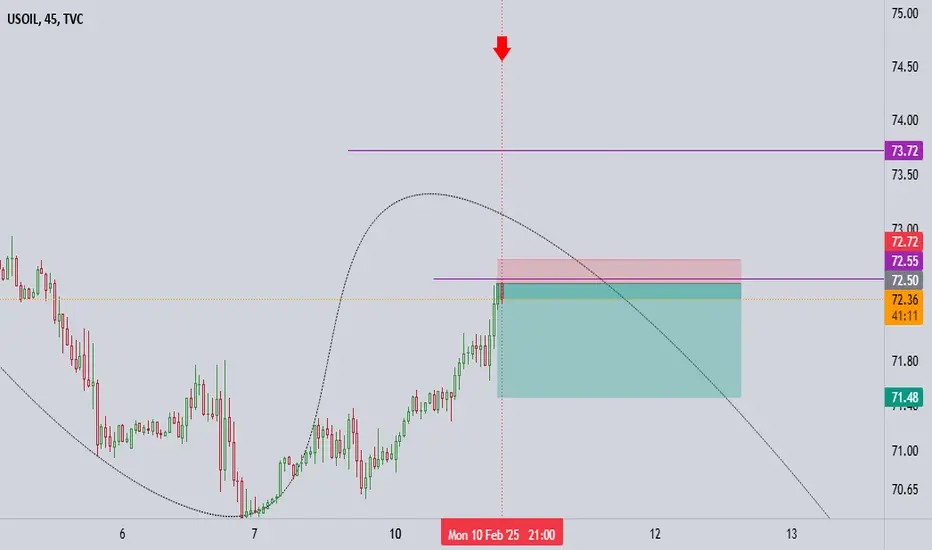
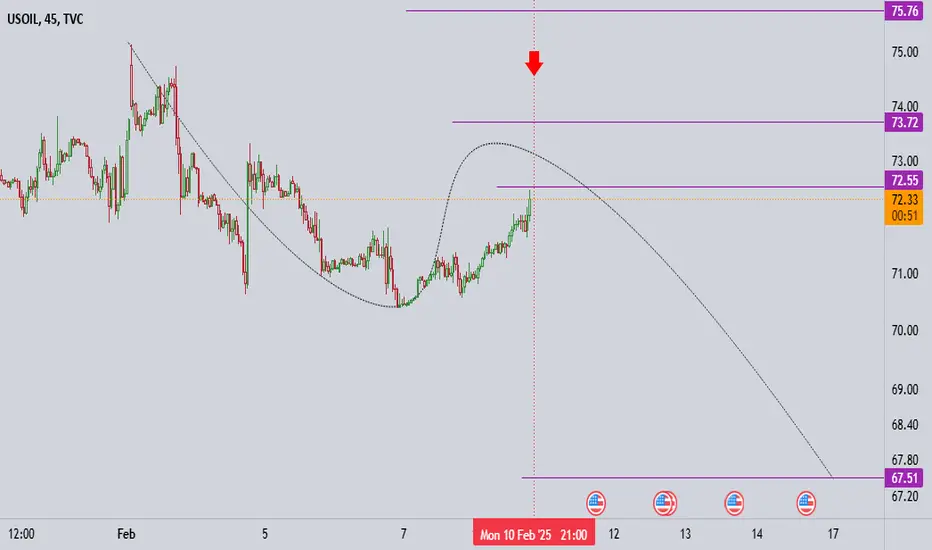
If it reaches 73 next week and shows a bearish structure, it makes sense to short these areas. Empty lows below look nice


USOIL Trade Log - CPI Session
USOIL Short Trade Setup – CPI Session Incoming 🚨
- Instrument: West Texas Oil (USOIL)
- Timeframe: 4-Hour
- Risk: 1% max due to CPI volatility
- Risk-Reward Ratio: Minimum 1:2
Key Technical Analysis:
1. Price has reached a strong resistance zone within the 4H Fair Value Gap (FVG) and is showing signs of rejection.
2. The Kijun Weekly and 4H levels align with this area, increasing the probability of a reversal.
3. Market structure has been bearish overall, with a clear Break of Structure (BOS) and internal liquidity grabs.
CPI Session Volatility Warning:
- With the CPI release incoming, expect aggressive moves and potential liquidity sweeps before directional commitment.
- If price runs liquidity above the FVG and shows strong bearish confirmations, this becomes a high-probability short.
- Manage risk carefully – no need to overexpose with CPI in play.
Trade Plan:
- Entry: Within the 4H FVG upon bearish confirmation.
- Stop Loss: Above the FVG high to avoid CPI wicks.
- Take Profit: At least 1:2 RRR, ideally targeting recent lows.
Stay sharp, play the reaction, and don’t force the trade if the setup invalidates. CPI is where weak hands get rinsed! 💀

11-2 Oil: 11-2 Oil: the down trend seems to be turning. Our signal system still shows a neutral score of 1 which consists of Retail sentiment 1, Seasonality 1, Trend reading 1, GDP -1, Manufacturing PMI 1, Services PMI -1, Retail Sales -1, Inflation 1, Employment Change -1, Unemployment Rate 1, Interest Rates -1. This data gives us a buy option at 74.445

#005 Obvious Trend WTICOUSD Buy 2344SGT 11022025Buy. Not paper trading neither am I using real money. Just for recording purposes. Cant trade real cos account not enough money. only have about 26cents sgd in it.
Not about to open a paper account cos too troublesome.
Going for 1R SL to 0.8R TP.
TP set at the next swing high as seen.
Will come back tomorrow at 9pm to see what happens.
I would like to take trades in the afternoon but now I am working. Hopefully tomorrow I am also going to work. I need to make some plans for tomorrow cos order has been slow recently.
2346SGT 11022025

Oil rises according to morning analysisIn the morning oil analysis, I said the rise could continue, and since this morning, oil prices have risen by more than one percent.

Monitor resistance to enter a long trade.If static resistance is broken, the upward movement continues for oil.

US oil for longPrice was previously ranging, broke out and retested the neckline. Price broke out of the bearish channel wait for a retest of the support zone and we can go long.

WTI CRUDE OIL: Aiming at 82.00 long term.WTI Crude Oil is neutral on its 1D technical outlook (RSI = 48.507, MACD = -0.150, ADX = 34.872) as only today it crossed above the 1D MA50, following a correction since Jan 15th. The prevailing pattern is a Channel Up and we are very close to its bottom. The two bullish waves it had already, peaked after at least a +20% rise. As the 1D RSI is already on the S1 Zone, we anticipate a new bullish wave to start gradually and aim at the top of the Channel Up (TP = 82.00).
## If you like our free content follow our profile to get more daily ideas. ##
## Comments and likes are greatly appreciated. ##


WTI will rise UPThe price has completed wave 2 and is starting wave 3, with targets of 75.50, 77.80, and 80.
invalidation level is 71.

Crude oil is approaching highs and continues to shortReal-time analysis of crude oil market: Crude oil did not fall below the 70 mark for four consecutive trading days last week. This week, the price of crude oil will be determined by the integer mark of 70. Last week, we repeatedly suggested that we should buy at 70.5 and 70 in batches. Now it has reached the 71.5 line, which can only be regarded as the first stop of the decline. The short-term pressure range is in the 71.7-72.1 area. It is expected that there will be no big ups and downs at the beginning of the week. With 71.5 as the radius, 15 points of space will be reserved above and below as the shock range at the beginning of the week.
Today's resistance is focused on the 4-hour upper track 72.1. The upper side looks at the pressure point of 72.5 where the daily MA60 moving average and the 4-hour MA60 moving average overlap. The deviation pressure point focuses on the weekly MA10 moving average 73. For support, first look at the 1-hour middle track 71, followed by the lower track 70.6, and the deviation looks at the 70 integer mark. Overall, the 4-hour Bollinger band lower track and the daily Bollinger band lower track have turned into an upward closing state, and the probability of breaking the low again is not high. Therefore, any retracement this week is an opportunity to try a long-term bullish trend. For the European and American markets, it is recommended to mainly go long on retracements, and go short when encountering resistance at high levels.

SELL USOILBeen a while since I last posted a trade to take.
Here today you can sell on USOIL with the same TP and SL I set on my chart.
Follow for more!

Crude Oil Price Trends: Market Drivers and Further OutlookWTI and Brent Crude: Recent Price Movements
Oil prices faced renewed volatility last week as West Texas Intermediate (WTI) crude settled at $72.84 per barrel, down $2.13 from the previous week, while Brent crude ( TVC:UKOIL ) closed at $77.11 per barrel, reflecting a $1.03 decline over the same period. The price drop follows a mix of macroeconomic concerns, shifts in global supply, and changes in refinery demand, raising questions about the short-term direction of the oil market.
Geopolitical Risks and Supply Disruptions
Oil markets remain highly sensitive to geopolitical events. Rising tensions in the Middle East and uncertainty surrounding Russia’s oil exports continue to shape price expectations. In particular, shipping disruptions in the Red Sea due to recent attacks on vessels have increased transport costs and contributed to supply chain volatility. Additionally, ongoing sanctions on Russian crude are prompting shifts in global trade flows, with some Asian countries increasing purchases while Europe diversifies its energy imports.
Macroeconomic Factors and Demand Outlook
On the macroeconomic front, concerns over U.S. Federal Reserve policy and potential interest rate hikes have weighed on oil prices. A stronger U.S. dollar typically exerts downward pressure on crude oil, making it more expensive for foreign buyers. However, resilient U.S. employment data and steady industrial activity have supported fuel demand, mitigating some of the downward pressure. China's economic recovery also plays a crucial role, with stronger-than-expected factory output and increased crude imports providing support for oil prices.
New York Petroleum Product Prices: Gasoline and Diesel Trends
The New York Harbor spot price ( NYMEX:HO1! ) for conventional gasoline fell to $2.382 per gallon, marking a $0.023 decrease from last week. Meanwhile, No. 2 heating oil prices dropped by $0.083, settling at $2.371 per gallon, which is $0.213 lower than a year ago. Despite these declines, demand for diesel and heating oil remains strong, particularly in colder regions, supporting refined product prices.
Market Outlook: Where Are Oil Prices Headed?
Looking ahead, oil price trends will depend on several factors, including OPEC+ production policy, U.S. refinery utilization rates, and global economic growth. If U.S. crude inventories continue to rise, prices could face further downward pressure. However, if geopolitical risks escalate or demand in Asia strengthens, oil prices may find support in the coming weeks. Investors and traders should closely monitor supply chain developments and central bank policies, as these will be key drivers of price movements in the near term.

Crude Oil Holds Above 70 Support ZoneAmid upside risks from Trump’s tariffs and downside pressures from policies favoring price cuts and overproduction, oil remains highly volatile, trading above key support levels while maintaining its broader downward trajectory from 2022 to 2025.
Critical support zones to monitor include $69.5, $66, and $64, which have acted as key rebound areas since December 2021. A firm close below the $64 support could accelerate losses toward the psychological $60 level and $55, aligning with the 0.618 Fibonacci retracement of the 2020–2022 uptrend.
On the upside, the upper boundary of the established channel serves as strong resistance near $78. A sustained close above $80 would signal a potential shift in sentiment, eyeing $84, $89, and $95, which align with waves A, C, and E of the triangle pattern, marked by the highs of September 2023, April 2024, and July 2024.
Key events to watch:
OPEC's monthly oil report
Trump’s tariff announcements
Fed Chair Powell’s testimony
U.S. CPI report
- Razan Hilal, CMT
