Oil to 40?Is oil in a descending triangle that will send the price in direction of 40$?
I guess the next couple of weeks, and a trendroof will tell.
CLH2025 trade ideas

WTI crude oil Wave Analysis 3 January 2025
- WTI crude oil broke resistance area
- Likely to rise to resistance level 76.00
WTI crude oil rising sharply after the earlier breakout of the resistance area located between the key resistance level 72.25 (top of the previously broken daily Triangle) and the 50% Fibonacci correction of the previous downward impulse 1 from October.
The breakout of the resistance area accelerated the c-wave of the active ABC correction 2 from the middle of November.
WTI crude oil can be expected to rise to the next round resistance level 76.00 (former resistance from October and the target price for the completion of the active wave 2).

OIL Long1)Trend defined. 4h uprend.
2)Contradictory limit entry order. Right at the last point of stall.
3)Default loss. Just below this 15 min range.
4)Default target level. 4.05.
5)Risk <= 3%.
6)Singular trade.
7)Trades placed today <= 5.

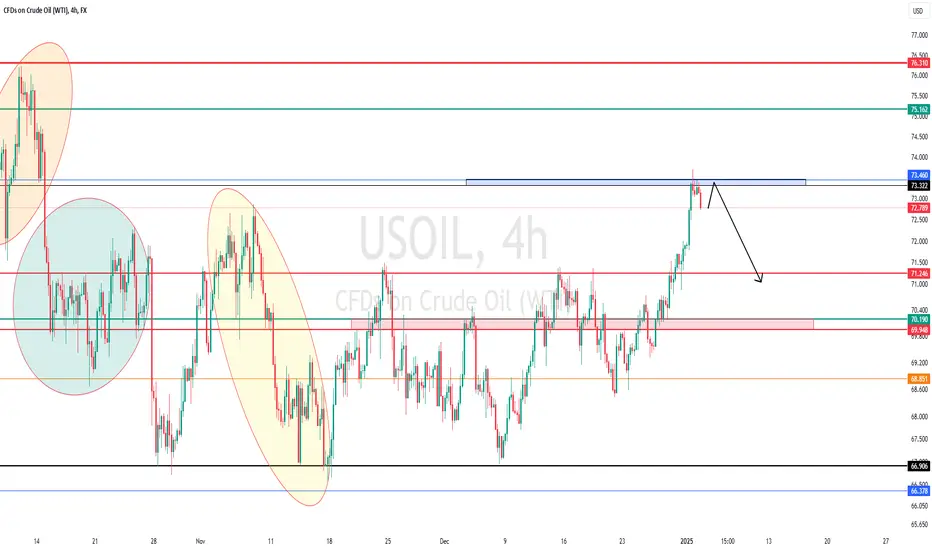
Oil Bulls Go for the Break into Yearly OpenOil prices are threatening a major breakout here after clearing resistance yesterday at the objective 2024 yearly open near 72.14 .
The focus is on todays close with respect to the 61.8% retracement at 73.90 . A daily close above would keep the focus on a possible rally towrads the 78.6% retracement at 75.89 and the October high-close at 77.25 - note the highlighted slope confluence (look for a larger reaction there IF reached).
Initial support back at 72.14 with bullish invalidation now raised to 71.02 .
MB

WTI PRZ on 4H chart
WTI
OIL has price reversal zones
i am waiting for a confirmation to take a position.

Will Iran's Nuclear Ambitions Redefine Global Energy Markets?In a world where geopolitical tensions and energy markets dance an intricate waltz, the latest developments surrounding Iran's nuclear program have emerged as a pivotal factor in global oil dynamics. The Biden administration's deliberation of military options against Iranian atomic facilities has introduced a new variable into the complex equation of international energy markets, forcing investors and analysts to reassess their traditional market models.
The strategic significance of the Middle East's oil infrastructure, particularly the Strait of Hormuz, hangs in delicate balance as diplomatic chess moves unfold. With approximately one-fifth of the world's oil supply flowing through this crucial chokepoint, the stakes extend far beyond regional politics, touching every corner of the global economy. Market participants have begun incorporating these heightened risks into their pricing models, reflecting a new reality where geopolitical considerations carry as much weight as traditional supply and demand metrics.
The energy sector stands at a crossroads where strategic petroleum reserves, investment strategies, and risk management protocols face unprecedented challenges. Portfolio managers and energy traders must navigate this complex landscape while balancing short-term volatility against long-term strategic positioning. As the situation continues to evolve, the global oil market serves as a mirror reflecting the broader implications of international security dynamics, challenging conventional wisdom about energy market fundamentals and forcing a reevaluation of traditional risk assessment models.

USOIL Will Move Lower! Sell!
Here is our detailed technical review for USOIL.
Time Frame: 1D
Current Trend: Bearish
Sentiment: Overbought (based on 7-period RSI)
Forecast: Bearish
The market is approaching a key horizontal level 72.837.
Considering the today's price action, probabilities will be high to see a movement to 68.454.
P.S
We determine oversold/overbought condition with RSI indicator.
When it drops below 30 - the market is considered to be oversold.
When it bounces above 70 - the market is considered to be overbought.
Like and subscribe and comment my ideas if you enjoy them!

USOIL - high placed? holds or not??#USOIL... perfect move as per our analysis and mentioned resistance.
keep close that resistance region guys because if market hold it in that case we can expect a drop from here.
dont be lazy here.
good luck
trade wisely
CRUDE OIL ( WTI )Why did I take this trade. Price respected our trendline channel for sometime on high TFs. However, on the 30 M, we saw a bullish engulfing that changed the manner of the long term trend. Executed trade on 1H and currently in profit

03.01.25 Morning ForecastPairs on Watch -
FX:CADCHF
TVC:USOIL
A short overview of the instruments I am looking at for today, multi-timeframe analysis down to what I will be looking at for an entry. Enjoy!

USOIL Trade SetupHello,
Trend-Based Analysis. Buy the Dips, Sell The Rallies, Also Following the Trend. Let's see where the Price Action takes us, Riding the wave. Potential trade setups based on trend momentum.
Technical analysis based on trend identification and momentum, Looking for high-probability setups within the prevailing trend.
Analyzing the current market trend and potential future price movement. Focusing on risk management and reward-to-risk ratios.
Details is Mentioned in Chart, Read carefully.. .

WTI/USD on daily
"As mentioned in my recent analysis, the price of oil could potentially surpass $75."

Oil Heading Higher in the Short TermOriginally, I thought this move up would be short and target somewhere along the 50 % area of the previous impulse down but it has ended up proving me wrong. Looking at how aggressive the rally has been since Dec 26 we can take an interpretation that wave B/X took the form of a triangle. This allows us to recalculate our likely zone for this move to end at the price of 74.75 which would give us equality in distance travel between waves W and Y, Of course, the price could push past this area, and for that purpose Im considering the absolute point of invalidation for this scenario at 79.10 and granted there is a wide margin from the current price to the indicated protective stop but if the move down gets going there is reason to believe we will go down to the 65 dollar mark and past it, still affording a favorable risk-reward. I have still not taken a position but will update when it looks more favorable to do so.
Happy Trading :)

US OIL WANT BULLISH ZONE AT 71.90HELLO Traders ! whats you think abou WTI OIL us oil want buy direction at 71.90 and its technical target is 73.50

Oil shortOil has been ranging since September, this week it broke out to the up side. Price has just reached one of my sell zones.
I have been aggressively trying to short oil and I was stopped out both times.
There is enormous move to the down side on oil and I want in. The first signs of reversal are there, we just need price to develop and violate structures on the lower timeframes.

WTI Light Crude Oil (18H) – Technical Analysis1️⃣ Bullish Triangle Pattern
The chart forms a bullish triangle, with higher lows and a descending trendline. This indicates potential accumulation before an upward breakout.
2️⃣ Strong Support Level
The $68-$69 support zone, established in September, has held firm, showing strong buying interest and rejecting further downside.
3️⃣ Broken Resistance Line
The descending trendline has been broken, signaling a shift in momentum toward buyers.
4️⃣ Potential Uprise
The breakout suggests upside potential toward:
🟢 Target 1- $71.23
🟢 Target 2-$73.00
🟢 Target 3-$77.54
Got questions? Let me know!

Crude oil for buy.Price brokeout of the consolidation, wait for retest or a pullback with a bullish candlestick pattern.

"USOIL Alert!"USOIL Alert!
Pattern confirmed: Accumulation, Manipulation, Distribution
Get ready for a BIG DROP!
Instant Sell Recommendation: 7.83 RR
Don't miss this trading opportunity!

Oil UpdateOil Update
This is the bottom and this is the top for today
We may see more upside but if the red line is breached and in the worst case we may see more downside to the green line area
Oil on the long term as an investment is the $81 area
You can be an investor or a speculator
Exception

CL - Crude Oil confirmation and unwritten potentialHi guys, we are following up with probably one of our favourite assets to participate in. You guessed it right it's CL. Currently the Crude Oil is sitting in a very specific range , which has been traded since late August , until the end of October where we saw a big spike and got out of boundaries due to the escalation in Iran and Israel, of which after the cooling off we got back into the range of 73.00 as a strong resistance line , and 67.00 as a strong support. This range has made a lot of traders stay away from CL, but I do believe that there is potential to be caught.
Current analysis and entry :
Entry today at a level of 68.90 , with two targets of take profit :
Target 1: 71.52
Target 2: 72.92
Now this is the bold move if you don't want to miss out on the current opportunity and your Risk Tolerance is on the higher end.
If you want to be more protective and your Risk Tolerance is on the lower side, you can get a Pending Order at the level of 66.61 , and then enter 3 follow up targets
Target 1: 68.50
Target 2: 71.05
Target 3: 72.45
P.S. My current opinion is to go with a current entry because the missing out of opportunity is too high ,hence we are seeing more tensions in Israel&Gaza conflict, additionally the tightening of the situation in Ukraine&Russia adds more Fundamental Value, towards a swing on an upside of the Crude Oil.
Do let me know in the comments below or in my community what is your thought process and opinion about our favourite Black Gold!
Happy Trading!

WTI OIL Break-out or rejection strategy.WTI Oil (USOIL) gave us an excellent buy signal last time (December 27, see chart below) that produced a Bullish Leg straight to our $72.80 Target:
The price is right now above Resistance 2 and almost at the top (Higher Highs trend-line) of the Channel Up. Having completed a +6.65% rise (which was the previous Bullish Leg), it is now highly likely to start seeing a reversal to a Bearish Leg. Especially since the 1D RSI is testing the October 07 2024 High.
As long the price gets rejected below the top of the Channel Up, we will be bearish, targeting $70.50 (above the 0.618 Fib and the 1D MA50). If the price breaks and closes a 1D candle above the Channel Up, we will take the small loss and switch to a buy, targeting the 1D MA200 (orange trend-line) at $75.15.
-------------------------------------------------------------------------------
** Please LIKE 👍, FOLLOW ✅, SHARE 🙌 and COMMENT ✍ if you enjoy this idea! Also share your ideas and charts in the comments section below! This is best way to keep it relevant, support us, keep the content here free and allow the idea to reach as many people as possible. **
-------------------------------------------------------------------------------
💸💸💸💸💸💸
👇 👇 👇 👇 👇 👇

Crude oil - breaking out at last?Asian Pacific stock indices were mixed overnight, with outsized losses across Chinese indices. This followed the release of another disappointing Manufacturing PMI, even though the Services sector continues to show expansion at a better-than-expected rate. It was a similar situation across Europe which had to deal with a dismal set of Manufacturing PMIs. But it’s a cheerier picture for US stock index futures which are noticeably stronger in early trade. Tech stocks are firmer and bond yields are a tad softer, although the 10-year Treasury yield remains above 4.50%. Investors appear to be taking advantage of last month’s pullback across the ‘Magnificent Seven’ to buy in at (slightly) cheaper levels. The question for the next few weeks seems to be whether the recent pickup in bond yields is due to concerns of future inflationary pressures, fanned by Trump’s tariff threats, or for the more benign expectation of stronger economic growth ahead.
The US Dollar Index is at a fresh 25-month high, trading around 108.50, and precious metals are managing to rally. But it is the energy sector that may now be poised for a trend change. Front-month WTI is trading within cents of levels last seen in mid-October. Prices have made steady upside progress over the past month and it looks as if crude could be about to break out of its long term downtrend. It’s too early sound the all-clear. Much will depend on the size and shape of the next pullback. But the daily MACD has crossed above the ‘neutral’ line suggesting that momentum is now to the upside.

