NQ Power Range Report with FIB Ext - 5/2/2025 SessionCME_MINI:NQM2025
- PR High: 19797.25
- PR Low: 19749.50
- NZ Spread: 106.75
Key scheduled economic events:
08:30 | Average Hourly Earnings
Nonfarm Payrolls
Unemployment Rate
Advertising rotation short off 20100
- Holding auction inside previous session range
Session Open Stats (As of 12:55 AM 5/2)
- Session Open ATR: 647.21
- Volume: 47K
- Open Int: 250K
- Trend Grade: Bear
- From BA ATH: -11.8% (Rounded)
Key Levels (Rounded - Think of these as ranges)
- Long: 20954
- Mid: 19246
- Short: 16963
Keep in mind this is not speculation or a prediction. Only a report of the Power Range with Fib extensions for target hunting. Do your DD! You determine your risk tolerance. You are fully capable of making your own decisions.
BA: Back Adjusted
BuZ/BeZ: Bull Zone / Bear Zone
NZ: Neutral Zone
NQU2014 trade ideas

NQ Short (05-05-25)April 21 Post is at upper Target, looking for drop here after the most likely Monday lift to stall out. NAZ is still inside the Insignificant Range of Noise.
4/21/25 Chart

Bullish till March 26 High but open for retrace.We are at a daily -BPR at the moment. All daily candles have been bullish so far since April 22. The whole sentiment behind this has been the 90 day tariff pause.
There definitely is a mix of fundamental and technical reasons for both bullish and bearish bias once we achieve this target.
For this week, I would look for a long entry only if NQ retraces lower first. Otherwise would have to just watch it do its thing. Once we hit the March 26 High, I am very open for NQ to go to All time high again because that is what it historically does but I am also completely open for it to start dumping to monthly lows because it seems that the sell-side was not hit and the higher lows made on the 4H chart seem to be very low resistance targets.
Not a good time to marry a bias.

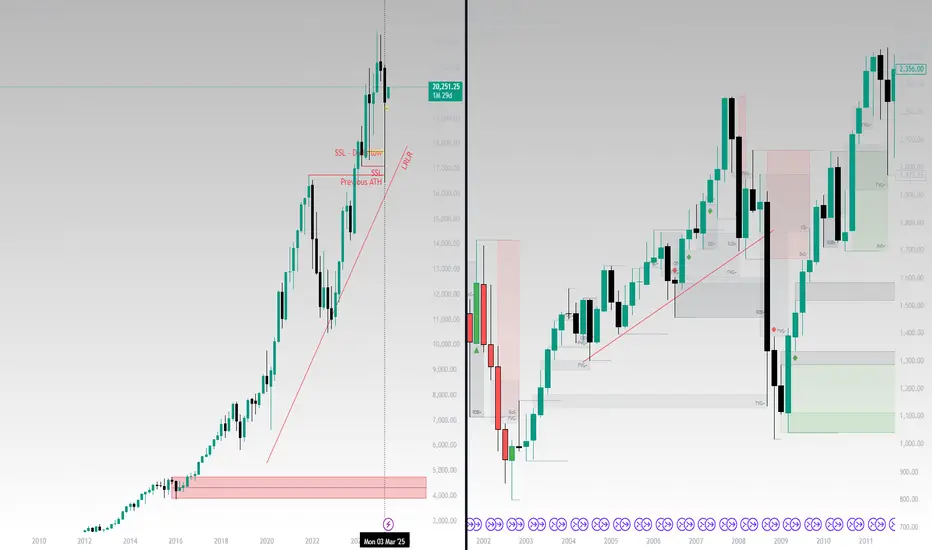
NQ-ES-YM Bearish Long Term Scenario Playing Out VERY BEARISH I think of all the pension funds, all the mortgages, all the war, all the grief and sorrow and depression and inability to find work, there's a whole heap of a mess going on behind the scenes and i hope for the best but expect the worst, and this structure Last Months April Candle is Bearish, and it looks like this Month will be a test of the Distribution Zone and then further down side to the Original Consolidation just like 2008.
It makes a lot of sense to me from the standpoint of not really studying very much but being Intune with the Price Action Analysis, this is a repeating phenomenon in History, the Great Reset, the New Shiny Syndrome, and the classic human behavior to spend more than we have available, over extended and over leveraged individuals will not be readily risk verse,
This Revolving door of money will lead to a bloom of opportunities in a few years, although i see at least 6 months of capitulation to the down side incoming fairly quickly, and i can say this with certainty about one news article i saw recently: US sanctions any country buying Oil from IRAN. Prayers for all, Thank You Jesus, Gods Speed. Amen.

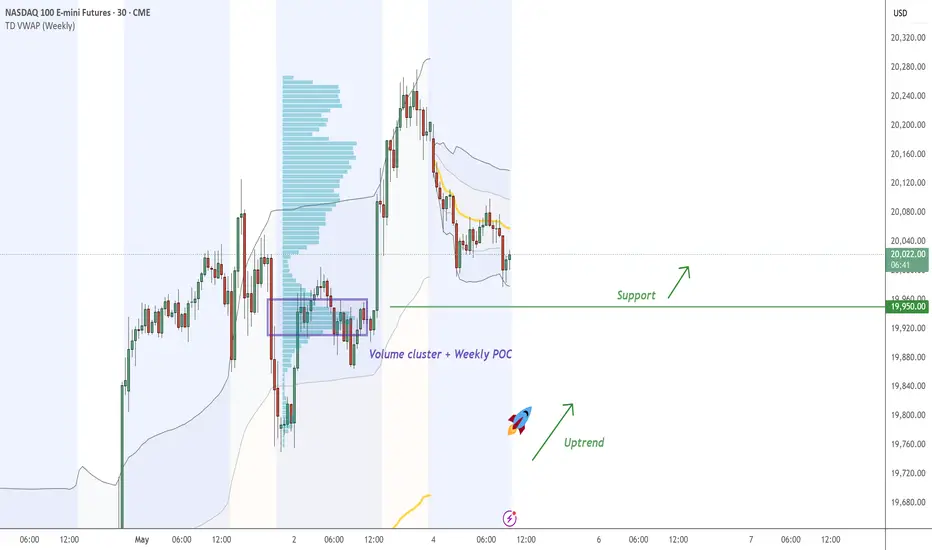
NQ continue with the UptrendOn NQ , it's nice to see a strong buying reaction at the price of 19950 .
There's a significant accumulation of contracts in this area, indicating strong buyer interest. I believe that buyers who entered at this level will defend their long positions. If the price returns to this area, strong buyers will likely push the market up again.
Uptrend and high volume cluster + Weekly POC are the main reasons for my decision to go long on this trade.
Happy trading
Dale
NQ1 - Out Of Hours Pop = Exhaustion Gap?NQ1
Very sudden pop happening out of hours.
Impulsive action outside of regular trading hours can often be dangerous.
There is a reasonable chance that this move is the final blow off phase of the uptrend to set up an exhaustion gap in regular trading hour indices before the next wave down.
FOMC tomorrow might provide the volatility to print a topping candle.
We'll see - obviously that just one possible outcome.
But if it gaps up tomorrow I'm going to be thinking of short opportunity🤨.

NQ1 - Did Bitcoin Just Call The Top ?NQ1
Has slumped since week open and printing and Evening Star candle pattern on the 4 hour chart.
So considering that it is in the retracement Golden Window (0.618 - 0.786) and also that Bitcoin is capitulating; this might just be the top here 👍.
Not advice

NQ 4/28/2025 - 5/2/2025 weekly profile and target this week like i mention should be risk low and will have a lot of volatility because of news on this week so Monday and Tuesday could good for trade and Wednesday and Thursday and Friday maybe be hard to control but our bais is bullish for this week like same previous week
and only trade we will take will be buy because of our bais
why our bais is bullish?
because of higher time frame weekly and daily and 4 hour order flow is bullish
and also if we look 20 days back we will see that highest of 20 days back is so close so
i that will be our target for this week and that is my idea

What's Next for Tech (April update)My previous analysis on this same chart was obsoleted by the Tariffs announcement on "Liberation Day" - which caused the (tech) market to accelerate the drop down to almost 25% in the week of April 2
SO here's the updated view after "some recovery" from that low. For better visibility, i hid the price (as a faint blue line) so i can focus on the signals that *are really critical to see*.
What are we looking at here ?
==========================
- The thick purple and blue lines are 20 and 50 SMAs - the gray line is a 100 SMA
- this is a weekly chart representing NASDAQ 100 futures as a Tech market proxy
- Lower indicators are a MACD (showing momentum) and RSI (showing strength) - settings for these indicators are sync'ed to the price chart (so the 20/50 crossing will show on MACD as main line crossing zero, RSI is also set to 20 SMA)
What is scary here ?
===================
- we had a 20/50 SMA death cross (20 SMA moving below 50SMA on weekly chart) twice in the last 9 years - we're about to get one this week
- There are 2 main scenarios after a death cross forms, recovery and crash - as seen by the past crosses from December'18 and April'22 (Note: COVID crash didn't cause a death cross)
Why is this specific view important ?
==================================
Our trading plan needs to be adjusted (if crash, go to cash and wait, if recovery, ride the wave up) - for position traders, there's really no gain trading stocks in a market that is breaking down
what's next ?
==============
i'm watching this view to track what the market does next - with how dynamic the situation is with US market / economy, it's hard to tell which scenario will unfold. On one hand, US admin wants to show market improvement, and on the other, certain ill-planned economic "moves" are pulling the market down..
Which scenario do you think will unfold here?

Nasdaq Futures (NQ): 5 Swing Pattern Points to Further GainNasdaq Futures (NQ) experienced a sharp selloff following a tariff announcement by President Trump, with the decline starting from a peak on December 16, 2024, at 22,450. The selloff concluded at 16,465.89 on April 7, 2025, which we’ve labeled as wave (II). For the Index to confirm a bullish trend and rule out a potential double correction, it must break above the December 16, 2024, high of 22,450. In the short term, the rally from the April 7 low of 16,465.89 is unfolding as a five-swing pattern. It is a motive sequence that suggests further upside potential.
From the April 7 low, the rally is developing as a five-wave diagonal structure. Wave 1 peaked at 18,361.5, followed by a wave 2 pullback to 16,735. The Index then surged in wave 3 to 19,386.75, with a wave 4 dip ending at 17,700. Currently, wave 5 is in progress, with sub-wave ((i)) topping at 19,688.5 and sub-wave ((ii)) bottoming at 19,103.75. Sub-wave ((iii)) reached 20,125.75, and a potential sub-wave ((iv)) pullback may have concluded at 19,749.5.
The Index is expected to push higher once more in sub-wave ((v)) to complete wave 5 of (1). After this, a wave (2) pullback should occur, likely in a 3, 7, or 11-swing pattern, before the Index resumes its upward trend. As long as the 16,465.89 low holds, dips are expected to attract buyers in 3, 7, or 11-swing patterns, supporting further gains in the near term.

Nasdaq - April ReviewMore confident in S&P500 reaching my overall objective of the midpoint of the SIBI consequent encroachment than Nasdaq this month but all in all, I am still expecting the market to gravitate higher up to $20,370

NQ Short (04-30-25)Sell in May on the way? Looks like the Insignificant Range is between the two orange TL's, NAZ will need to break out of range. Red arrow above, 1st Danger Zone cliff (view prior Post's). 4HR has an M developing. Anyway, Tricks/Tweet's can only get you so high. 714 is KL to watch should it lift back up (in the O/N, at 3am).

#202518 - priceactiontds - weekly update - nasdaqGood Evening and I hope you are well.
comment: Bulls want at least 20536 now and run all the stops from before the big sell-off. Bears are not doing anything at all, so bulls will likely get it. This could be a breakout-retest and I marked the area for that with the red rectangle. Small chance bears come around next week but for now it’s too early to short and buying into 9 consecutive bull days is statistically beyond moronic.
current market cycle: trading range
key levels: 15500 - 23000 (upper range is a guess, could also become 21000 but for now we don’t know so I assume the higher price)
bull case: 20536 and then 21000. Those are the next targets and bulls are in full control of the market. The measured move from the buy spike at the lows is around 22350 and it’s possible that we get there. I think we need to see a pullback and how deep that will be. If we get only another sell spike and immediate buying for higher highs, we can also assume much higher prices. Above 21100 there is no reason not to go for 23000.
Invalidation is below 19100.
bear case: Bears have nothing. Below 19100 market is neutral but until then, selling this is dumb. Wait for more bears to appear or at least seeing something that resembles a topping pattern. Like a lower high on the 1h chart. Don’t try to be the lucky bear who shorted the exact high.
Invalidation is above 21100.
short term: Neutral. No interest in buying such a buy climax but it’s way too early for shorts. Patience is key.
medium-long term - Update from 2024-04-26: My most bearish target for 2025 was 17500ish. Now I assume we will be in a trading range 16000 - 23000 for much longer.

Nasdaq: The Rally Continues!The Nasdaq ended last week with strong upward momentum, moving swiftly toward the resistance at 20,694 points. Now it's getting interesting: once the index breaks above this mark, it should quickly enter our upper turquoise Target Zone (coordinates: 21,751 – 22,425 points), where we expect the peak of wave X in turquoise. Afterward, we anticipate a pullback during wave Y, which should aim for our lower turquoise Target Zone (coordinates: 17,074 – 15,867 points). The corrective magenta wave (4) should be completed there. However, if the Nasdaq directly surpasses the significant resistance at 23,229 points, our alternative scenario will take effect. In this 35% likely case, we would consider wave alt.(4) as already complete and locate the index in the impulsive wave alt.(5) .

Nasdaq – Daily Breakout Alert!📈 Nasdaq – Daily Breakout Alert!
Wonderful breakout spotted on the Nasdaq Daily Chart after a prolonged consolidation of nearly 2 months. If the price sustains above 19,945 and breaks past the key resistance at 20,060, we could witness the beginning of a fresh rally in the index.
🔍 All eyes now on the price action in this critical zone. Continuation above these levels could trigger strong bullish momentum — assuming no major global turmoil disrupts the setup.
#NASDAQ #Breakout #TechnicalAnalysis #USMarkets #BullishSignal #ChartWatch #TradingView

2025-05-01 - priceactiontds - daily update - nasdaqGood Evening and I hope you are well.
comment: Way tougher than it looks. Both sides have good arguments why this continues higher or why today marked the top. I have a heavy bearish bias but I confirmation would only be below 19090 and that’s 700 points down. I do think if bears can close the gap down to 19640, we retest 19300 and there we have the first bull trend line. Below we go for 19100, which was the us gdp spike low and below that is armageddon. Bulls have nothing but continuation of this short squeeze. When Apple earnings disappoint, you know things are about to get real ducking bad next.
current market cycle: trading range
key levels: 19000 - 20000
bull case: Bulls got 20000 and even went above the April high, now what? Technically still a lower high until they hit 20537. They have going for them that today was the first bear bar after 7 consecutive bull days. They now want to defend the open gaps to keep the momentum going. A pullback can go way deeper than most bulls will be comfortable with, given the current environment. I do think best bulls can hope for tomorrow, is to go sideways and close the week above 20000.
Invalidation is below 19640.
bear case: Bears have all the macro schmackro arguments on their side that you can try to come up with. Structure says bullish until bull trend lines are broken. First is around 19500 and second is the bigger one around 19000. Can bears get to either tomorrow? I do think so yes. This was a nasty short squeeze but we are right under the weekly 20ema, technically still a lower high because the last major lower high was 20536. On the weekly chart this is a textbook two-legged pullback to the moving average and I pray daily that we will get another huge leg down to 15000. How likely is that? For now, very unlikely. Still it would be more fun if the bull trend line from the covid lows would break and we transition into a trading range 15000 - 22000.
Invalidation is above 20140.
short term: Neutral. For tomorrow I can see 20100 not getting hit again and we sell-off. If markets stays above 19700, bulls remain in full control. full bear mode below 19640. Above 20140 we likely go for 20500+.
medium-long term - Update from 2024-04-20: My most bearish target for 2025 was 17500ish, given in my year-end special. We are +18% from the lows and I do think, once this turns again, it will easily be the short trade of the year.
trade of the day: Longs near 1h 20ema. Was profitable couple of times. Sell-off into close was insider-trading. Absolutely certain that the earnings were leaked.

2025-05-06 - priceactiontds - daily update - nasdaq
Good Evening and I hope you are well.
comment: Clear trading range 19700 - 20300, don’t make it more complicated. We have FOMC tomorrow, then we will get a new impulse.
current market cycle: trading range
key levels: 19700 - 20300
bull case: Bulls defended the gap below to 19650 and prevent the bears from printing a bearish daily bear bar. Bulls are fine with the market correcting sideways, since that increases the odds of a continuation up and running the stops above the prior major lower high 20536. Bulls need to break above 20070 tomorrow or this could slowly become more bearish again, especially when we make lower lows below 197300.
Invalidation is below 19100.
bear case: Bears see it as a lower high major trend reversal and if they can stay below 20000, their odds increase to continue down. They broke below the first bull trend line and the next is around 19700 tomorrow. A strong 1h close below 19700 and I think more bulls will give up on this bounce.
Invalidation is above 20100.
short term: Neutral. Continuation in given range is expected until FOMC. I don’t know if Jpow can really move this but let’s see. Don’t gamble.
medium-long term - Update from 2024-04-20: My most bearish target for 2025 was 17500ish, given in my year-end special. We are +18% from the lows and I do think, once this turns again, it will easily be the short trade of the year.
trade of the day: Short since Globex open since Market could not get above 1h 20ema for 299 points down.

This is how i get the Sunday opening by aligning Narrative& BiasSo here i zoomed in on the 1hour chart and i see that there was a Distribution Range, i took the high to low Premium and Discount quarters, and then i draw the fibs on the most relevant quarter i am aiming to short from aligning with the PD Array,
noticing how theres some BSL there and theres a 1h SIBI FVG aligning with the Daily Volume Imbalance.

NQ KEY ICT LEVELS - 6th MAY 2025Levels marked on the chart using my free indicator which marks out all of the ICT key levels which can be used for potential POIs where price might react

NQ KEY LEVELS - 6th MAY 2025Key levels marked by using low volume nodes for potential key levels where we may see price react.

Short Nasdaq Idea for First Stage Distribution Looking at the Daily Chart lining up with the Higher time Frame Bearish narrative underway, i like the idea of shorting Sunday Opening because there's no more opportunity to get out of long positions here once price has exhausted Premium PD Arrays. And I am highly considering Sunday High to Friday Closing Bell Low. There's lots of Low Resistance Liquidity beneath PA currently, there's no money in the laymans wallet, there's no reason for price to go up EXCEPT for Redistribution/continued Short Selling.

TRADE IDEA FOR NQSIMPLE TRADE IDEA, I like the OTE levels a lot, i think i may use them a lot in my future trading, however i wanna go through all the mentorships first, specifically 2016.
