#COMBO: Unlocking Cross-Chain CompatibilityDescription:
This trading idea highlights COMBO, a cryptocurrency that powers a next-generation cross-chain solution aimed at enhancing blockchain interoperability. By enabling seamless communication and asset transfers between different blockchain networks, COMBO plays a pivotal role in addressing one of the key challenges in the crypto ecosystem. With its focus on scalability, low transaction costs, and multi-chain integration, COMBO is positioned to benefit from the growing demand for efficient and interconnected decentralized applications (dApps). Its adoption is further fueled by partnerships and integrations with major blockchain projects, strengthening its fundamentals.
That said, the cryptocurrency market is highly volatile, and COMBO’s price can be influenced by regulatory developments, market sentiment, and other macroeconomic factors. A strategic and cautious approach is essential when trading or investing in this digital asset.
Disclaimer:
This trading idea is provided for educational purposes only and does not constitute financial advice. Trading cryptocurrencies like COMBO carries significant risk, including the potential for a complete loss of capital. Always perform thorough research, evaluate your financial situation, and consult with a financial advisor before making any investment decisions. Past performance is not indicative of future results.
COMBOUSDT trade ideas

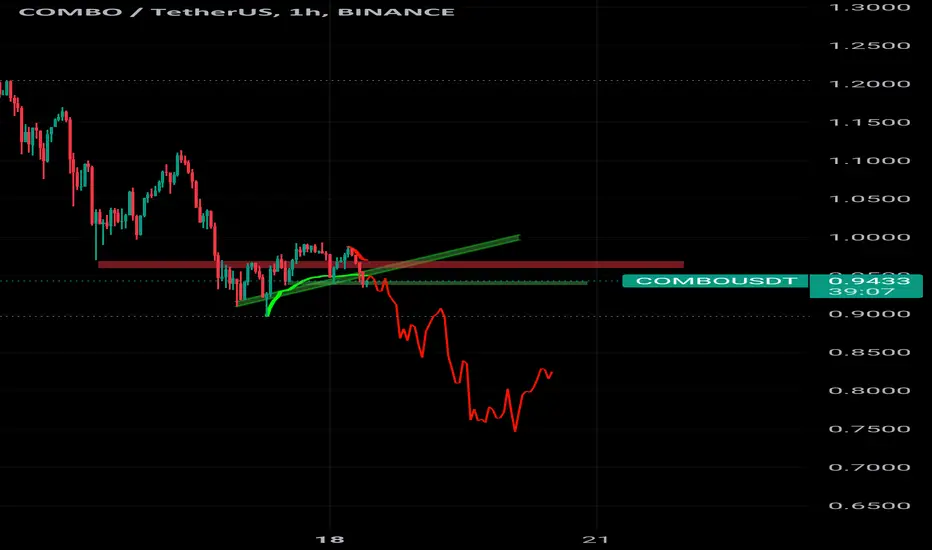
#COMBO breaks the Diagonal Trendline and retests it in 1-Hour TF#COMBO breaks the Diagonal Trendline and retests it in 1-Hour TF!
$COMBO looking good for a long position. The local resistance level is PMH $0.4775and the support level is PDL $0.3799.

Combo Combo my sell zone: $3.9 - 4.0
Most alts here are undervalued and have too much fear in the market. Remind me of Covid vibes.

COMBO looks BullishCOMBO is in a large pattern that just seems to have finished wave C of this pattern.
Wave C has started from where we placed the red arrow on the chart. Wave C looks like a zigzag that has completed.
By maintaining the green range, it is prone to pumping.
COMBO is also trading above the bearish trigger line.
The targets are marked on the chart.
Closing a daily candle below the invalidation level violates this analysis and view.
For risk management, please don't forget stop loss and capital management
Comment if you have any questions
Thank You

COMBOUSDT (30M) Cypher Harmonic Long ThermThe information contained herein has been prepared for general information purposes only. The comments and recommendations contained herein are based on the personal opinions of commenters and advice givers. It should not be interpreted as a recommendation to buy or sell any investment instrument or a promise of return. These views may not be suitable for your financial situation and risk and return preferences. Therefore, making an investment decision based solely on the information contained herein may not produce results that meet your expectations. BINANCE:COMBOUSDT.P

COMBO Technical Analysis in 2-Day TimeframeHello everyone, I’m Cryptorphic.
For the past seven years, I’ve been sharing insightful charts and analysis.
Follow me for:
~ Unbiased analyses on trending altcoins.
~ Identifying altcoins with 10x-50x potential.
~ Futures trade setups.
~ Daily updates on Bitcoin and Ethereum.
~ High time frame (HTF) market bottom and top calls.
~ Short-term market movements.
~ Charts supported by critical fundamentals.
Now, let’s dive into this chart analysis:
COMBO is at a crucial point, holding the support at $0.47 and trying to rebound. COMBO needs to bounce back and test the $0.69 resistance to reverse the trend.
A further breakdown and close below $0.47 will invalidate the rebound, causing the price to touch an all-time low of $0.4110.
Key Observations:
- Important Support/Entry: $0.47.
- All-time low: $0.4110.
- Primary Resistance/Target 1: $0.6920.
- Higher Resistance/Target 2: $1.
- RSI: Oversold.
- Invalidation Point: A breakdown and close below the support line.
DYOR, NFA.
Please hit the like button to support my content and share your thoughts in the comment section. Feel free to request any chart analysis you’d like to see!
Thank you!
#PEACE

COMBOUSDTHM signal v5.0 (High momentum) spotted. Looking good with previous wave up with increasing volume and momentum.
- Heathy retracement and support well at good level @ 0.6556-0.6583
- Trending slow and steady if able to hold above the support zone
It is at extremely good reward to risk level now if able to hold above the support level.

COMBO looks BearishIt appears to be completing a larger pattern. The larger pattern is triangular or diametric.
It seems that we are in the middle of the big wave C (wave b of C).
By maintaining the red range, it can move towards the green range.
Closing a daily candle above the invalidation level will violate the analysis
For risk management, please don't forget stop loss and capital management
When we reach the first target, save some profit and then change the stop to entry
Comment if you have any questions
Thank You

Bearish Flag Pattern in Combo Coin Crypto"Analysis:
Chart Pattern: Combousdt Coin Crypto is currently displaying a Bearish Flag pattern, indicating potential downward movement.
Breakout Potential: The pattern suggests a likely continuation of the downward trend once the flag breaks.
Target Price: Estimate target prices based on the height of the flagpole.
Stop-Loss: Set a stop-loss slightly above the flag's upper boundary to manage risk.

combo short setup ALL trading ideas have entry point + stop loss + take profit + Risk level.
hello Traders, here is the full analysis for this pair, let me know in the comment section below if you have any questions, the entry will be taken only if all rules of the strategies will be satisfied. I suggest you keep this pair on your watchlist and see if the rules of your strategy are satisfied. Please also refer to the Important Risk Notice linked below.
Disclaimer

COMBOUSD 1WCOMBO ~ 1W
#COMBO If a retest of this Support line occurs, you can make a purchase, but you need to know, there may be many Candel wicks that will occur. This is a risky trade but it's worth trying.
with a target of at least 20%+

COMBOUSDT 1D#COMBO has broken the falling wedge pattern on the daily chart. Now it is facing the Ichimoku Cloud. We are bullish on it. Targets are:
$0.9031
$0.9845
$1.1004
$1.2481

6 week target combo BombI expect 8x at the end of 6 weeks, it won't be difficult because the quantity is very small. BINANCE:COMBOUSDT

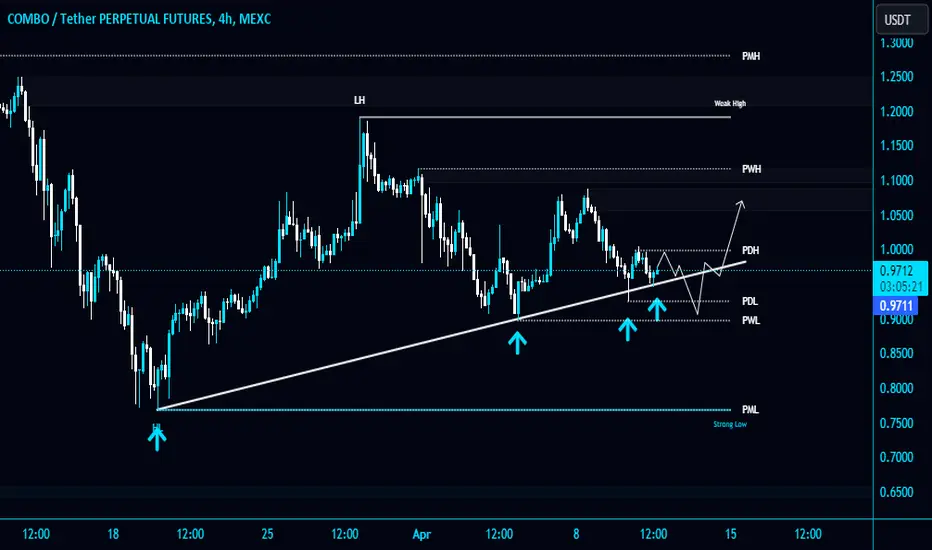
#COMBO/USDT is holding the Diagonal Trendline in 4-Hour TF!#COMBO/USDT is holding the Diagonal Trendline in 4-Hour TF!
$COMBO needs to hold this level or PWL $0.899 as a support level to gain bullish momentum. Wait for a bullish momentum to long it.
The local resistance level is PWH $1.1175.
COMBOUSDT.1DLooking at the COMBO/USDT daily chart, I can see that it displays the Relative Strength Index (RSI), Moving Average Convergence Divergence (MACD), and key price levels.
The RSI is slightly above the midpoint at 53.13, suggesting a neutral momentum and no immediate indication of an overbought or oversold market. The MACD is quite close to the zero line with a very small histogram value, implying that there's no strong bullish or bearish momentum currently in the market.
Price has recently been in a range, oscillating between the support (S1) at $0.7228 and the resistance (R1) at $1.2078. This indicates a consolidation phase. For a potential bullish scenario, a daily close above R1 could signify a breakout and could lead to further upward movement, potentially testing higher levels. Conversely, a break below S1 could suggest that the price is set to continue lower, potentially to retest previous lows or establish new support levels.
In terms of trading strategy, in the absence of clear signals from RSI and MACD, I would focus on the price action around these key levels. Breakouts should be accompanied by increased volume for confirmation. Given the wide range between support and resistance, there's room for significant price movement in either direction once a breakout occurs.
Risk management should include setting stop losses below S1 for long positions, or above R1 for short positions, to protect against market reversals. It would also be wise to monitor the broader market sentiment and any news or developments that could impact the price of COMBO.

COMBOUSTHM signal v3.1 (High momentum) spotted. Looking good with previous wave up with increasing volume and momentum.
- Heathy retracement and support well at good level @ 1.0652-1.0871
- Trending slow and steady if able to hold above the support zone
It is at extremely good reward to risk level now if able to hold above the support level.

#COMBO Possible Scenario#COMBO Possible Scenario
Moving clearly bearish.
I don't think it will break Uptrend.
So we are going deep short
#COMBO/USDT#COMBO
On the 4-hour frame, we have a bearish channel that the price is trading within, and it was broken
We have strong upward momentum that the price is expected to continue rising
The stability of the price above the moving average pushes the price to continue
Entry price 0.774
First goal 0.818
Second goal 0.875
Third goal 0.939

COMBOUSDT ANALYSIS We don't have any data on the chart, but it seems that we have two big waves A and B on the chart.
Wave A has ended and wave B has started at the place where we inserted start on the chart.
Wave B looks like a diametric we are now in wave E of.
If pullback hits the green range, we will look for buy/long positions
Closing a daily candle below the invalidation level will violate the analysis
For risk management, please don't forget stop loss and capital management
When we reach the first target, save some profit and then change the stop to entry
Comment if you have any questions
Thank You

COMBOUSDT 3DWill #COMBO hit the previous ATH? Yes.
Targets are as follows:
$1.1620
$1.2410
$1.7300
$1.8070
Buy and hold, we can see new ATH too.

Combo wombo Combo on ascending trend holding very well, healthy corrections.
Growth potential is double May price, Sell zone: $4 zone

This my I’d I think this pattern is a cup , after the formation of the cup group,one should wait for the extraordinary growth of this coins.if you agree with me ,tell your friends and don’t forget to

it's time to going down for COMBOUSDTbefore buying, please check for being sure about your opinion about this CRYPTOCURRENCY!!!
(in every target you want, closed the position but our target is the third one)
*Guy's the entry place is importance things in enter in a position and be careful do not going up your leverage over 7x ,all things it's about risk management*
*************************************************
if you want to enter in this position:
Enter Price: here
Target1: 0.758
Target2: 0.744
Target3(Final Target): 0.717
Stoploss: 0.789
*************************************************
Guy's if this idea was useful and it was intresting for you please follow for more
please do comment and like my idea
If you like my idea show me in comment section
doing and living in the best quality
thanks of all of you dear's ;)
