Compound Finance TrianglesNot investment advice. Not certified in any charting method. Just my best guess based on what I see.
COMPPERP trade ideas

Crypto COMP. TF H4 LONG According to my calculations, on the 4-hour time frame, the trend started on March 10.
On March 14, the level of 48.55 was tested. This level will be tested again in the near future.
Take profit at TP = 49.88 , do not forget about SL = 35.75
Good luck! ,
Regards WeBelieveInTrading

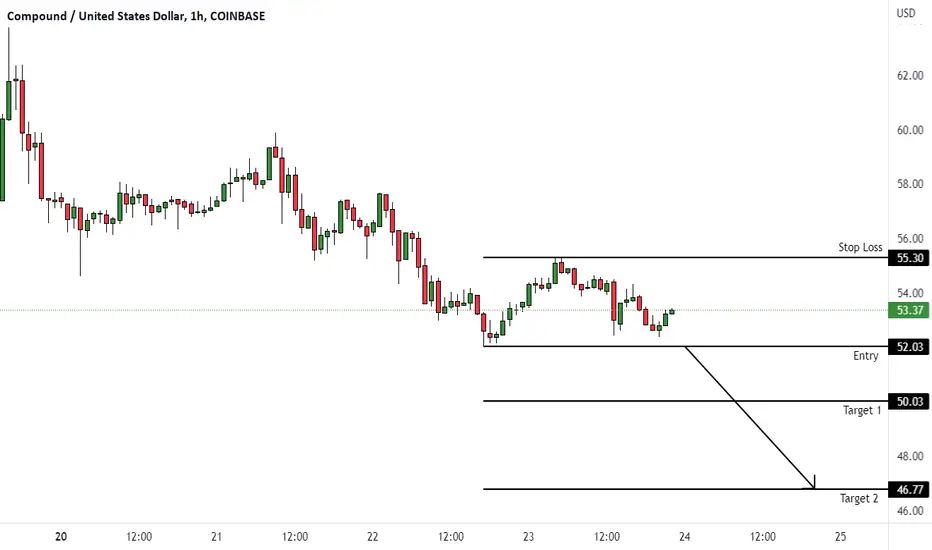
COMPUSD (1H) - Bearish breakoutHi Traders
COMPUSD (1H Timeframe)
The market is in a downtrend, and we are waiting for an entry signal to go SHORT below the 52.03 support level. Only the upward break of 55.30 would cancel the bearish scenario.
Trade details
Entry: 52.03
Stop loss: 55.30
Take profit 1: 50.03
Take profit 2: 46.77
Score: 5
Strategy: Bearish breakout

COMP to MOON#COMP is preparing for breakout and rise to $173.
Take long position after breaking trend line.


COMP to Double from here?COMP seem to be forming a BAT pattern on the weekly that could take us over 100 Dollars. I believe the BTC still has some legs to it and Alts will rally.
Please do your DD, this is not a financial advice.


COMPUSD (1H) - Bullish reversalHi Traders
COMPUSD (1H Timeframe)
Waiting for the upward break of 32.15 resistance level, which will complete a bullish trend reversal pattern to go LONG. Only the downward break of 31.58 would cancel the bullish scenario.
Trade details
Entry: 32.15
Stop loss: 31.58
Take profit 1: 32.50
Take profit 2: 33.06
Score: 4
Strategy: Bullish reversal

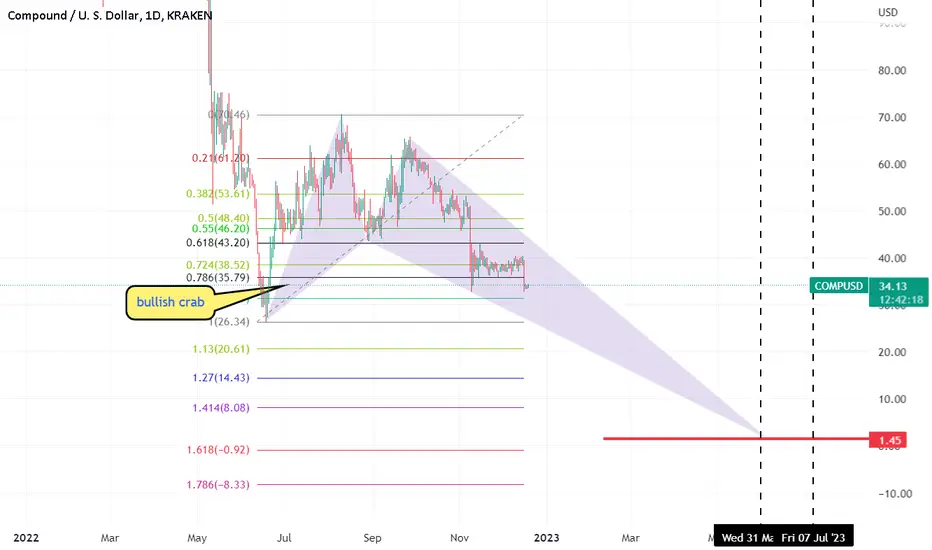
COMP updateI believe we're printing a bullish crab here with a target down in the 2-1 dollar zone for compound...
Compound (comp) simple channel idea No h&s patrerns, rsi, tdi or market.maker liquidity pools involved here. This one is simple channel formations and my noticing this angle of downward and upward price trend in many other assets and coins across the board. Human nature factors or just coincidence? Heres a far future projectory im lookinf at for validation and research. dydx coin is also published with similar pattern that i will publish

Oct 2022 compound Looking like price accumulation within the ascending triangle. All red boxed areas are short sell liquidity pools that market makers will want to hit and release their longs and visa versa with green boxed pools where buy orders have been made. I'm predicting a short squeeze (pump up of price) by MMs to balance their books with resistance at the 200ma on daily time frame. Rsi and tdi at thus point should signal overbought

November of 2020Nov of 2020 we saw a push above $80 lead to a high of $500 followed by a higher high of nearly $1000….. I believe a push over $80 could have similar effects in the upcoming year followed with the BTC and ETH markets going up…. Also volume is picking up at its low
Just TA not FA

COMP - clear formation on the dailyLet's see if this formation breaks to the up- or downside.
I am currently more pessimistic than optimistic, because when considering market environment, we would need some good news (--> DXY down and BTC up), for this to break to the upside. Lower rate hikes, lower inflation values, ... would be the signals to watch out for.
Nevertheless, we had a strong DeFi-season at the start of the last bullrun, so there IS a chance, if we get back into that positive sentiment.

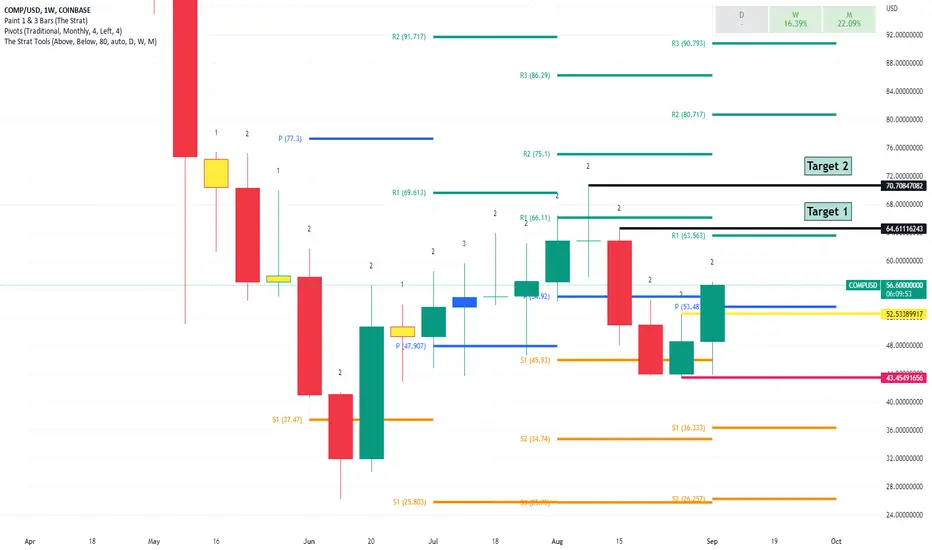
#COMP weekly long ideaHello dear Traders,
Here is my idea for #COMP
Daily close above the yellow trigger line (previous month high) to enter trade.
We try to anticipate a 2-2 bullish reversal in the weekly chart
Targets marked in the chart (black lines)
Invalidation level marked with red line
Please feel free to ask any question in comments. I will try to answer all! Thank you

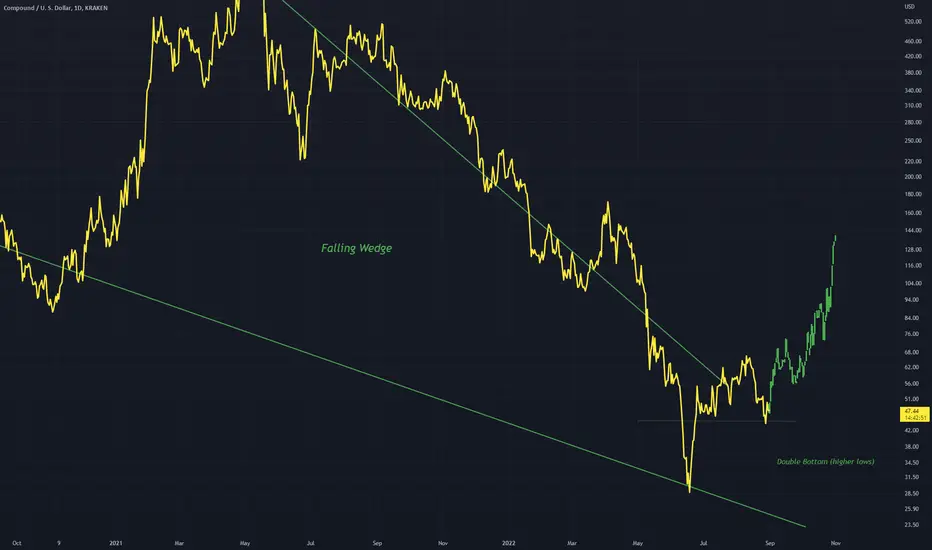
COMPUSD Reversal In Progress? A large falling wedge and accompanied double bottom bullish chart patterns can be identified
The falling wedge is a bit sketchy but I allow it
The double bottom is the major strong sign of a bull takeover, providing strong support
COMP long position possible from hereI would like to see this one play out.. the RSI is low/flat, the risk/reward ratio is good to take a try on a long position on COMP. NFA, always use SL close to entry!

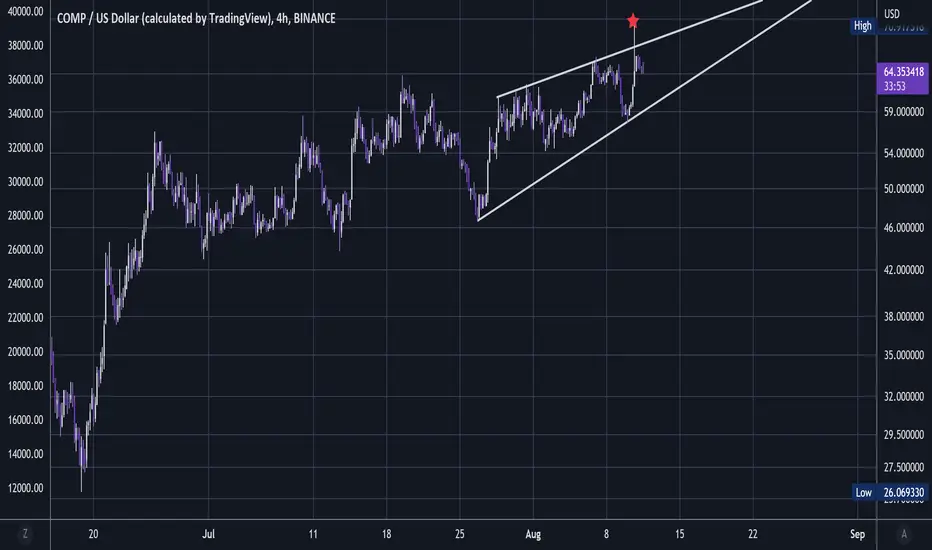
COMP - Taking ProfitCOMP recently printed an enormous star and it looks to be a topping blow off top out of a corrective ascent. It will most likely fail through the lower trendline.
Not advice.
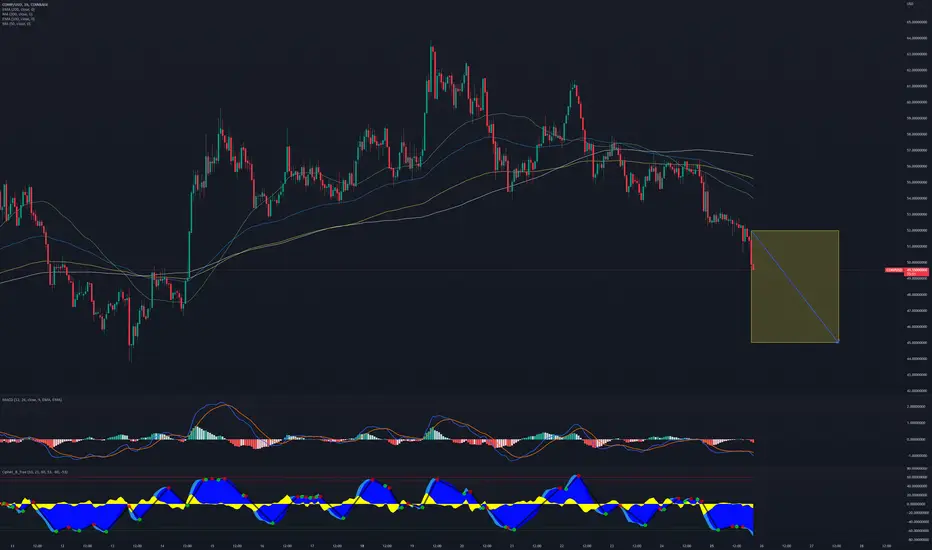
COMP USDT SHORT SWING| COMPUSDT | SHORT @ 52 - 50 | TP @ 49, 48, 47, 46, 45 | SL @ 58 | PATTERN = TRIPLE BOTTOM BREAKDOWN | COINBASE |
TRIPLE BOTTOM BREAKDOWN ON BPI CHART HOURLY
Swing trade idea. Kindly follow targets and stop loss. Will update with new targets once all 5 are achieved. Mostly trading with PNF charts, MACD, RSI, Stoch, BPI, Cipher, MA/EMA, Support/Resistance on hourly timeframes and higher time frames
COINBASE:COMPUSD BINANCE:COMPUSDT BINANCE:COMPUSDTPERP BINANCE:COMPUSD BITSTAMP:COMPUSD BITFINEX:COMPUSD FTX:COMPUSDT BYBIT:COMPUSDT
COMPUSD 1HR Chart - Bullish Divergence Between Price and RSIAfter the day's sell-off, COMP is recovering. The bullish divergence (RSI making a higher high and price making a lower low) shows that the price is likely to rise from here. The blue MACD line crossed above the orange signal line, indicating a change in trend. The price may rise to the recent 57 to 58 level. Potential short-term gain: 3% to 5%.
No guarantees of course - just going with the odds.

$COMP USDkeep it simple, make money. COMP USD will dump for probably the next week but I expect DeFi projects to start catching major bidding given current situations

COMP - Here Comes DeFi 🧑🏻🚀COMP up 10% today so far but it doesn't look like its going to be on the brakes too long as its currently pushing through the 50DMA and now printing a descedning channel that is probably a BULL FLAG. 🐂
