Comp Spot Buy✅ Trade Setup Plan
🟢 Bullish Scenario (Long Entry)
📥 Entry:
Aggressive Entry: Now (~$41) after breakout from the descending trendline
Safer Entry (Confirmation): Break and close above $44 with volume
🎯 Targets:
TP1: $47.90 – $48.50 (recent local high)
TP2: $50.80 – $51.50 (resistance zone)
TP3: $56 (major resistance)
🛑 Stop-Loss:
Below $38.50 or tighter at $39.80 if you entered at $41
Below $36.50 if you're targeting a wider swing trade
🔴 Bearish Scenario (Short Entry)
📥 Entry:
If price fails to hold $39.80 and breaks below $38.50 with volume
🎯 Targets:
TP1: $35 (support region)
TP2: $33.20 – last tested bottom
🛑 Stop-Loss:
Above $41.20 or $42 depending on entry
📊 Indicators to Monitor
RSI: A clean push above 60 = bullish strength; drop below 40 = bearish pressure
MACD: A strong bullish crossover + increasing histogram = momentum confirmation
Volume: Confirm breakouts with increasing volume
COMPUSDT trade ideas

COMPUSDT 1WCOMP ~ 1W Analysis
#COMP Buy back from here with a short -term target of at least 20%+. This is a very good support for now.

Compound: Ready, Bullish, LONG (More Than 30X Growth Potential)Compound is ready. COMPUSDT is now confirmed bullish. Time to go LONG.
How are you doing my friend in this beautiful day?
I hope you are doing great. Another interesting pair with a great entry price, a great project as well.
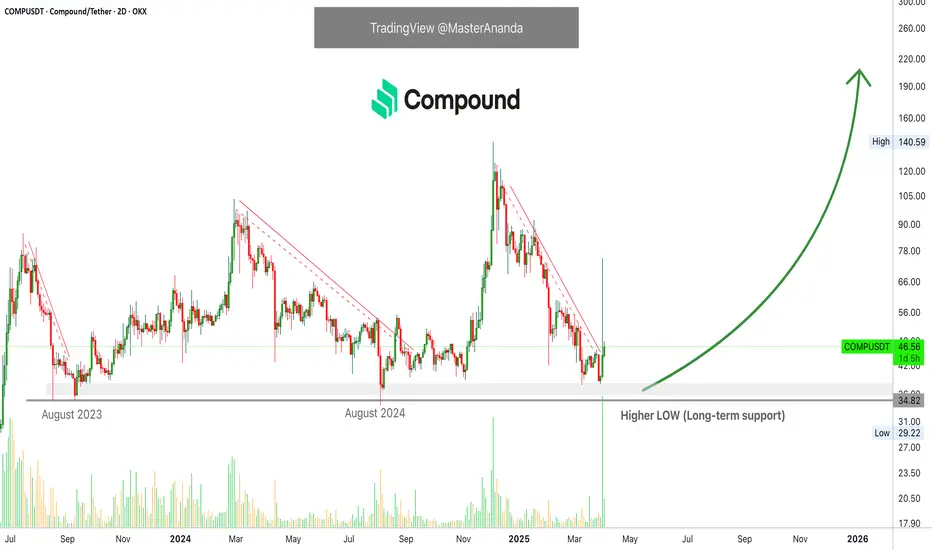
Compound produced the highest volume in several years as we entered April 2025. This is huge. This signal alone reveals that the next bullish wave is already here.
A long-term support holds —fails to be tested, which is bullish; we have a higher low. A yearly double-bottom is present on the chart, August 2023 and August 2024. March 2025 produced the higher low.
The previous session produced the highest buy (bullish) volume since March 2022, three years ago. There is also a long upper wick on the candle. This means that resistance has been removed. The rise can now happen smoothly as all the sell orders all the way to $75 have been fulfilled. We are LONG on this pair.
Compound has been producing higher highs since mid-2023. These higher highs are part of a long-term, wide, consolidation phase. This consolidation is the preparation for the 2025 bull-market. We are looking at a potential of... I don't know, maybe $1,444 as the next All-Time High. Let's do the maths. Some 30X.
This is a timing based chart. "Seek you first great entry prices and timing, and all these profits shall be added unto you."
If you want to know more about the numbers and signals, search for COMPUSDT when you visit my profile, you will find all the numbers for the 2025 All-Time High and beyond.
This pair is good now to buy and hold.
Leveraged traders can also approach this pair with low risk and a high potential for reward.
Thank you for reading.
Your support is appreciated.
Namaste.
Compound COMP price analysisWhat is happening today?) Some coins are falling -50% per hour, and #COMP has grown +85% from $40 to $75 per hour
Does anyone know what kind of "breakthrough" happened in #Compound ?
Is this what we get, can we start dreaming about the growth of OKX:COMPUSDT to $175, and if we are lucky, to $215?)
_____________________
Did you like our analysis? Leave a comment, like, and follow to get more

#COMP #COMPUSDT #Compound #Update #Analysis #Eddy#COMP #COMPUSDT #Compound #Update #Analysis #Eddy
COMPUSDT.P (( 3 Signals Analyzed on the chart ))
Update on the analysis of this currency for you, dear followers,
Everything is very clear on the chart and Important areas of the upper time frame for scalping are identified and named.
This is based on a combination of different styles, including the volume style with the ict style.
Based on your strategy and style, get the necessary confirmations for this scalping setup to enter the trade.
I have analyzed for you the 3 moves that this currency is going to make in its upcoming trends. For you, follow moves 1, 2 & 3 in order according to the comments left on the chart. First, take a long scalp from the first marked point to the red marked lines and then follow the second move. The best short point is to the low demand area, which is the green area. The red line with the entry of snipers is the text. Finally, follow and for the third move in the green marked demand area, look for confirmation for swing trading and also long-term spot investment.
It is never too late to buy and invest. Do not rush and do not be fooled by the positive movements and reactions of the market. Wait for the price to reach its valuable areas. In the analysis of the Compound currency, as you can see, there is a strong demand area that is intact. Be patient until the price falls from the decision or extreme flips to the green area of the important demand area. Be sure to check this currency in your Daily & Weekly time frame and draw the areas. Then refer to the weekly, daily and four-hour time frames and draw the lower time areas and look for confirmation for volatility.
Do not rush to invest and buy spot and let the price reach the support area.
Be successful and profitable.
"In the previous analysis of the Comp currency, we caught a beautiful pump. I hope you enjoyed and benefited from that analysis."
Review and view previous Comp currency analysis :

COMPAUNT 3 MAGOR POINTSCompaunt one of the famous credit protocol in crypto. There is all main points. I'll be wait a chance to entry from order block if not doesn't matter

#COMP #COMPUSDT #Compound #Analysis #LONG #Eddy#COMP #COMPUSDT #Compound #Analysis #LONG #Eddy
COMPUSDT.P Ready For Long Entry
Important areas have been identified, the entry point has been touched in advance, and the pullback has been made on a lower timeframe, and it is ready to long entry upon receiving confirmation.
This is based on a combination of different styles, including the volume style with the ict style.
Based on your strategy and style, get the necessary confirmations for this scalping setup to enter the trade.
Don't forget risk and capital management.
The responsibility for the transaction is yours and I have no responsibility for not observing your risk and capital management.
Note: The price can go much higher than the second target, and there is a possibility of a 40% pump on this currency. By observing risk and capital management, obtaining the necessary approvals, and saving profits in the targets, you can keep it for the pump.
Be successful and profitable.

A bullish breakout with a specific price target.This analysis focuses on the COMP/TetherUS pair on the weekly chart, where a clear ascending triangle pattern has formed over the past few years. The price is currently testing the upper resistance of this pattern around 40.14 USDT, and I anticipate a breakout to the upside with a potential target of 170 USDT.

COMP - Shift in Momentum in Action!Hello TradingView Family / Fellow Traders. This is Richard, also known as theSignalyst.
🔹 COMP has been overall bearish trading within the falling channel in red.
However , it is currently rejecting a strong weekly support at $35 - $40.
Moreover, it is clear that the bears are exhausted as the bearish impulse phases are getting more flat.
📈 For the bulls to take over, and shift the momentum in their favor, a break above both trendlines and $50 round number is needed.
📚 Always follow your trading plan regarding entry, risk management, and trade management.
Good luck!
All Strategies Are Good; If Managed Properly!
~Rich

COMPUSDT 1WCOMP ~ 1W Analysis
#COMP Buy gradually from here if you still have a Conviction on this coin with a short -term target of at least 20%+.

COMP/USDT 3DAYS TIME FRAME ANALYSISHi friends as we see that COMP is bouncing in an uptrend Channel that it also coincides with the important support level of $40.24.
I think that it can be supported from this level and if it breaks below the channel it could have a momentum short squeeze that may fake out the channel and get back into it. and keep bulls idea alive.

COMPUSDTWe can attempt to buy COMPUSDT from specified level if it break LH , also bullish divergence occur indicate that it moves upward.
SL , TP mention in chart.

Compound 6X Trade-Numbers (1,788% Potential)Compound hit bottom. This is a trade setup that recently went badly for us, it failed but, I would like to try again.
There is a clear double-bottom signal, short-term, and a long-term higher low. This chart setup is perfect for a new bullish jump. Truly a great set up based on the chart structure and signals.
Notice the volume. Always the volume. There is no volume on the bearish wave.
Notice the strong volume within the bullish wave.
That is all I have to say. I am going LONG.
Full trade-numbers below:
_____
LONG COMPUSDT
Leverage: 6X
Entry levels:
1) $53
2) $49
3) $46
Targets:
1) $57
2) $66
3) $81
4) $93
5) $105
6) $122
7) $144
8) $168
9) $183
10) $207
Stop-loss:
Close weekly below $45
Potential profits: 1788%
Capital allocation: 4%
_____
Thank you for reading.
Remember, you can do whatever you want. It is your life, your money, your computer... Your responsibility.
Namaste.

COMP/USDT NEW VOLUME INCREASECOMP/USDT NEW VOLUME INCREASE
Following the data to see if there is new break coming

Compusdt long from hereSbs is created in this area .trying this strategy since few days ..it works great

COMP/USDT 1W 🩸 NYSE:COMP ⁀➷
#Compound. Macro chart Another
💯 Intermediate Target - $121
🚩 Macro Target 1 - $167
🚩 Macro Target 2 - $260
🚩 Macro Target 3 - $381
- Not financial advice, trade with caution.
#Crypto #Compound #COMP #Investment
✅ Stay updated on market news and developments that may influence the price of Compound. Positive or negative news can significantly impact the cryptocurrency's value.
✅ Exercise patience and discipline when executing your trading plan. Avoid making impulsive decisions driven by emotions, and adhere to your strategy even during periods of market volatility.
✅ Remember that trading always involves risk, and there are no guarantees of profit. Conduct thorough research, analyze market conditions, and be prepared for various scenarios. Trade only with funds you can afford to lose and avoid excessive risk-taking.

COMP/USDTKey Level Zone: 56.60 - 57.20
HMT v6 detected. The setup looks promising, supported by a previous upward/downward trend with increasing volume and momentum, presenting an excellent reward-to-risk opportunity.
HMT (High Momentum Trending):
HMT is based on trend, momentum, volume, and market structure across multiple timeframes. It highlights setups with strong potential for upward movement and higher rewards.
Whenever I spot a signal for my own trading, I’ll share it. Please note that conducting a comprehensive analysis on a single timeframe chart can be quite challenging and sometimes confusing. I appreciate your understanding of the effort involved.
Important Note :
Role of Key Levels:
- These zones are critical for analyzing price trends. If the key level zone holds, the price may continue trending in the expected direction. However, momentum may increase or decrease based on subsequent patterns.
- Breakouts: If the key level zone breaks, it signals a stop-out. For reversal traders, this presents an opportunity to consider switching direction, as the price often retests these zones, which may act as strong support-turned-resistance (or vice versa).
My Trading Rules
Risk Management
- Maximum risk per trade: 2.5%.
- Leverage: 5x.
Exit Strategy
Profit-Taking:
- Sell at least 70% on the 3rd wave up (LTF Wave 5).
- Typically, sell 50% during a high-volume spike.
- Adjust stop-loss to breakeven once the trade achieves a 1.5:1 reward-to-risk ratio.
- If the market shows signs of losing momentum or divergence, ill will exit at breakeven.
The market is highly dynamic and constantly changing. HMT signals and target profit (TP) levels are based on the current price and movement, but market conditions can shift instantly, so it is crucial to remain adaptable and follow the market's movement.
If you find this signal/analysis meaningful, kindly like and share it.
Thank you for your support~
Sharing this with love!
HMT v2.0:
- Major update to the Momentum indicator
- Reduced false signals from inaccurate momentum detection
- New screener with improved accuracy and fewer signals
HMT v3.0:
- Added liquidity factor to enhance trend continuation
- Improved potential for momentum-based plays
- Increased winning probability by reducing entries during peaks
HMT v3.1:
- Enhanced entry confirmation for improved reward-to-risk ratios
HMT v4.0:
- Incorporated buying and selling pressure in lower timeframes to enhance the probability of trending moves while optimizing entry timing and scaling
HMT v4.1:
- Enhanced take-profit (TP) target by incorporating market structure analysis
HMT v5 :
Date: 23/01/2025
- Refined wave analysis for trending conditions
- Incorporated lower timeframe (LTF) momentum to strengthen trend reliability
- Re-aligned and re-balanced entry conditions for improved accuracy
HMT v6 :
Date : 15/02/2025
- Integrated strong accumulation activity into in-depth wave analysis

COMP: Navigating Consolidation👋 Welcome to !
Today, I'll be analyzing the COMP token, a core component of a well-known DeFi project specializing in lending and borrowing, currently ranked 200th with a market cap of $100 million.
📅 Weekly Timeframe
In the weekly timeframe, we see a bearish trend that later transitioned into a consolidation box, with the current box's floor at $30.96 and the ceiling at $90.56. After the price was rejected from the all-time high of $800 and fell to $30.96, trading volume was initially high, affirming the downtrend.
🧩 However, after forming this box between the two levels, the volume decreased, indicating that whales and market makers have likely withdrawn their investments from this coin for now.
🔍 The primary support, as mentioned, is at $30.96, and if this level breaks, the downtrend is expected to continue. As observed, the price previously rose to the resistance at $90.56 and broke it, but then returned to the box, making this move a fake breakout.
📊 Currently, an important floor in the weekly timeframe is observed at $40.38, which is a good support. A break below this area could introduce significant bearish momentum and panic into the market. Additionally, the RSI indicator shows important support at 37.89, which, if broken alongside the $40.38 area, could early confirm a further bearish leg.
🔼 On the flip side, if the price is supported above this level and moves towards $90.56, breaking this area could enable us to hit the targets set for this coin. As shown in the chart, significant resistances are located at $252.60 and $800. However, for the coin to reach these figures, significant market cap growth is necessary.
📝 Final Thoughts
This analysis reflects our opinions and is not financial advice.
Share your thoughts in the comments, and don’t forget to share this analysis with your friends! ❤️

TradeCityPro | COMP: Navigating Consolidation👋 Welcome to TradeCityPro!
Today, I'll be analyzing the COMP token, a core component of a well-known DeFi project specializing in lending and borrowing, currently ranked 200th with a market cap of $100 million.
📅 Weekly Timeframe
In the weekly timeframe, we see a bearish trend that later transitioned into a consolidation box, with the current box's floor at $30.96 and the ceiling at $90.56. After the price was rejected from the all-time high of $800 and fell to $30.96, trading volume was initially high, affirming the downtrend.
🧩 However, after forming this box between the two levels, the volume decreased, indicating that whales and market makers have likely withdrawn their investments from this coin for now.
🔍 The primary support, as mentioned, is at $30.96, and if this level breaks, the downtrend is expected to continue. As observed, the price previously rose to the resistance at $90.56 and broke it, but then returned to the box, making this move a fake breakout.
📊 Currently, an important floor in the weekly timeframe is observed at $40.38, which is a good support. A break below this area could introduce significant bearish momentum and panic into the market. Additionally, the RSI indicator shows important support at 37.89, which, if broken alongside the $40.38 area, could early confirm a further bearish leg.
🔼 On the flip side, if the price is supported above this level and moves towards $90.56, breaking this area could enable us to hit the targets set for this coin. As shown in the chart, significant resistances are located at $252.60 and $800. However, for the coin to reach these figures, significant market cap growth is necessary.
📝 Final Thoughts
This analysis reflects our opinions and is not financial advice.
Share your thoughts in the comments, and don’t forget to share this analysis with your friends! ❤️

Tradeplan for COMP Hello traders, another opportunity spotted to accumulate COMP for profits, we can see from the chart the price just bounce off an accumulation zone and from the chart you can see how we plan this trade for good returns.
Tradehubng

COMPUSDT 1WCOMP ~ 1W Analysis
#COMP Buy gradually from here if you still have a Conviction on this Coin with a minimum target of 20%+.

Long-Term Investors, Pay Attention – Blue Boxes Are Critical! “Smart money doesn’t chase, it positions. And let me tell you, these blue boxes could be the golden zones for long-term investors looking to catch the next big move.”
Why This Matters:
Blue Boxes = Key Demand Zones – If CDV, lower time frame breakouts, and volume profile confirm, these areas could be massive for accumulation.
Patience is Everything – We don’t buy just anywhere. We wait for confirmation and then strike with confidence. That’s how big money plays the game.
Potential for Huge Gains – Long-term setups like this don’t come often. When they do, you want to be in early, not chasing later.
Final Thoughts:
“I’m watching volume profile, CDV, and liquidity heatmap closely. The setup is forming, and when the confirmations roll in, this could be a monster move!”
Long-term traders, this could be your golden ticket! 🚀🔥
Let me tell you, this is something special. These insights, these setups—they’re not just good; they’re game-changers. I've spent years refining my approach, and the results speak for themselves. People are always asking, "How do you spot these opportunities?" It’s simple: experience, clarity, and a focus on high-probability moves.
Want to know how I use heatmaps, cumulative volume delta, and volume footprint techniques to find demand zones with precision? I’m happy to share—just send me a message. No cost, no catch. I believe in helping people make smarter decisions.
Here are some of my recent analyses. Each one highlights key opportunities:
🚀 RENDERUSDT: Strategic Support Zones at the Blue Boxes +%45 Reaction
🎯 PUNDIXUSDT: Huge Opportunity | 250% Volume Spike - %60 Reaction Sniper Entry
🌐 CryptoMarkets TOTAL2: Support Zone
🚀 GMTUSDT: %35 FAST REJECTION FROM THE RED BOX
🎯 ZENUSDT.P: Patience & Profitability | %230 Reaction from the Sniper Entry
🎯 DEXEUSDT %180 Reaction with %9 Stop
🐶 DOGEUSDT.P: Next Move
🎨 RENDERUSDT.P: Opportunity of the Month
💎 ETHUSDT.P: Where to Retrace
🟢 BNBUSDT.P: Potential Surge
📊 BTC Dominance: Reaction Zone
🌊 WAVESUSDT.P: Demand Zone Potential
🟣 UNIUSDT.P: Long-Term Trade
🔵 XRPUSDT.P: Entry Zones
🔗 LINKUSDT.P: Follow The River
📈 BTCUSDT.P: Two Key Demand Zones
🟩 POLUSDT: Bullish Momentum
🌟 PENDLEUSDT.P: Where Opportunity Meets Precision
🔥 BTCUSDT.P: Liquidation of Highly Leveraged Longs
🌊 SOLUSDT.P: SOL's Dip - Your Opportunity
🐸 1000PEPEUSDT.P: Prime Bounce Zone Unlocked
🚀 ETHUSDT.P: Set to Explode - Don't Miss This Game Changer
🤖 IQUSDT: Smart Plan
⚡️ PONDUSDT: A Trade Not Taken Is Better Than a Losing One
💼 STMXUSDT: 2 Buying Areas
🐢 TURBOUSDT: Buy Zones and Buyer Presence
🌍 ICPUSDT.P: Massive Upside Potential | Check the Trade Update For Seeing Results
🟠 IDEXUSDT: Spot Buy Area | %26 Profit if You Trade with MSB
📌 USUALUSDT: Buyers Are Active + %70 Profit in Total
🌟 FORTHUSDT: Sniper Entry +%26 Reaction
🐳 QKCUSDT: Sniper Entry +%57 Reaction
📊 BTC.D: Retest of Key Area Highly Likely
This list? It’s just a small piece of what I’ve been working on. There’s so much more. Go check my profile, see the results for yourself. My goal is simple: provide value and help you win. If you’ve got questions, I’ve got answers. Let’s get to work!

COMPcompound
a legendary project which to me it is totally undervalued
when you will see this graphics with dates and lines, what would you say in the comments.
i want you to give me your opinions.
lets go
