CROUSDT trading ideaCROUSDT is holding above the Immediate Demand Zone near $0.068. A successful defense here could trigger a bullish recovery targeting $0.166, $0.232, and possibly $0.881 if price breaks the long-term descending trendline and reclaims the Internal Supply Zone. However, a breakdown below this level cou

Crypto.com Poised for Growth Amid Strategic ETF PartnershipIn a significant development, Trump Media & Technology Group (TMTG), the parent company of Truth Social, has finalized a binding agreement with Crypto.com and Yorkville America Digital to launch a series of “Made in America” exchange-traded funds (ETFs). These ETFs will encompass a unique basket of

CRO - Building Block!Hello TradingView Family / Fellow Traders. This is Richard, also known as theSignalyst.
Let’s keep it simple!
📈 Short-Term Bullish:
CRO is currently hovering around a key weekly support level. As long as the $0.07 support holds, we can look for short-term long opportunities.
With bullish moment

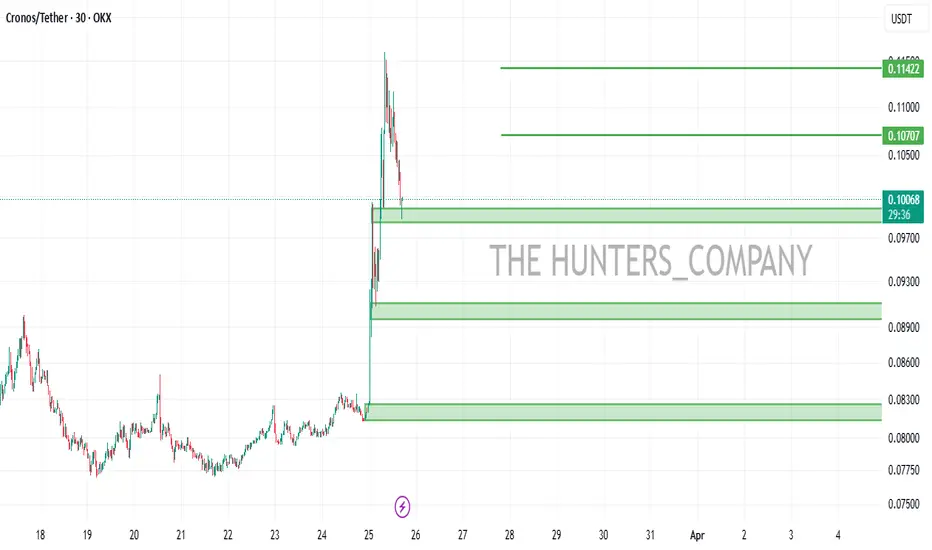
CRO/USDT : BUY LIMITHello friends
Given the good price growth, now in its correction, we can buy in steps with risk and capital management and move with it to the specified targets.
*Trade safely with us*
CROUSDT 1WCRO ~ 1W Analysis
#CRO Buy back from here, if you still have a Conviction on this Coin with a target short term minimum 15%+.

Cronos To Grow 1,500%, 2,500% Or More In 2025The same August 2024 support that led to a 250% rise is being activated again in February 2025. This will lead to a new and very strong rise. This time the bullish wave will be many times bigger compared to previous ones. Instead of 250% we might end up seeing 1,500%, 2,500% or more.
Good afternoon

CRO/USDT - 1:2 Risk/RewardMany traders, including myself, are often swayed by emotions when deciding on a trade—when to buy, where to take profits, or even falling into greed. That’s why I created this indicator, which has helped me overcome these habits.

Crypto.com (CRO)Cro usdt Daily analysis
Time frame daily
Risk rewards ratio >5.3 👈👌
Nothing to say
Chart is clear
Red line is historical support line

CRO DAILY UPDATE Cronos (CRO) is the native cryptocurrency token of Cronos Chain — a decentralized, open-source blockchain developed by the Crypto.com payment, trading and financial services company.
ANY THOUGHTS ON GETTEX:CRO ?
❤️ THIS POST AND I WILL SHARE NEXT pair

Cronos (CRO): Not Looking Good!Recently, Cronos broke the local support zone, where currently we are re-testing that same zone.
We are looking here for some liquidity grabs to happen and eventually a steep move to lower zones resulting in a break of structure and a movement to further lower zones here (towards next support zone

See all ideas
Summarizing what the indicators are suggesting.
Oscillators
Neutral
SellBuy
Strong sellStrong buy
Strong sellSellNeutralBuyStrong buy
Oscillators
Neutral
SellBuy
Strong sellStrong buy
Strong sellSellNeutralBuyStrong buy
Summary
Neutral
SellBuy
Strong sellStrong buy
Strong sellSellNeutralBuyStrong buy
Summary
Neutral
SellBuy
Strong sellStrong buy
Strong sellSellNeutralBuyStrong buy
Summary
Neutral
SellBuy
Strong sellStrong buy
Strong sellSellNeutralBuyStrong buy
Moving Averages
Neutral
SellBuy
Strong sellStrong buy
Strong sellSellNeutralBuyStrong buy
Moving Averages
Neutral
SellBuy
Strong sellStrong buy
Strong sellSellNeutralBuyStrong buy
Displays a symbol's price movements over previous years to identify recurring trends.