DigiByte Will Launch The 2025 Bull Market (2,753% Or 4,479% ???)Just for context. After a strong decline between mid-2019 and March 2020, DigiByte produced a 7,000%+ bullish wave. The cycle peaked in April 2021 and the rise had a duration of 413 days. A year and two months.
This info opens up some questions and gives fuel for some speculation:
» Will DigiByte

DigiByte Will Be A Market Leader (Top Performer) —Obey Me!Maybe you don't believe me or you disagree; do not argue with me, just listen to what I say. Grasp the meaning of my words; logic, understand.
This is the signal. DigiByte (DGBUSDT) tends to move first and it is already moving ahead. It closed green last week after some shakeouts while producing a

#DGB/USDT#DGB
The price is moving within a descending channel on the 1-hour frame and is expected to continue lower.
We have a trend to stabilize below the 100 moving average once again.
We have a downtrend on the RSI indicator, supporting the upward move with a break above it.
We have a resistance area

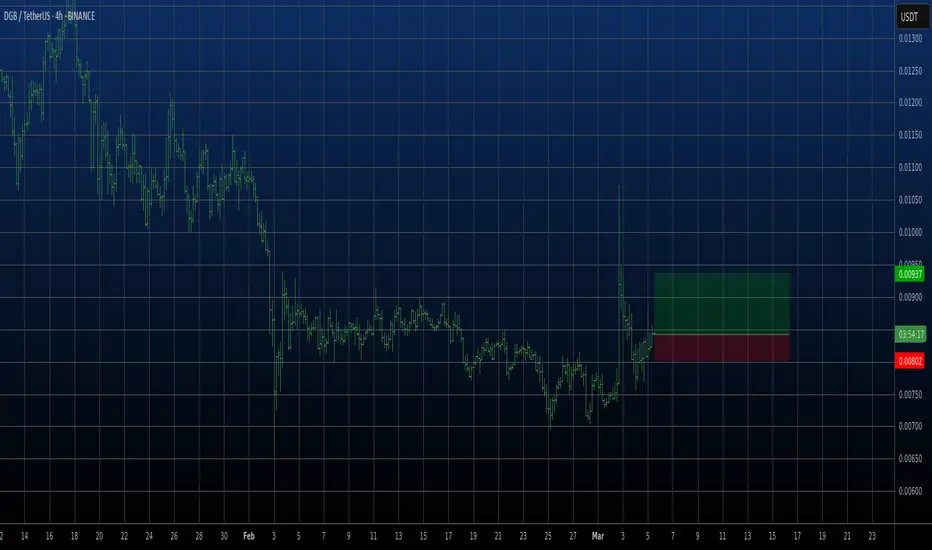
DGBUSDT 4hourPrice is currently moving in a falling channel which RSI has broke out. Buy signal has printed in 2 hour time frame. A good long opportunity to target channel high in short term.
Manage your risk and always use stoploss.

Long Entry Signal for DGB/USDT DigiByteMLR Nearing SMA: The MLR (blue) is below but approaching the SMA (pink), hinting at a potential bullish crossover.
MLR > BB Center: MLR exceeds the Bollinger Bands Center Line (orange), signaling growing bullish momentum.
PSAR: PSAR dots (black) are below the price, supporting an uptrend.
Price >

DGB DGB / USDT
1D time frame
analysis tools
____________
SMC
FVG
Trend lines
Fibonacci
Support & resistance
MACD Cross
EMA Cross
______________________________________________________________
Golden Advices.
********************
* Please calculate your losses before any entry.
* Do not enter any trad

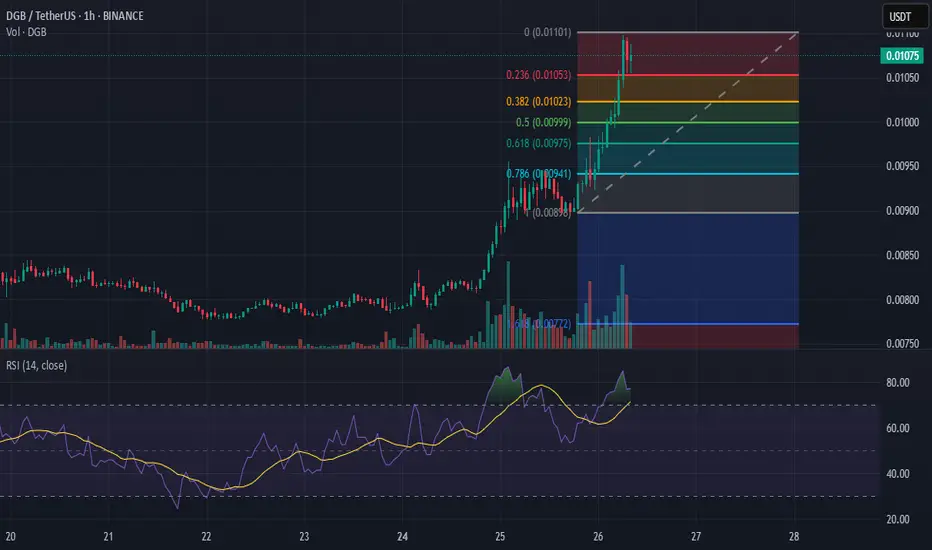
DGB/USDT Technical Analysis: Fibonacci Levels and RSI InsightsThe DGB/USDT pair on Binance is currently in a strong uptrend, as seen in the 1-hour chart. The price has surged, breaking key resistance levels and reaching 0.01078 USDT. The Fibonacci retracement levels suggest potential support at 0.618 (0.00975) and 0.5 (0.00999), which could act as buy zones if
Good moment for Buy DGBGood moment for Buy DGBUSDT We see the sideways channel borders widening. I think we will test the upper level again now. Good risk to reward ratio. Will see...
dgb breaking consolidation expecting 2x bullish wave after long consolidation finally dgb breaking falling wedge, dgb have another horizontal resistance, once both resistances got cleared, dgb can give solid rally after that, i,m expecting minimum 2x after successful breakout.

DGBUSDT(DigiByte) Updated till 08-03-25DGBUSDT(DigiByte) Daily timeframe range. we can see a steady move from its local low till now. trying to stay above 0.01028 as volume is decent here if it can than it can push further levels. if 0.01028 fails than back to local low.

See all ideas