Cup and handle pattern in weekly timeframeThe target of this pattern is 4.5 $
It's on weekly timeframe.
15 cent is strong support.
DOGEBULLUSD trade ideas

Dogecoin will reach 2$Chart Analysis:
1. Timeframe and Price Context
Timeframe: Daily chart (each candlestick represents 1 day of trading).
Price Levels:
The current price is $0.1798, as indicated on the chart.
The price range on the chart spans from approximately $0.0800 (early 2024) to a peak near $0.3000 (late 2024), followed by a correction to the current level.
Trend Overview:
Early 2024: Dogecoin starts around $0.0800 and experiences a gradual uptrend with volatility, eventually rallying sharply.
Late 2024: The price peaks near $0.3000 before correcting downward into a consolidation phase.
Early 2025: The price is consolidating within a symmetrical triangle, with the current price at $0.1798.
2. Key Patterns and Annotations
Symmetrical Triangle:
The chart shows a symmetrical triangle pattern, which is a neutral consolidation pattern that typically signals a continuation of the prior trend (in this case, an uptrend).
Upper Trendline: A descending trendline starting from the $0.3000 peak, acting as resistance.
Lower Trendline: An ascending trendline starting from the $0.0800 low, acting as support.
The price is near the apex of the triangle, indicating an impending breakout (upward or downward).
Breakout Prediction:
An upward arrow with the annotation "TG 1 $5" suggests a bullish breakout targeting $5.00—a highly ambitious target representing a ~2,680% increase from the current price of $0.1798.
"FATE LOVES IRONY":
The image and text "FATE LOVES IRONY" (featuring a Doge meme with a spiral sun and flames) likely reflect a playful or ironic sentiment often associated with Dogecoin’s community. It may imply that despite Dogecoin’s origins as a meme coin, it could defy expectations with a massive rally—an ironic twist.
3. Support and Resistance Levels
Support:
The lower trendline of the symmetrical triangle (around $0.1400-$0.1600) has acted as support during the consolidation phase.
If this support breaks, the next significant level could be around $0.0800-$0.1000 (a prior support zone from early 2024).
Resistance:
The upper trendline of the triangle (around $0.2000-$0.2200) is the immediate resistance.
Beyond that, $0.3000 (the recent high) is a major resistance level.
The $5.00 target is a long-term, speculative goal far beyond current levels.
4. Volume and Momentum (Not Visible but Inferred)
Volume bars are not clearly visible, but typical behavior suggests:
Volume likely increased during the rally to $0.3000 and decreased during the consolidation phase within the triangle.
A breakout would require a volume spike to confirm, especially if the price breaks above the upper trendline (around $0.2000-$0.2200).
Momentum indicators (e.g., RSI or MACD) could indicate whether Dogecoin is oversold or showing bullish divergence, supporting a breakout.
5. Potential Scenarios
Bullish Breakout:
If Dogecoin breaks above the upper trendline (around $0.2000-$0.2200) with strong volume, it could confirm a bullish breakout.
The first target would likely be the prior high of $0.3000 (a ~67% move from $0.1798). The $5.00 target, while ambitious, would require extraordinary momentum, likely driven by significant market catalysts (e.g., meme coin hype, endorsements, or broader market rallies).
Bearish Breakdown:
If the price fails to break the upper trendline and instead drops below the lower trendline (around $0.1400-$0.1600), it could signal a bearish breakdown.
The next support at $0.0800-$0.1000 could be tested, potentially leading to further downside.
Consolidation:
If the price remains within the triangle (between $0.1600 and $0.2200), it might continue to consolidate until a catalyst triggers a breakout.
6. Market Context
Meme Coin Dynamics: Dogecoin is heavily influenced by retail sentiment, social media hype, and endorsements (e.g., from figures like Elon Musk). The "FATE LOVES IRONY" annotation captures the speculative and ironic nature of Dogecoin’s potential for massive gains despite its meme origins.
Broader Market Trends: Dogecoin often correlates with Bitcoin and Ethereum (as seen in your previous charts). If BTC and ETH break out (e.g., BTC to $120,000, ETH to $4,000), it could create a bullish environment for altcoins and meme coins like DOGE.
Timing: The chart’s position near the triangle’s apex suggests a breakout could occur within days to weeks on a daily timeframe.

DOGE close to the EMA 200!Doge has only dipped bellow the EMA 200 in bear markets. We are getting close to that level. It would be very profitable buying at that level or bellow. Get some coins now at this uncertain moment.

DogeCoin buy signal (DogeUSDT)Hello dear traders.
I just got a Dogecoin buy signal, and the chart is showing strong bullish momentum for the short term. Key indicators suggest an upward breakout, with increasing volume and positive price action. If the trend holds, we could see a solid move to the upside soon! 🚀I just got a Dogecoin buy signal, and the chart is showing strong bullish momentum for the short term. Key indicators suggest an upward breakout, with increasing volume and positive price action. If the trend holds, we could see a solid move to the upside soon! 🚀
Please do you own research before place a trade
What da' the dog doing?The idea is very self explanatory.
The chart is saying that it is the time for DOGE to fly again.
Doge needs to hold the ~20 cents zone for the rest of March.
April is around the corner. Every 4 years, it brings new surprises!

DOGE: Falling WedgeDOGE is showing a falling wedge pattern on the price action and the RSI. I'd expect a bounce by April.
Invalidated below $.14


Doge Weekly AnalysisStructure is still bullish on a weekly timeframe.
Looking at these areas to manage risk.
Once the market shows signs of reversal on a lower timeframe it’s hammer time.
What is hammer time?
A bullish Break of Structure or Change of Character on a timeframe of 4HR or above. Until then I am patient.

Expecting a bounce at the core of the Gaussian!Yes I believe we could be bouncing close to the core of the channel. It might be having some consolidation but at the core of the Gaussian is UP ONLY!
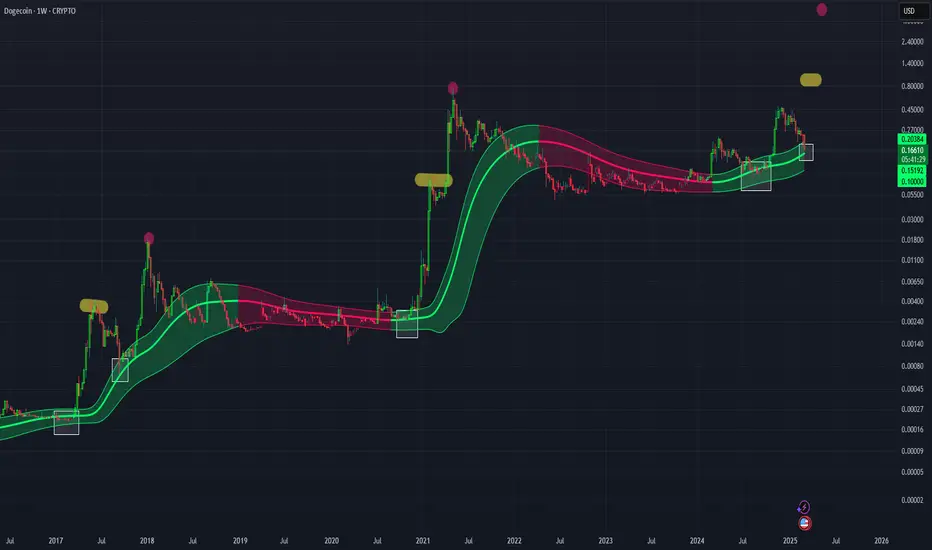
Dogecoin once in a lifetime opportunity to scoop more!I believe that Doge might be having one of the holy grail moments to get in and scoop even more. Looking like in 2017 when a correction made the the price dip bellow the guppy emas in a bull market trend (green emas). I am buying more for sure. Be greedy when others are fearful!

DOGE Strong BUY. Next stop $0.90Dogecoin / DOGEUSD is trading inside a Channel Up for exactly 1 year and the price is currently very close to its bottom.
The bearish wave is under the 1day MA200 with the 1day RSI oversold, which is exactly the conditions that were present on the August 5th 2024 bottom.
This is an excellent long term buy opportunity, potentially the last one that will lead DOGE to its Cycle Top.
The natural technical target is the 1.618 Fibonacci extension, which is what the prior bullish wave targeted.
Buy and target 0.9000.
Follow us, like the idea and leave a comment below!!

(DOGE) dogecoinfor dogecoin holders in the world to see a bit of pay per view imagery to make their mouth water. The colors, the picture, the imagery; ooh la la.

Predicting a run up into the 17th Pulling back into May.Don't panic, be prepared for extreme liquidations from over leveraged trades till all the pigs are slaughtered. Throw on your big ball trades But use a Support that wont break your bank


Why I Believe Dogecoin (DOGE) is Going to RiseAfter analyzing Dogecoin (DOGE), I believe it has significant potential to increase in value for a few key reasons:
Strong Community Support – Dogecoin has one of the most passionate and active communities in the crypto space. This strong support leads to continuous growth in awareness, use, and adoption, which drives its value up.
Increased Recognition – With more celebrities and influential figures like Elon Musk showing support, Dogecoin is getting the exposure it needs to stand out. This visibility is attracting new investors and users.
Use Cases in Transactions – While it started as a meme coin, Dogecoin has evolved with real-world use cases, including tipping and microtransactions. As more businesses and platforms accept DOGE, its value is likely to rise.
Celebrity Backing and Media Attention – Dogecoin’s rise in popularity has been fueled by media buzz and endorsements, particularly from figures like Elon Musk. This attention gives it a unique advantage in attracting new investors.
Low Entry Price – Dogecoin’s relatively low price compared to other major cryptocurrencies makes it an attractive option for newcomers, allowing a broader group of investors to get involved.
Conclusion:
Given its passionate community, growing recognition, and increasing use cases, Dogecoin has a strong potential to grow. I believe its value will rise as more people get behind it and as it continues to gain real-world utility.
Mvh Mert Arslan


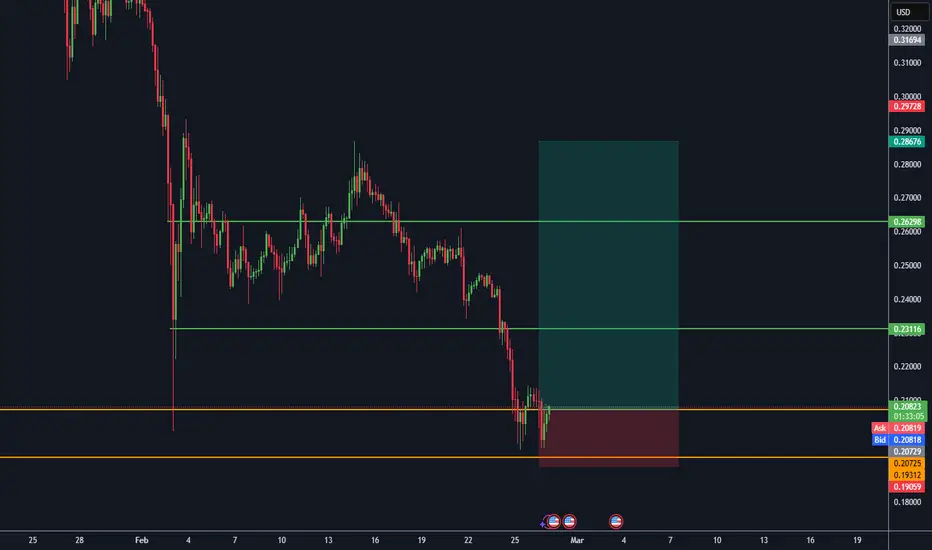
DOGEUSD BUY ANALYSIS SMART MONEY CONCEPT Here on Dogeusd price form a demand around area of 0.19019 and is likely to go up as more buyers may come and push the price up so trader should go for long with expect profit target of 0.21218 and 0.23269 . Use money management

WE ARE STILL SOOOO EARLY IN THE CYCLE!!!I think we are still earlier in the cycle than most people realize. I think DOGE is here in the cycle. If this is correct, this BULL RUN will be bigger than anyone thinks!!!


DOGE update#DOGE made a huge descending wedge which is a bullish signal i think that if the market crosses the confirmation line its able to rise to the next supply zone

Bullish Trading Signal Overview for Dogecoin (DOGE)Dogecoin (DOGE) indicates a bullish trading signal. After a prolonged downtrend, we observe a significant reversal pattern with the latest green candle forming a strong bullish engulfing pattern. This pattern encapsulates the previous red candle entirely, suggesting a strong buying momentum and a potential shift in market sentiment from bearish to bullish.
Key Observations:
Support Level: The chart shows a recent bounce from a low of approximately $0.20914, which now acts as a critical support level. The rebound off this support suggests that the market is rejecting lower prices, adding credibility to the bullish momentum.
Current Price: The current price is marked at around $0.23907, showing a noticeable recovery from the support level.
Volume: Although not explicitly shown on the chart, the bullish candle's size suggests increased buying activity, which typically indicates rising interest and a potential continuation of the upward trend.
Stop-Loss: A stop-loss has been strategically placed just below the recent low at $0.20032, a prudent move to protect against any sudden reversal in the downtrend.
Profit Target: The profit target is set at $0.27152, located near a previous area of resistance. This target anticipates a reasonable upswing without reaching for the peak, making it a realistic and achievable goal.
Trading Strategy Recommendation
Considering the bullish engulfing pattern and the subsequent recovery, entering a long position at the current level or on a slight dip towards the support level seems promising. The stop-loss placement below the recent low limits potential losses, while the profit target provides a favorable risk/reward ratio.
Entry Point: Around the current price of $0.23907 or on minor pullbacks.
Exit Strategy: Aim for the profit target of $0.27152 while maintaining flexibility to adjust as the price action develops, particularly if the market sentiment continues to strengthen.
Conclusion
The technical setup for Dogecoin (DOGE) suggests a strong bullish potential in the short term. Traders should monitor volume and price action closely for further confirmation of continued bullish behavior. Always adhere to a disciplined trading plan with defined stop-loss and take-profit levels to manage risks effectively.

DOGEUSD Coin LongDOGEUSD is not net-long regression break.
It was a large move over night in the whole crypto world.
I am considering my options vs other CRYPTO pairs

DOGE: Is the bottom in?This weekend looks like the crypto God candle weekend for the majors. Doge is also looking strong, but chance of it being part of the US strategic reserve is slim to none. But, when tide is rising, it doesn't matter. Right now, the challenge in front of doge is to get out of the downward channel, and fast. The price action has two bullish scenarios left. Depending on how strong the momentum gets, one or the other should come to pass.
1. Ending diagonal (pink): The price action for both intermediate 1 and Minor 1 can be counted as 3 waves zigzag or five waves and be valid. This is something that EW sometimes cannot paint a clean picture until a lot of time passes. But as traders, we need to just figure out the next move and be prepared. In case doge is playing out an ending diagonal pattern, then we should see 3 waves moves to the upside. And since, it is an expanding diagonal, we should see wave 5 is larger than wave 3. So, as a normal range of 1 to 1.236 extension, price should top out between $1.1 to $1.6. The confirmation will be a sharp decline from the top.
2. Wave 3 of 3 of 5 (blue): probability of this should be greater with a strong momentum to the upside. We should see price rocket out of the channel and get to all time high before a meaningful pullback. Price should break through $1 milestone and go higher without stopping for a breather as we have seen in the previous rocket moves. Target will be $6-$10 and level of insanity will be at its peak!
How to trade between the two scenarios: The difference of targets between the two scenarios is massive. We don't want to take a risk of losing all the gains in matter of days, nor do we want to stay on the sidelines when price makes 6x gains in matter of weeks. So, to stay safe, it is important to take some profit between 1 - 1.236 fib extension (at least 25% - 30%) and put a stop loss at $0.48 for the rest. There could be other higher areas to put the stop loss to phase out with more gains, but $0.48, which is the top of minor wave 1, and breaking that will be the confirmation of the top. If price doesn't make it to that level and goes back up to make strong highs, then buy back in at the breakout (this would be one of the scenarios where we can buy a breakout) to jump back on the ship and ride the lightning.
Bear case: There is always the other side of the coin. If price fails to break above $0.28 and the channel, then chances are, the downtrend will continue. It can keep going down to find support at the trend lines. If the trend lines break, then chance of primary wave 4 still in play goes higher. Target can be anything till $0,018. Hope that is not the case...
