Another fallGiven the past trends, there's an overwhelmingly high probability that we will witness another 50% drop or even the complete demise of DOT. It seems like everything is spiraling out of control, and there’s little hope left for any positive outcome. This could very well be the end.
DOTBTC trade ideas

How polkadot Version 2.0 Will Eliminate CompetitorsWhy Polkadot is the Best Blockchain and How Version 2.0 Will Eliminate Competitors
As blockchain technology evolves and numerous networks emerge, the need for a system that can connect and optimize collaboration between them becomes increasingly essential. Polkadot is one of the most advanced and promising blockchain projects, aiming to create an internet of blockchains. With the release of its second version, Polkadot is expected to solidify its position as the best blockchain and outperform many of its competitors.
In this article, we’ll explore why Polkadot is the best blockchain and how its Version 2.0 will eliminate rival networks.
1. Multichain Architecture
Polkadot's unique architecture allows different blockchains to work in parallel. This feature significantly reduces scalability and transaction speed issues that plague traditional blockchains like Ethereum and Bitcoin.
How Version 2.0 Improves This Architecture
In Polkadot 2.0, the focus is on optimizing cross-chain communications and increasing both vertical and horizontal scalability. This not only boosts transaction capacity but also enables more chains to interact seamlessly while maintaining their independent functionality.
2. Interoperability
One of the biggest challenges for traditional blockchains is the lack of interoperability, or the ability to exchange data and value across different networks. Polkadot solves this problem with its Relay Chain, which facilitates communication and data exchange between different chains.
Improvements in Version 2.0
Polkadot 2.0 will introduce new protocols for faster and more secure cross-chain communication. This advancement will render many standalone blockchains obsolete, driving developers and users towards Polkadot.
3. Shared Security
One of Polkadot’s key advantages is its shared security model, allowing connected chains to benefit from the overall security of the network without needing to establish separate security mechanisms.
Enhanced Security in Version 2.0
Version 2.0 will implement new consensus algorithms and increase the number of active nodes, significantly enhancing the network's security. This will make it difficult for competing blockchains with weaker security models to remain competitive.
4. Advanced Governance
While many blockchains struggle with governance and decision-making, Polkadot offers a flexible and dynamic governance system that allows users and developers to actively participate in managing and developing the network.
Governance in Version 2.0
Polkadot 2.0 will introduce a model of instant and decentralized governance, enabling rapid decision-making with the participation of all stakeholders. This makes Polkadot highly dynamic and efficient, outpacing competitors in terms of adaptability and governance.
5. Strong Community and Ecosystem
Polkadot is not just a powerful technology but also hosts a large and active ecosystem of developers, startups, and various projects. This ecosystem is continuously growing, and the release of Version 2.0 will accelerate this growth.
Conclusion: Why Polkadot Will Eliminate Competitors
Polkadot 2.0, with its focus on high scalability, fast cross-chain communication, enhanced security, and dynamic governance, will far surpass existing blockchains. Many projects currently operating on other networks will likely migrate to Polkadot due to the limitations of their current platforms.
With these advantages, Polkadot is well-positioned to become the default blockchain for next-generation projects and will likely push many of today’s competitors out of the market.
good luck

DOT - BIG PUMPDear My friends,
I may have overlooked DOT. Watching BTC's strong growth in recent days, alongside the major coins soaring, I’m reminded of XRP from my previous analysis—it has broken out and is on the rise. As I continued to evaluate other coins, I noticed DOT in comparison to BTC. I discovered a divergence between the price and the RSI indicator on the weekly chart. I’m not sure what news may come for DOT in the near future, but from a technical analysis perspective, I have no doubts and forecast that DOT will likely surge strongly in the days ahead. Based on its correlation with BTC, I believe DOT’s price could increase by at least 3 to 8 times in the near future. This is not financial advice, but it is my personal conviction in DOT’s recovery, and I wanted to share it with you all.
Best Regards,

Possible DOT journey in the next monthsIf DOT closes (green candle) above the first PINK box, then the journey to the way up will start for DOT.
Possible targets are marked in the pink box.
Notice that we first need the first lower pink) box to be crossed.
Later I have displayed possible targets. It does not mean that it will reach the 3 targets.
If each upper pink box is crossed, then we can expect the next target to be achieved.
My trading approach : I don't use stop loss, I keep crypto and cash on my pockets all the time, expecting lower prices to buy more. Summing up: Selling on the way up and purchasing on the way down.
This is my plan. I don't expect you to follow it. I put this just for entertainment and having a laugh in the next weeks months when this trade is validated or invalidated when we press the PLAY button :)

Sell Signal for DOTBTCWe have identified a Sell opportunity for the DOTBTC trading pair using our EASY Quantum Ai strategy.
Trade Details:
- Enter Price: 7.35E-05
- Take Profit: 7.187E-05
- Stop Loss: 7.527E-05
Analysis:
Our prediction is based on recent market analysis and the unique capabilities of our EASY Quantum Ai strategy. This method employs advanced algorithms to evaluate real-time market data, considering essential indicators and patterns.
1. Momentum Analysis: The momentum indicators suggest a declining trend, with increased volatility in recent sessions, indicating potential downward pressure on DOTBTC.
2. Volume Trends: There's been a noticeable increase in sell volumes, which aligns with our sell signal. High sell volumes often act as a precursor to a downward price action.
3. Resistance Levels: The pair failed to break through key resistance levels recently. This resistance and subsequent bearish patterns have reinforced our expectation of a price decline.
Take advantage of this potential movement, keeping a close watch on market dynamics. Implement risk management by adhering to the set Stop Loss and Take Profit levels. Always perform diligent research before acting on trading signals for optimal results.

Polkadot: No Bottom Confirmed (Professional Level Trading)Here is a chart where we do not have a bottom. We do not have a bottom pattern and no reversal signals. There is no bullish breakout, no rising volume, nothing. We can find something by looking at some indicators but all these signals would be weak.
Now, consider this, how far lower can it go?
We've seen how a strong bullish breakout, a surprise move, can produce 20%, 30% or even up to 50% in a single candle. After this move, we get some normal growth; slow and steady growth. It is very hard to anticipate or predict a bottom. It is easy to find one after it already formed.
If we are looking to position ourselves for the major 2025 bull-market, we can consider buying even before we get confirmation that the bottom is in. How far lower can it go?
Even if it were to drop by 10%, 20% or 30%, this isn't much compared to the bigger picture. If it drop by this much in a sudden move or flash crash, it would recover right away. If it were to move lower slowly, it would only last 1-2 months before the next market phase, and thus we are ready to buy, to accumulate.
When nobody is looking;
When the chart is low and red;
When the market is quiet;
That's the best time to enter a LONG trade.
In a chart like this, we buy and hold thinking of the long-term.
If prices drop, we have two options: 1) Wait patiently for the recovery and development of the next market phase; 2) buy more if our financial situation permits and to enjoy even better and higher growth potential in the upcoming bullish wave.
We can only approach this chart, this pair and this market in this way because we have an edge. Our edge is the ability to read the charts. If you can read the charts, you don't need to chase a 1% move nor to be in front of a computer 24-7 while you damage your eyes, your brain and your health. You just need to catch a few of these 500%-700% moves and this is enough to make a real change.
Remember, success in trading is not achieved by winning 9 out of 10 trades.
You just need to be calmed and detached, wait for the right time and catch the bottom, or close to the bottom, and then just buy and wait.
The buying and selling is mostly a big myth. It only leads to loss, stress and pain long-term. When you work on your mind and study, just waiting, the right opportunity tends to show up at the right time. This is what we are doing here.
We are not looking at this pair while it is green, rising and everybody is out of control. Notice how calm everything is now... That's the signal. Buy when nobody wants to buy. Sell when everybody is rushing to buy because the mass tends to be wrong.
It is not really about the mass being right or wrong, it is about buying low and selling high.
Thanks a lot for your support.
I am wishing you success.
I will continue writing for you daily until the next bull-market reaches it end.
Thank you for reading.
Namaste.


dot looks bullish with btc pair seems like dotbtc has already bottomed out and finally ready for solid recovery
dotbtc was consolidating in falling wedge for last few years now recently breakout confirmed massive bullish rally can start now
expecting 200 to 250% bullish rally in coming weeks


DOT/BTC , Accumulation zone?The price has been pushed to the plinth, the information space regarding the active is silent!
Will the formation of the accumulation zone or the reaction and food news, consistently upward growth?
The price is down 88.22% from its high.
We've been in a downtrend for 722 days.
Is it all that bad? I suggest you also watch the DOT/USDT publication.
Crab pattern.
(Create the illusion of a commodity that has no price. Buy what is based on your analysis, do not be manipulated! They turn your head in the other direction, in the direction of the spectacle, while backstage they are preparing the next scene for you!).

Is It Finally Time To Buy DOT As Polkadot 2.0 is Coming? hello dear trader and investors
do you know( polkadot v2) faster than sol and kadena?
Is It Finally Time To Buy DOT As Polkadot 2.0 is Coming?
it is time for polkadot ’s rally
Polkadot 1.0 vs 2.0 —
A comparison between Polkadot 1.0 and Polkadot 2.0 highlights significant differences. The transition from slot leasing to a cumulative asset model will enable smaller projects to access Polkadot’s infrastructure without committing millions of dollars or locking up tokens for extended periods.
The number of available parachain slots is expected to increase from a limited 50 to a range of 500 to 1,000 cores, further expanding Polkadot’s capacity to onboard projects.
Polkadot 2.0 Launch Date —
Gavin Wood, Polkadot’s founder, has been actively involved in developing Polkadot 2.0.
While the technology is expected to be ready by late 2023, the official upgrade and release will occur in early 2024.
This timing aligns with the end of the major DOT unlock events, potentially setting the stage for a new wave of positive sentiment.
Polkadot 2.0’s new system for allocating block space could increase liquidity for the DOT token. Revenue generated from core time sales will be channeled into the Polkadot Treasury, and token holders will have a say in how these funds are distributed through governance. Periodic token burns are also being considered, which could make DOT deflationary and positively impact its price.
good luck

PolkadotbtcMarket cycle theory..
We are at lol oversold myby?
4.6x potential vs btc from here this cycle
Heard polkadots github commits have been the highest most of the bear market, and that the number of staked dot tripled in the last few weeks so this could genuinely be the fundamental oversold chart low..
Total 3 is poised for a break upwards also...

DOT/BTC - Polkadot: Elliott_Wave_12345◳◱ Hey traders, we've identified an Elliott Wave 12345 pattern on the CRYPTOCAP:DOT / CRYPTOCAP:BTC chart. This pattern is a bullish indication and could indicate a potential trend reversal. The next resistance key levels are at 0.0001387 | 0.0001453 | 0.0001588 and the major support zones are respectively at 0.0001252 | 0.0001183 | 0.0001048. We may consider buying at the end of wave 5 at the current price level at 0.000123.
◰◲ General info :
▣ Name: Polkadot
▣ Rank: 16
▣ Exchanges: Binance, Kucoin, Huobipro, Gateio, Mexc, Bittrex
▣ Category/Sector: Infrastructure - Smart Contract Platforms
▣ Overview: Polkadot is a blockchain network designed to support various interconnected, application-specific sub-chains called parachains (short for parallelized chains). Each chain built within Polkadot uses Parity Technologies' Substrate modular framework, which allows developers to select specific components that suit their application-specific chain best. Polkadot refers to the entire ecosystem of parachains that plug into a single base platform known as the Relay Chain. This base platform, which also leverages Substrate, does not support application functionality but instead provides security to the network's parachains and contains Polkadot's consensus, finality, and voting logic.
◰◲ Technical Metrics :
▣ Mrkt Price: 0.000123 ₿
▣ 24HVol: 30.472 ₿
▣ 24H Chng: 1.653%
▣ 7-Days Chng: 8.05%
▣ 1-Month Chng: 3.68%
▣ 3-Months Chng: -18.54%
◲◰ Pivot Points - Levels :
◥ Resistance: 0.0001387 | 0.0001453 | 0.0001588
◢ Support: 0.0001252 | 0.0001183 | 0.0001048
◱◳ Indicators recommendation :
▣ Oscillators: NEUTRAL
▣ Moving Averages: STRONG_SELL
◰◲ Technical Indicators Summary : SELL
◲◰ Sharpe Ratios :
▣ Last 30D: -20.72
▣ Last 90D: -21.56
▣ Last 1-Y: -17.79
▣ Last 3-Y: -16.90
◲◰ Volatility :
▣ Last 30D: 0.30
▣ Last 90D: 0.31
▣ Last 1-Y: 0.50
▣ Last 3-Y: 0.87
◳◰ Market Sentiment Index :
▣ News sentiment score is N/A
▣ Twitter sentiment score is 0.63 - Bullish
▣ Reddit sentiment score is 0.65 - Bullish
▣ In-depth DOTBTC technical analysis on Tradingview TA page
▣ What do you think of this analysis? Share your insights and let's discuss in the comments below. Your like, follow and support would be greatly appreciated!
◲ Disclaimer
Please note that the information and publications provided are for informational purposes only and should not be construed as financial, investment, trading, or any other type of advice or recommendation. We encourage you to conduct your own research and consult with a qualified professional before making any financial decisions. The use of the information provided is solely at your own risk.
▣ Welcome to the home of charting big: TradingView
Benefit from a ton of financial analysis features, instruments and data. Have a look around, and if you do choose to go with an upgraded plan, you'll get up to $30.
Discover it here - affiliate link -

📈📊 #ChartPattern Alert! 📈📊 📈 Falling Wedge 📈📈 What is a Falling Wedge? The Falling Wedge is a bullish chart pattern characterized by two converging trendlines, with the lower trendline sloping upward more than the upper trendline. It typically signals a potential bullish reversal, with the price likely to break upward after the wedge pattern.
📈 How to Identify:
Draw a trendline connecting at least two higher highs (upper trendline).
Draw another trendline connecting at least two higher lows (lower trendline).
📈 What it Signals: The Falling Wedge suggests a potential bullish reversal, with buyers gaining strength as the price reaches higher lows within the wedge. It often forms during downtrends and can precede a significant price move to the upside.
📈 Trade Strategy:
Consider buying when the price breaks above the upper trendline of the Falling Wedge.
Set profit targets based on the pattern's height added to the breakout point.
Implement a stop-loss to manage risk in case of a false breakout.
Remember to validate your analysis with other technical indicators and conduct thorough research before making any trading decisions. Happy charting and trading! 📈💹

Polkadot/Bitcoin - Monthly Time FrameBINANCE:DOTBTC - 1M
Hello everyone,
Supply and Demand Zone:
As you Can See DOT/BTC is Almost Correcting itself 100% of the Rally(Up Trend), So we Gonna face 2 possibilities:
A: Correction's Done and after a bit of "RANGE", we are gonna go upward again
OR
B: the Down-Trend is gonna be continued to the "Lower Low", RETEST the "Major SUP and keep falling Down
Trend-Line:
As you Are looking at the Trend-Line,
IF we manage to Break-out The Trend-Line and Retesting it, Price will defiantly go towards the "Supply and Demand Zone", Range for awhile there and again UP towards the "ATH".
OR
The Trend-Line is not gonna be Broken-out and the new "LOWS" are gonna be discovered!
Lets see :)

#DOT/BTC - Long - Potential 1.51%Direction: Long
Market: Spot
Risk: 0.25% - 1%
#BTC_DOT
Exchange: BINANCE
Timeframe: 360
TP1: 0.0002012
Entry: 0.0001982
STOP: 0.0001952
Entry Conditions:
| Trendline break - tight targets as recent range has been limited.

DOT/BTC - Polkadot: Triangle_&_Wedge◳◱ Our analysis has revealed a Triangle & Wedge pattern on the MIL:DOT / CRYPTOCAP:BTC chart, signaling a period of consolidation as the price moves within the confines of this pattern. The next resistance key levels are at 0.0002012 | 0.0002053 | 0.0002129 and the major support zones are respectively at 0.0001936 | 0.0001901 | 0.0001825. A potential trend change could emerge upon a breakout from this pattern. As such, we may consider buying at the current price and aim for higher levels above the breakout level.
◰◲ General info :
▣ Name: Polkadot
▣ Rank: 13
▣ Exchanges: Binance, Kucoin, Huobipro, Gateio, Poloniex, Mexc
▣ Category/Sector: Infrastructure - Smart Contract Platforms
▣ Overview: Polkadot is a blockchain network designed to support various interconnected, application-specific sub-chains called parachains (short for parallelized chains). Each chain built within Polkadot uses Parity Technologies' Substrate modular framework, which allows developers to select specific components that suit their application-specific chain best. Polkadot refers to the entire ecosystem of parachains that plug into a single base platform known as the Relay Chain. This base platform, which also leverages Substrate, does not support application functionality but instead provides security to the network's parachains and contains Polkadot's consensus, finality, and voting logic.
◰◲ Technical Metrics :
▣ Mrkt Price: 0.0001997 ₿
▣ 24HVol: 36.868 ₿
▣ 24H Chng: 0.352%
▣ 7-Days Chng: -2.09%
▣ 1-Month Chng: -12.91%
▣ 3-Months Chng: -20.98%
◲◰ Pivot Points - Levels :
◥ Resistance: 0.0002012 | 0.0002053 | 0.0002129
◢ Support: 0.0001936 | 0.0001901 | 0.0001825
◱◳ Indicators recommendation :
▣ Oscillators: NEUTRAL
▣ Moving Averages: NEUTRAL
◰◲ Technical Indicators Summary : NEUTRAL
◲◰ Sharpe Ratios :
▣ Last 30D: -3.20
▣ Last 90D: -1.79
▣ Last 1-Y: -0.51
▣ Last 3-Y: -0.01
◲◰ Volatility :
▣ Last 30D: 0.39
▣ Last 90D: 0.58
▣ Last 1-Y: 0.76
▣ Last 3-Y: 1.60
◳◰ Market Sentiment Index :
▣ News sentiment score is 0.44 - Bearish
▣ Twitter sentiment score is 0.63 - Bullish
▣ Reddit sentiment score is 0.49 - Bearish
▣ In-depth DOTBTC technical analysis on Tradingview TA page
▣ What do you think of this analysis? Share your insights and let's discuss in the comments below. Your like, follow and support would be greatly appreciated!
◲ Disclaimer
Please note that the information and publications provided are for informational purposes only and should not be construed as financial, investment, trading, or any other type of advice or recommendation. We encourage you to conduct your own research and consult with a qualified professional before making any financial decisions. The use of the information provided is solely at your own risk.
▣ Welcome to the home of charting big: TradingView
Benefit from a ton of financial analysis features, instruments and data. Have a look around, and if you do choose to go with an upgraded plan, you'll get up to $30.
Discover it here - affiliate link -

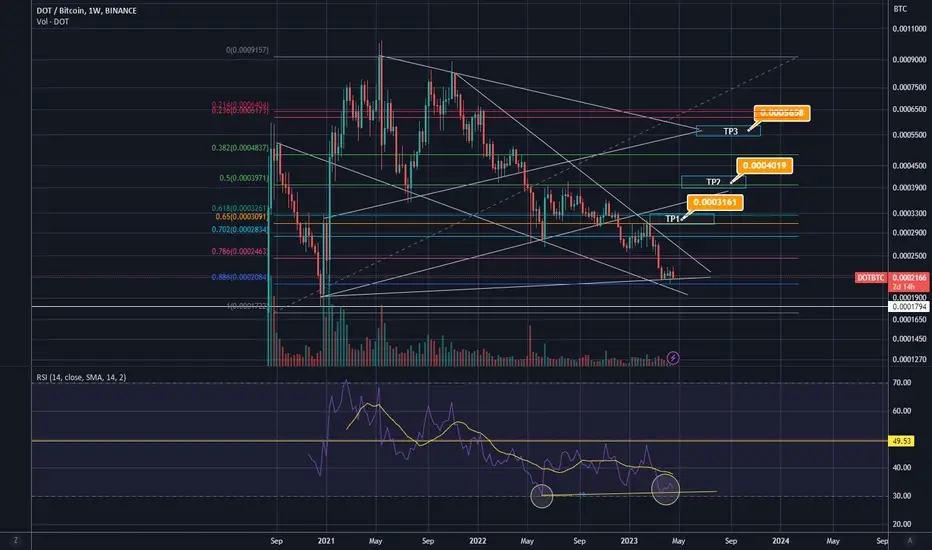
DOTBTC 2023 outlook Polkadot price actionTime to look at my favourite altcoin and it's pretty dismal perfomance over the last year agaisnt BTC
I've outlined my basic outlook on the weekly chart using candle stick closes and Log fibs. Coincidentally its touched the .886 retrace to the T. Typical sign of weak altcoins to retrace all the way back to the .886 level. I'm pretty confident the bottom for DOT/BTC is in based on this and the fact that its nearly an 80% correction from ATH vs BTC
My mid term outlook is bullish (for a change) Looking at best case scenario retrace up to .618 from ATH placing it at the .0004830 sat region
I've marked out 3 different TP below and above this level respectively as I've become accustomed to DOT usually underperforming against market competitors. So my TP is more conservative vs others. With the exception of TP3 being higher as I see this as an ATH for this market cycle
Some thoughts on DOT
Personally this is my favourite altcoin of them all. Admittedly one should not have emotion when it comes to trading as we're all here to make money and not love
My bias is fundamentally based and I will probably always keep staking my DOT from my ledger for years to come
Point 1 - Its not a security, this gives institutional interest and clarity on adding it to their basket or portfolio
Point 2 - Highest DEV activity compared to other L1 : Link : www.thecoinrepublic.com
Point 3 - Interoperability (future proof)
Point 4 - Staking offline (my personal favourite)
Point 5 - Gavin Wood (some food for thought for the ETH maxi's)
There are more use cases to be made however one can only consider an argument valid if you can argue from both ends, So my concern for this project is as follows:
Point 1 - Concensus mechanism too slow. One of my dear friends informed me they wanted to launch TAO on their parachain but it was too slow for their timeline, in turn they self funded the crowdloan
Point 2 - Inflation. As great as APR is with Staking this shows inflation in the ecosystem and given that DOT has no FINITE market cap it can dampen price action in future
I'll be adding my DOT/USDT analysis to this post and updating it over time. As this is afterall my favourite ))
$DOTBTC Hinting capitulation and upcoming strong reaction.Huge sparse falling wedge, approacing historical static support sitting close to the 0.00018 mark.
Good spot for accumulation on further weakness, R:R. 2:1+.
Long term trade, 0.0004 target (x2). For starters.
To be re-evaluated in 3-6 months.

dotdot/btc
step by step i will try to share my ideas, but i like to see the s2 first
then start to test the resistance 1 by 1
also angel 1 changed to 2
share your ideas with me
tnx.
