DOTUSD.PM trade ideas

DOTUSD long-term channel and arcs within channelIt seems impossible given the boring price action on DOT lately..
However, the current dominant arc is telling us a move to $95-120 is happening within the next month.
Looking at the longer-term patterns, we can see it has all been happening exactly according to the patterns.
That smaller arc had almost perfect touch points all the way, almost too perfect!
It was clearly broken to the upside and now we see a retest of that arc.
The larger arc in play now had some long wicks on the slide down that vary on different exchanges, so there is some room to extend the right side of the arc out longer, depending how you draw it. Playing around with it, the one here is my favorite.
Regardless of how you draw the arc, it is telling us a fast move towards the upper trend line is coming.
That upper trend line has just two confirmations, but it matches up with the arc and is the best guide for now given DOT's limited history.
There is added risk due to the uncertainty of that upper trend line, so choose your strategy accordingly.
Of course, it can break above that line as well, if DOT sees strong adoption when the first parachains go live. $300+ is possible.
Also be aware that an eventual return to the long term support trend line is likely, so be sure to take some profits when your personal targets are reached.
I'm currently LONG and looking for a strong move up in the next 2 weeks.
This would be invalidated if it breaks down back into the smaller arc, or fails to break back above $50 by the end of this month.
Long term, I think DOT has a good chance to be a highly used crypto ecosystem and follow an explosive price pattern similar to Ethereum, Binance Chain, Cardano and Solana.
Enjoy and good luck.

DOT faces rejection at $46 as bears takes overPolkadot price analysis is bearish today.
Resistance for DOT/USD is present at $46.4.
Support for DOT/USD is present at $42.7.
The Polkadot price analysis shows that the coin got rejected from further upside as the price went near $46.1. Earlier, the DOT was rejected at $47.6 on 11th November, and it seems like bears are tightening their grip day by day, as now the price trend line has started forming slightly downwards. Every upwards price cap is lower than the previous one from 8th November onwards, which shows bearish empowerment.

PolkaDot DOTUSD - HUGE Parallel Channel on the Daily chart- Polkadot - DOT - Rank #8 -Coin
- Polkadot is strong on the daily timeframe , as we can see.
- The price broke out of the bullish falling wedge and now is unstoppable!
- On the daily time scale, we can spot a huge blue parallel channel , which acts like a support and resistance .
- Target top of the chanel or 1:1 fib extension on the daily chart .
- For expected duration of the trade, probability, stop loss, profit target, entry price and risk to reward ratio ( RRR ) - please check my signature below ↓
- Due to my Elliott wave count, the correction is totally over and we can expect a higher prices!
- If you want to see more of these ideas, hit "Like" & "Follow"!

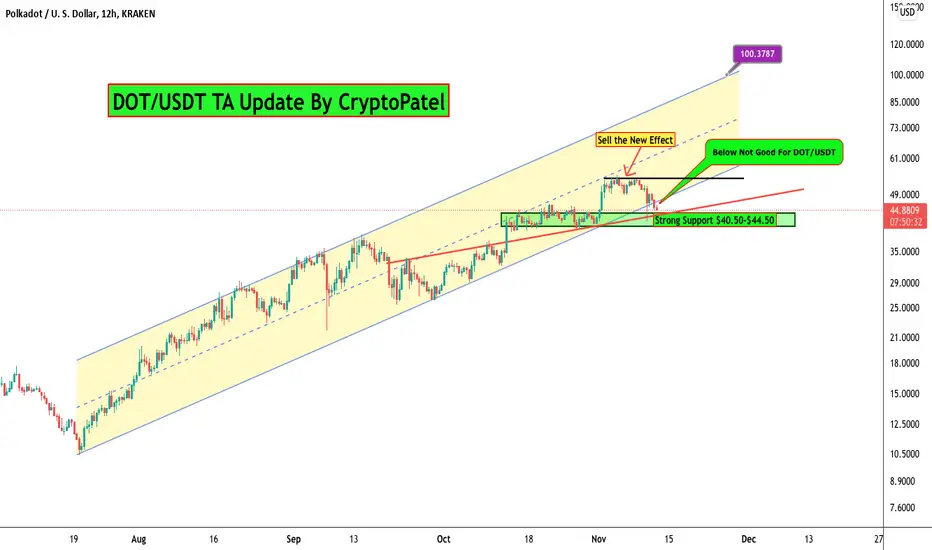
PolkaDot Still $100 Potential of entered in bearish Zone ..?#DOT/USDT TA update:-
$DOT lovers Still hoping $DOT can hit $100
Is it Possible..?
Yes It is Possible if #DOT hold $40-$44
I can expect bounce back from this Level.
First $DOT need to break $54 resistance which is Current All time High.
Above $54 Its Clear way toward $100
But Below $43-$44 Level I am bearish .
Support:- $43
Resistance:- $54
$DOTUSD - Major support retestedHello everyone!
DOTUSD just retested a major support during the flash crash of November 10.
If DOTUSD remains within this parallel channel, Polkadot will double.

DOT ReviewAgain, working to understand different ways to analyze charts. Here's a review of DOT that appears to be accurate. We'll see how it lands here in the next 6 days. But if the process worked we should see DOT hit $46 on 11 November. Obviously no guarantees and the market will do what it wants, but getting my analysis reps in. Would be great to hear feedback. Am I missing anything? Are there any built in indicators, strategies, or patterns that could have done this faster/better?

DOTUSD on the 1D MA50 targeting +$100Polkadot has been one of the hottest high cap cryptos since September's correction. The application of the Fibonacci Channel shows even more effectively how well it has been repeating the early 2021 rally.
As seen on this 1D chart, DOT rallied with the support of the 1D MA50 (blue trend-line) in Q1 2021. On the current sequence, the 1D MA50 has been supporting since August 01. It is therefore possible that as long as it holds, DOT will go after the 5.0 Fibonacci extension (horizontal) which is around $150. It is the firms thesis that this crypto will reach at least $100 during this run.
--------------------------------------------------------------------------------------------------------
Please like, subscribe and share your ideas and charts with the community!
--------------------------------------------------------------------------------------------------------

DOT resistance and support to $60As you can see, DOT is respecting the boundaries of the pitchfork.
These lines provide areas of resistance on the way up to ATH.
In the short term, I see $60 as the next target for profit taking.
I bought more DOT during this dip, but I am always impressed at who manages to buy it at the exact bottom, to maximize profits!?
Many ALTs are waking up, yesterday may have been the beginning of ALTSEASON.
Good Luck

DOT price rebound and new directionDOT is under strong influence of BTC and it will depend on BTC for further direction, we will see how BTC behaves in the coming days

DOT-USD - Bull Case Polkadot tries to hit $61 based on the FIBInterval: 4hrs
Description: Polkadot recovers from the sale, and tries to hit $61 milestone by Nov 22.

$DOT upcoming 4hr divergenceDot is oversold, looks like it might print some 4 hr bullish divergence if we're lucky enough to get another price drop. Not involved in this one yet, just waiting on the divergence to play out.

DOT moon soonI think there is a nice chance for a long trade.
As you can see, as soon as we pass this level we are in no man's land and the roof is the stars.
Auctions will start soon. The conditions are there. The price must break the structure with strength. I don't want a low price crawling on the support. In fact, it is also possible to witness fakeouts.
Stay awesome!

DOT within triangle I see DOT trading within this triangle until Friday, November 12th. That is when the parachain actions begin. I expect a breakout at that time (pending successful implementation).
Good Luck


Wait for Reversal on DOT - Big Move Coming!Using SpaceManBTC's Asteroid Belts + traditional indicators like Stochastic/RSI. I see a perfect buy opportunity at previous resistance, now acting as support. Wait for the pullback on DOT and HODL!

POLKADOT
🟢 DOT LONG
DCA BUY: 33,55 - 32,91 - 30
SELL: 35,5 - 38 - 41,45 - 46,24 - 53,85
Lev: 75x
Max: 3%

DOTUSD (4H) Bullish Wave We2Hi Traders
DOTUSD (4H Timeframe)
A Med-High probability, entry signal to go LONG will be given with the upward break of 53.5 after the market found support at 49.0. Only the downward break of 49.0 would cancel the bullish scenario and take us SHORT.
Trade details
Entry: 53..5
Stop loss: 49.0
Take profit 1: 58.7
Take profit 2: 64.6
Score: 7
Strategy: Bullish Wave We2

DOT Rising WedgeHere is how I see DOT trading in Q4 2021 - around $70 (near Christmas) local top before profits are taken to bottom of wedge.
Assuming the pitchfork and wedge boundaries stay intact and are not broken.
Let's see where this goes.

DOT aims for ATH thru resistanceDOT in the next few 4H candles should impulse upward.
$56 is the upper level of the pitchfork and the next fib level. That will provide heavy resistance. IF that can break, we should expect a retest on the pitchfork before further advancing. However, DOT is trading in a larger RISING WEDGE.
Good Luck

Dot by @cryptomatatanAfter a zone of accumulation of orders the price of Dot took off making its new high of all time and we will probably see it descend looking for liquidity and the activation of a new block of buy orders in the price range of $ 45- $ 40 and that it can converge with upcoming events within the blockchain.

DOTUSDPrice made lower lows
+
MACD making higher lows
=
Bullish Divergence
RSI is currently around 45 which is right in the middle of the overbought/sold zone.
200 ema acting as support lined up with the.618 Fibonacci ratio.
For those who are cautiously optimistic, there is a decent chance of a wick down to .5 - .382
First target if you break out is ath.

is going down at least for few daysis going down at least for few days, is going down at least for few days
