DOTUSD: Piercing Line at Shark PCZ with MACd Bullish DivergenceWe have a Piercing Line with Potential MACD Bullish DIvergence at the PCZ of a Bullish Shark on DOTUSD
DOTUSDT.P trade ideas

DOT📊 #DOTUSDT
⏱ TIME: 1W
📝It is reaching very important areas for spot purchases, and you can make purchases in a gradual and managed manner. It has also been checked for fundamental analysis and is a sustainable and strong project for the future.
📍The initial buying limit: 4.4 $
📍The second buying limit: 3.8 $
📌TP1: 7.5 $
📌TP2: 10 $
📌TP3: 23 $
📌TP4: 54 $

DOTUSDTThe dot is approaching the important support of $5, and near this point we see candles that stick together for a long time, which many of you know as the Smart Money concept. The purpose of this concept is to engage sellers and buyers before the main movement begins. In this case, we can see that first a fake upward move is planned, then many buyers liquidate. The next move will most likely be creating a fake downward move and liquidate the sellers. But the main move after that and It will be up. When both buyers and sellers are out of the game and enough liquid is provided for the main movement. I think $5 can be a good price to open a long position with risk management.
⚠️ "Daily crypto market analyses I provide are personal opinions & not financial advice. Trading carries risks, so do your own research & seek advisor's help."

Dot at discount levelLooking at DOT discount level, holding for a couple of weeks a golden pocket of a W breaker.
Low volatility, expecting a mid term bounce to a 3M breaker golden pocket btw 12-15usd.
NFA

DOT/USDT 1DInterval Resistance and SupportHello everyone, I invite you to review the DOT chart in pair to USDT, on a one-day timeframe. First, using the yellow line marked with the uptrend line from which the price broke down, and then we move in the channel marked with blue lines from which the price also goes down.
When we turn on the EMA cross 200, we can see that we are below this line as to the actual downtrend, while with the Ema cross 10 and 30, the downtrend is also visible.
Going further, we can move on to marking the place of support in a situation when we increase the correction. Here you go very strong support is at $4.98, if the support doesn't hold the price we can see a drop in the area and very strong support at $4.26.
Watching the other side of the picture that the price has rebounded off the $5.53 resistance which is still the first first resistance for the price, then we have the second resistance at $5.91, then the third resistance at $6.22, then the price of the change in the direction of return at the level of $6.53.
Please enter the CHOP index, which shows that there is still energy for the next move, MACD shows that you are on the verge of returning to the downtrend, while on the RSI we have a rebound and we are approaching the border of the border which may also indicate that a correction is coming till the end.

Long idea on DOTProfit risk is one in two.
Why long?
1) we are at the support level (and I see the withdrawal of liquidity from above)
2) The ball will be pulled to the top (in my opinion)
3) Dominance will drop a little (it will help)
4) Candle formation


dot bullishAlts are looking very bullish than Btc so im taking long in DOT because 4h FVG and also hidden bullish divergence on 1H time frame. I have used fibb levels for perfect entries.

DOT longDOT bounced off the lower boundary of horizontal channel. Bullish movement to resistance level at 5.425 is possible.

There is no demand left What did you think ??
Bitcoin price is pushing its 50-day moving average on the daily time frame, as well as Ethereum. Polkodat and many other cryptocurrencies are under 200 moving average!

DOT/USDT Looking W-E-A-KHey traders 👋
Let's kick off this day with DOT coin where we see how price had a nice rejection from 200ema and heading back for a breakdown at the $5.20 support zone. We see that price sees no support there which is bad for buyers as there is no enough support from them. We are going to look for a breakdown here with a nice potential for a 16% movement here!
If you like ideas provided by our team you can show us your support by liking and commenting.
Yours Sincerely,
Swallow Team
Disclamer:
We are not financial advisors. The content that we share on this website are for educational purposes and are our own personal opinions.

My vision of the scenario on the $DOTArguments for this development of events:
1) Dominance is not yet in favor of altcoins
2) The big player has not bought back the coins yet
3) Now a lot of "bulls" have divorced
4) Waiting for the regulation of the crypto market (it will lead to the final wave of decline)

DOT/USDT 4HInterval Resistance and SupportHello everyone, I invite you to a review of the DOT chart in pair to USDT, on a four-hour interval. First, we will use blue lines to mark the local channel of the sideways trend, from which the price is trying to go up. At this point, however, it is worth paying attention to the EMA Cross 200, from which the price clearly rebounded.
Moving on, we can move on to marking support areas when we start a larger correction. And here, the first support is at $5.46, the second support is at $5.40, the third support is at $5.35, and then we have a strong support zone from $5.30 to $5.23.
Looking the other way, we see that the price has reached an important resistance at $ 5.50 and to the place of the previously mentioned EMA Cross 200, which so far has no strength to break. However, if it manages to break above, the second resistance will be at $5.60, then the third resistance at $5.73 and the fourth resistance at $5.90.
Please look at the CHOP index, which indicates that the energy has been used, the MACD indicates that we are moving in a local uptrend, while on the RSI, after breaking the upper limit of the range, we got a quick price rebound, but further the room for increases is limited.

✴️ Polkadot Set To GrowWe have a double bottom on the Polkadot (DOTUSDT) chart, a strong support level has been activated.
✔️ If this support level breaks, we can get something like Dec./Jan., support recovery.
✔️ If this support level holds, we can get straight up and hit a new high compared to February this year.
It doesn't matter which if shows up, Polkadot Is Set To Grow!
Namaste.

DOTUSD ❕ above the support areaThe DOT rebounded from the support area.
The price returned to the channel.
I believe the price will continue to rise if the chart stays in the channel.
polkadot rady to moon 6$Polka dot which was a heavy resistance for a long time broke it and breakout now I think it will go up to $6 you guys can create position with stop loss trading only you are mine don't take any responsibility on that Take profit and enter and exit with your wisdom. My work is only for education purpose for price action.

HiAccording to my analysis, the scenario in front of Polkadat is like this. If it breaks the four-hour TR ceiling, it can have long goals, but if it does not break, it will go down to the TR floor.

HiAccording to my analysis, the scenario in front of Polkadat is like this. If it breaks the four-hour TR ceiling, it can have long goals, but if it does not break, it will go down to the TR floor.

dot usdtDot/usdt has reached a order block in 4 hour time frame, after getting confirmation at 5 minutes , you can catch it.

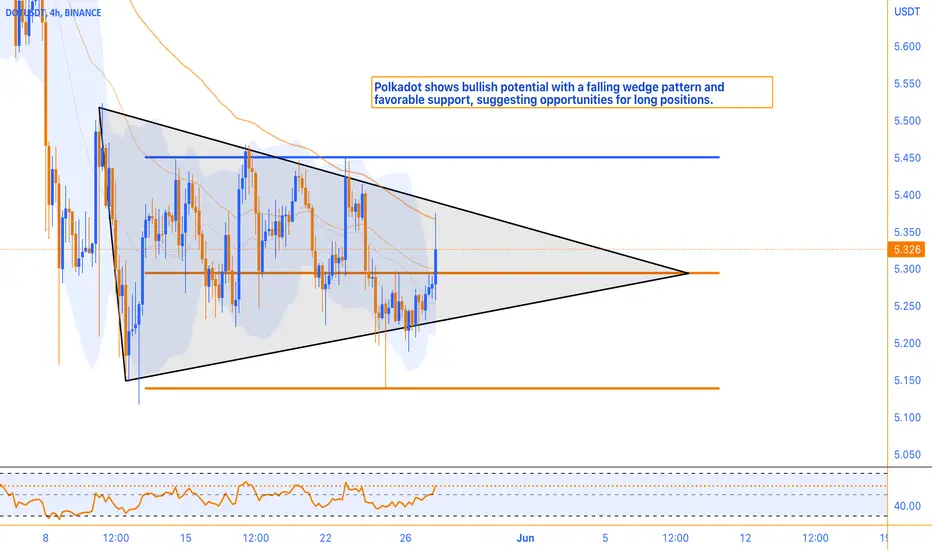
Falling Wedge Pattern, and Moderate Bullish MomentumPolkadot is currently being traded within a significant support zone, presenting a favorable trading opportunity. On smaller timeframes, a falling wedge pattern has emerged, indicating the potential for an imminent breakout from this triangular formation. Moreover, the Relative Strength Index (RSI) is currently at the 58 level, suggesting moderate bullish momentum in the stock. This implies that buying pressure is stronger than selling pressure, yet it has not reached an overbought condition. With these factors in mind, traders can consider building a long position at the support level while implementing proper risk management techniques. This analysis indicates a potential upward movement in DOT's price in the near future.
dotusdt are you rdy? 400%🧨😉400% profit for dot cryptocurrency
Be ready for a sweet long and spot purchase of currency for currency.
Entry target $4,630 and desired targets
The first target is $9,579, the second target is $19,379, and the third target is $23,466 for 2023.
The time period for these targets can be said to occur in a week to several weeks because everything is done explosively in the digital currency market.

DOT LONG & SHORT TERM PERSPECTIVEHello Traders and everyone, I am Hadi Karaali, Known as SNIPERS_FX
If you like the idea, do not forget to support with a like and follow.
DOT Still around a massive support zone.
For the bulls to kick in from a long-term perspective we need a break above the marked major swing high,
Then a shift in momentum would be confirmed from bearish to bullish.
Since, we are still around a support zone, and for the bulls to kick in from a short-term perspective, we need a break above the marked major swing high,
Then a movement higher would be expected,
Until that price is still overall bearish and price can still trade lower before reversal
If you like this kind of analysis don't forget to like and follow
and as usual follow your trading plan and manage your risk.
Be patient and good luck!

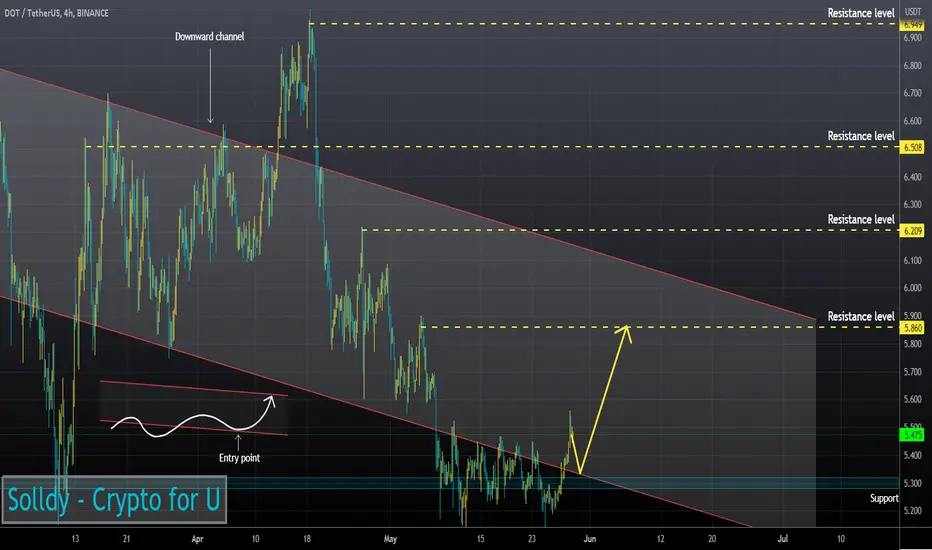
DOTUSDT-SCALP-SHORTAs you can see, after breaking the downward trend line, the price entered to a range channel and reacted to the ceiling and floor of this channel several times.
Now the price has reached the top and this channel, which is an important price action area, and according to the oscillator, we can receive a signal to enter the short position we can place an order on 5.4331 and consider the loss limit above the resistance range, and the price range of 5.2630 can be our target.
If this does not happen and the price breaks the resistance range, we can expect the price to grow up to the 5.6100 range.
