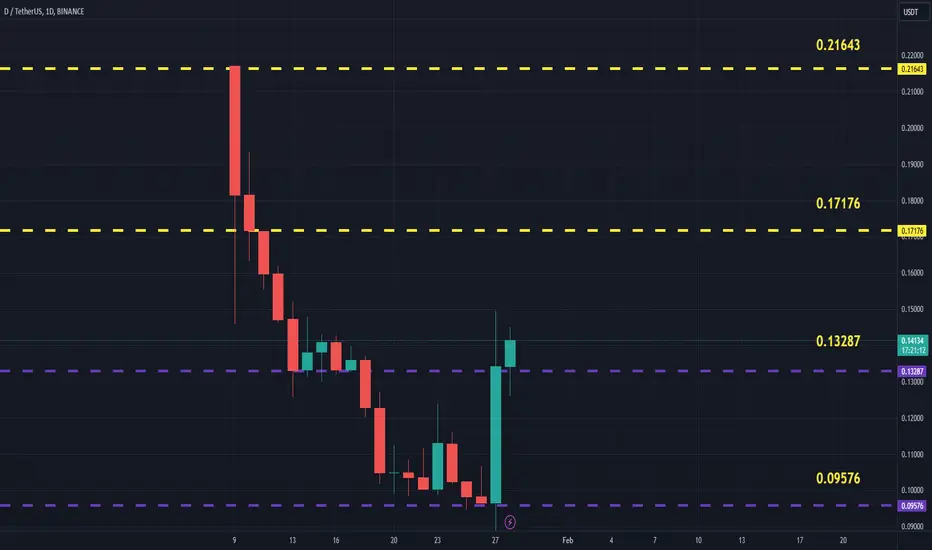
DUSDT Updated till 28-01-25DUSDT Daily timeframe range. PA is fairly new here. it found a new support at 0.09576. below that is price discovery. this kind of price action got lots of opportunity for scalp and swing trades. for further move it needs confirm close above 0.13287.
DUSDT.P trade ideas
$D / USDT PredictionHello traders,
On the daily chart, we can see a strong breakout accompanied by significant volume and a successful retest. I’ve highlighted a few key inflection points on the chart. Overall, the outlook appears very bullish, and it seems capable of withstanding Bitcoin's sudden price movements. All the indicators are positive. Please make sure to do your own research. I will update this chart as we progress!

D/USDTKey Level Zone: 0.12400 - 0.12800
HMT v5 detected. The setup looks promising, supported by a previous upward/downward trend with increasing volume and momentum, presenting an excellent reward-to-risk opportunity.
HMT (High Momentum Trending):
HMT is based on trend, momentum, volume, and market structure across multiple timeframes. It highlights setups with strong potential for upward movement and higher rewards.
Whenever I spot a signal for my own trading, I’ll share it. Please note that conducting a comprehensive analysis on a single timeframe chart can be quite challenging and sometimes confusing. I appreciate your understanding of the effort involved.
Important Note :
Role of Key Levels:
- These zones are critical for analyzing price trends. If the key level zone holds, the price may continue trending in the expected direction. However, momentum may increase or decrease based on subsequent patterns.
- Breakouts: If the key level zone breaks, it signals a stop-out. For reversal traders, this presents an opportunity to consider switching direction, as the price often retests these zones, which may act as strong support-turned-resistance (or vice versa).
My Trading Rules
Risk Management
- Maximum risk per trade: 2.5%.
- Leverage: 5x.
Exit Strategy
Profit-Taking:
- Sell at least 70% on the 3rd wave up (LTF Wave 5).
- Typically, sell 50% during a high-volume spike.
- Adjust stop-loss to breakeven once the trade achieves a 1.5:1 reward-to-risk ratio.
- If the market shows signs of losing momentum or divergence, ill will exit at breakeven.
The market is highly dynamic and constantly changing. HMT signals and target profit (TP) levels are based on the current price and movement, but market conditions can shift instantly, so it is crucial to remain adaptable and follow the market's movement.
If you find this signal/analysis meaningful, kindly like and share it.
Thank you for your support~
Sharing this with love!
HMT v2.0:
- Major update to the Momentum indicator
- Reduced false signals from inaccurate momentum detection
- New screener with improved accuracy and fewer signals
HMT v3.0:
- Added liquidity factor to enhance trend continuation
- Improved potential for momentum-based plays
- Increased winning probability by reducing entries during peaks
HMT v3.1:
- Enhanced entry confirmation for improved reward-to-risk ratios
HMT v4.0:
- Incorporated buying and selling pressure in lower timeframes to enhance the probability of trending moves while optimizing entry timing and scaling
HMT v4.1:
- Enhanced take-profit (TP) target by incorporating market structure analysis
HMT v5 :
Date: 23/01/2025
- Refined wave analysis for trending conditions
- Incorporated lower timeframe (LTF) momentum to strengthen trend reliability
- Re-aligned and re-balanced entry conditions for improved accuracy

DARUSDT (MinesofDalarnia) Updated till 31-12-24DARUSDT (MinesofDalarnia) Daily timeframe range. its been stuck on same level for a long time now. so peoples packed their bag. if it dont breaks 0.12480 and can keep above it, it got potential the high is far away. for push needs to get up valid above 0.19715.

DARUSDT Analysis: Potential and Entry PointsIn DARUSDT, the price seems to have some room for further upside . For those looking for entries, the blue boxes represent strong demand zones and could be ideal areas to consider.
Key Highlights:
Upside Potential: The price structure indicates a possible continuation of the upward trend.
Blue Boxes as Demand Zones: These levels are carefully identified and provide meaningful entry opportunities.
Confirmation Indicators:
When trading the blue boxes, I use indicators such as CDV, liquidity heatmap, volume profile, volume footprint , and upward market structure breaks in low time frames to validate entries.
Learn My Techniques: Interested in understanding how I identify these demand zones? DM me, and I’ll guide you through using these advanced tools!
Support and Motivate: If this analysis resonates, feel free to boost and comment. Your engagement inspires me to share even more!
If you think this analysis helps you, please don't forget to boost and comment on this. These motivate me to share more insights with you!
I keep my charts clean and simple because I believe clarity leads to better decisions.
My approach is built on years of experience and a solid track record. I don’t claim to know it all, but I’m confident in my ability to spot high-probability setups.
If you would like to learn how to use the heatmap, cumulative volume delta and volume footprint techniques that I use below to determine very accurate demand regions, you can send me a private message. I help anyone who wants it completely free of charge.
My Previous Analysis (the list is long but I think it's kinda good : )
🎯 ZENUSDT.P: Patience & Profitability | %230 Reaction from the Sniper Entry
🐶 DOGEUSDT.P: Next Move
🎨 RENDERUSDT.P: Opportunity of the Month
💎 ETHUSDT.P: Where to Retrace
🟢 BNBUSDT.P: Potential Surge
📊 BTC Dominance: Reaction Zone
🌊 WAVESUSDT.P: Demand Zone Potential
🟣 UNIUSDT.P: Long-Term Trade
🔵 XRPUSDT.P: Entry Zones
🔗 LINKUSDT.P: Follow The River
📈 BTCUSDT.P: Two Key Demand Zones
🟩 POLUSDT: Bullish Momentum
🌟 PENDLEUSDT.P: Where Opportunity Meets Precision
🔥 BTCUSDT.P: Liquidation of Highly Leveraged Longs
🌊 SOLUSDT.P: SOL's Dip - Your Opportunity
🐸 1000PEPEUSDT.P: Prime Bounce Zone Unlocked
🚀 ETHUSDT.P: Set to Explode - Don't Miss This Game Changer
🤖 IQUSDT: Smart Plan
⚡️ PONDUSDT: A Trade Not Taken Is Better Than a Losing One
💼 STMXUSDT: 2 Buying Areas
🐢 TURBOUSDT: Buy Zones and Buyer Presence
🌍 ICPUSDT.P: Massive Upside Potential | Check the Trade Update For Seeing Results
🟠 IDEXUSDT: Spot Buy Area | %26 Profit if You Trade with MSB
📌 USUALUSDT: Buyers Are Active + %70 Profit in Total
🌟 FORTHUSDT: Sniper Entry +%26 Reaction
🐳 QKCUSDT: Sniper Entry +%57 Reaction
📊 BTC.D: Retest of Key Area Highly Likely
I stopped adding to the list because it's kinda tiring to add 5-10 charts in every move but you can check my profile and see that it goes on..

DAR/USDT: Major Historical Levels Analysis| NEXT 1100% PotentialBINANCE:DAR/USDT - 1D TIMEFRAME 🎯
MARKET STRUCTURE:
━━━━━━━━━━━━━━━━
✦ CURRENT PRICE: $0.13873 (-2.07%)
✦ FIRST TARGET: $0.74760 (+525%)
✦ ULTIMATE TARGET: $1.65318 (+1,100%)
✦ TIMEFRAME: Daily/Long-term
TECHNICAL BREAKDOWN:
━━━━━━━━━━━━━━━━
1. HISTORICAL CONTEXT:
• Price at multi-year support level
• Significant consolidation since May 2023
• Major historical resistance levels marked
2. KEY PRICE LEVELS:
• Current Support: ~$0.13-0.14
• First Major Resistance: $0.74760
• Second Major Resistance: $1.65318
3. VOLUME PROFILE:
• Current Volume: 29.45M
• Low volume consolidation phase
• Potential accumulation period
STRATEGIC OUTLOOK:
━━━━━━━━━━━━━━━━
LONG-TERM POTENTIAL:
• Two major upside targets identified
• Historical resistance levels as targets
• Significant upside potential from current levels
RISK CONSIDERATIONS:
• Current downtrend needs reversal confirmation
• Volume increase needed for momentum
• Extended consolidation possible
ENTRY STRATEGY:
━━━━━━━━━━━━━━━━
• Wait for reversal confirmation
• Look for volume expansion
• Consider scaling in on breakout confirmations
RISK DISCLOSURE:
━━━━━━━━━━━━━━━━
Trading involves substantial risk. This analysis is educational and should not be considered financial advice. Always conduct your own research and trade responsibly.
#DAR #Crypto #TechnicalAnalysis #TradingView #CryptoTrading
Tags: @TradingView
Note: The significant upside targets are based on historical price levels. Always use proper risk management and position sizing.

DAR COIN PRICE ANALYSIS AND NEXT POSSIBLE MOVES!!NYSE:DAR Coin Possible Scalp & Swing Trade Ideas 💡!!
• If price drop b/w 0.105$-0.095$ area then potential Bounce Back expected.. With SL I will Try To Build Quick Scalp On it.
• Before Upgradation if its price drop b/w 0.75$-0.60$ area then i will add it small amount in my long term portfolio for 50%-150% gain.. In next Few Months🫡
Warning : That's jus mine analysis Do Your Own Proper Research Before Taking qny action🚨

DARUSDT | Personally Loading Here | Mid Term (1D)DARUSDT | Personally Loading Here | Mid Term (1D)
As part of my profit taking strategy, I like to go through and map out potential levels of interest based on semi-bullish to very bullish mock up price action using fractals and fibs.
Based on concept of money flow... BTC, then ETH, then Large Caps, Then Mids and Smalls, I am personally heavier skewed loaded up on mid to small cap coins with bullish chart setups and high profit potentials.
I think its about finally time for DAR... This looks like a good area to load up for me personally.
Additional altcoin near term and midterm chart ideas listed below.
VRAUSDT | Personally Loading Here | Mid Term (1D)
DRIFTUSDT | Mapping Out Possibilities | Near Term (4HR)
XUSDT | Mapping Out Possibilities | Near Term (4HR)
OLUSDT | Mapping Out Possibilities | Near Term (4HR)
GRASSUSDT | Mapping Out Possibilities | Near Term (12HR)
ALGOUSDT | Mapping Out Possibilities | Near Term (12HR)
GRASSUSDT | Mapping Out Possibilities | Mid Term (1D)
XUSDTUSDT | Mapping Out Possibilities | Mid Term (1D)
MYRIAUSDT | Mapping Out Possibilities | Mid Term (1D)
GHSTUSDT | Mapping Out Possibilities | Mid Term (1D)
DOGSUSDT | Mapping Out Possibilities | Near Term (4HR)
DEGENUSDT | Mapping Out Possibilities | Mid Term (1D)
MANEKIUSDT | Mapping Out Possibilities | Mid Term (1D)
CSPRUSDT | Mapping Out Possibilities | Mid Term (1D)
WLDUSDT | Mapping Out Possibilities | Mid Term (1D)
GODSUSDT | Mapping Out Possibilities | Mid Term (1D)
AXSUSDT | Mapping Out Possibilities | Mid Term (1D)
CHZUSDT | Mapping Out Possibilities | Mid Term (1D)
OGNUSDT | Buy Now, Thank Later | Near Term (4HR)
XCHUSDT | Buy Now, Thank Later | Near Term (4HR)
VRAUSDT | Buy Now, Thank Later | Near Term (4HR)
CSPRUSDT | Buy Now, Thank Later | Near Term (4HR)
PERPUSDT | Buy Now, Thank Later | Near Term (4HR)
TLMUSDT | Buy Now, Thank Later | Near Term (4HR)
DODOUSDT | Buy Now, Thank Later | Near Term (4HR)
LPTUSDT | Buy Now, Thank Later | Near Term (4HR)
VRAUSDT | Buy Now, Thank Later | Near Term (4HR)
XCHUSDT | Buy Now, Thank Later | Near Term (4HR)
CSPRUSDT | Buy Now, Thank Later | Near Term (4HR)
VELOUSDT | Buy Now, Thank Later | Near Term (4HR)
UMAUSDT | Buy Now, Thank Later | Near Term (4HR)
OGNUSDT | Buy Now, Thank Later | Near Term (4HR)
DOTUSDT | Buy Now, Thank Later | Near Term (4HR)
VIDTUSDT | Buy Now, Thank Later | Near Term (4HR)

DAR new update (1D)This analysis is an update of the analysis you see in the "Related publications" section
it is only for SPOT and not FUTURES. Do not enter a position without capital management
It went near the entry range of the previous analysis but didn't reach it. Now, we can look for BUY positions with this setup
Closing a daily candle below the invalidation level will violate this analysis
For risk management, please don't forget stop loss and capital management
Comment if you have any questions
Thank You

DARUSDTDARUSDT The work in wave analysis is now opening wave (iii) of (1) of (3), a strong and fast impulsive wave. Our target is the red zone. According to classical analysis, the channel has been broken and successfully retested. Enter now, with the target being the higher red zone. Good luck to everyone.

#DAR 1D: Symmetrical Triangle – Pump Incoming?DAR is an Ethereum token powering the game Mines of Dalarnia. This play-to-earn game features mining, multiplayer battles, and resource collection. DAR tokens can be used to upgrade items, trade on the in-game NFT marketplace, and vote on platform development plans.
Currently, the asset is in a prolonged accumulation phase, with the price forming a symmetrical triangle pattern on volumes, which could indicate further growth. Assets like this, after such extended accumulations, often pump rapidly and unexpectedly. From current levels, there’s a potential for 50% to 500% gains without leverage—depending on luck.
DYOR.

DARHello, when we look at the narrow daily, there is a narrowing triangle structure. It has been moving silently for a long time in this bull season, the chart appears to be on a long time frame, so it seems to have a little more time in terms of time, but I think it will close the needles above in the first place and take 0.26s, we need to follow the test movement afterwards.

Mines Of Dalarnia: Growth Potential Exceeds 4,000%I think DARUSDT (Mines of Dalarnia) can grow by 4,000% in 2025 compared to current prices, I truly believe it, but I don't bet my house on it.
I think DARUSDT (Mines of Dalarnia) is about to produce a strong bullish breakout, I truly belief this but... Let's trade!
We've been looking at many, many Altcoins with huge potential for growth. There is nothing wrong with aiming for 1,000% or 2,000%, but if you are in front of the computer on a daily basis and like to trade, it is wise to secure profits and create of habit of closing successful trades.
Can be 50% in the green just as it can be 200% or 300%. It is always wise to create this habit or else it would be difficult to take profits when the market is in bull-run mode. I am saying this lightly but don't take it lightly. A plan is needed, planning is needed. Energy, intention and dedication should go into our decision making...
This pair caught my attention because I've seen it move strong. It is trading relatively low in comparison with those that moved ahead. The current market condition is telling me that DARUSDT is ready to move next.
I honestly don't care if it grows 300% or 5,000%. I like to catch the bottom and let it ride; my goal is to give you a great entry, great timing; and I'll let you take care of the rest?
Deal?
I'll give you the chart, the numbers and the pair, and you make sure to take care of the rest.
(Secure profits on the way up!)
I am wishing you tons of profits, health, wealth and success.
Thank you for reading.
Namaste.

Dar - Golden Cross is Happening (50 and 200) - Daily Dar .. is about to explode ... The 50 daily average (green) is attempting to cross the 200 daily average blue .. which is known as GOLDEN CROSS .... Dar is under accumulation phase for more than 2.5 years.
The price also breaks the 360 daily average (reddish orange) with a bold daily candle.

DARUSDT 1WDAR ~ 1W
#DAR If you have Conviction on this coin. Buy in stages from here. It is very clear that this is an accumulation area. Minimum target 20%++. If you are not interested in this coin,. it's best to just forget it.


DARUSDT 1WDAR ~ 1W
#DAR Buy in increments on this support block, with a minimum target of 20%++. It looks very clear. this is the accumulation area

Bearish on $DAR1. We has a turtle-soup purge above the H3 old high
2. We have a bearish of the H3 OB- Created
3. We have major draws as the Equal lows and H3 OB+

DAR Analysis ideaDAR Possible targets on chart if altcoins bounce DAR has a medium/high probability of increasing in value
Always do your research

DAR - Cup and Handel PatternA cup and handle is still in place ... if the pattern activated .. DAR will fly to the sky ...

DAR bullish ideaMines of Dalarnia (DAR) is currently exhibiting a bullish head and shoulders pattern on its charts.
This pattern is often considered a reliable indicator of a potential trend reversal from a downtrend to an uptrend
Investors and traders should keep a close eye on DAR as it approaches the completion of this pattern, as it may present a lucrative opportunity for those looking to enter or add to their positions.
NFA, GL HF

DAR Looks BullishIt seems that DAR is in the accumulation phase. We have signs of a trend change on the chart. But to enter the position, we need setup and a good support.
The support we have identified is where we enter the buy/long position.
If the DAR reaches the entry range, we will enter the position.
Closing a daily candle below the invalidation level will violate this analysis.
For risk management, please don't forget stop loss and capital management
When we reach the first target, save some profit and then change the stop to entry
Comment if you have any questions
Thank You

DAR/USDT Looking Ready DAR/USDT is showing potential for a breakout from a symmetrical triangle pattern on the 12-hour time frame. A solid breakout could happen soon. If the price breaks out and successfully retests the breakout level, we might see a surge of 40-80% in the coming days. Keep an eye on this movement, as it could be significant. This is not financial advice—please do your own research.
