ena will pump from fvg ena is looking bullish on daily time frame from fvg area you can expect 2x in this project.
ENAUSDT.PS trade ideas


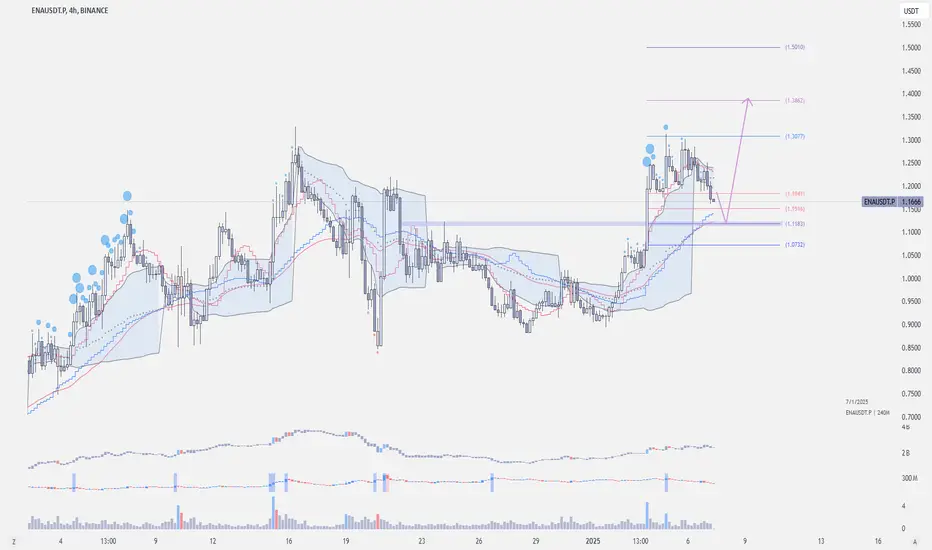
ENA USDTENA/USDT chart using a 4-hour timeframe. The chart highlights significant support and resistance levels and zones. Key resistance areas are marked in green, at $1.1346 - $1.1004, and above, with the highest resistance near $1.3038. The red zone, at $0.8698–$0.8920, represents a critical resistance level that previously served as support.
On the downside, the chart features an orange support zone at $0.6701 - $0.6923 and blue support zone at $ 0.4833 - $0.5040. The orange zone indicates a major support area, while the blue zone represents a key long-term support. The current price is $0.7800, trading near on the support level at $0.7576. The price action indicates a bearish sentiment as it breaks below previous support levels. According to our, the price could break the support level at $0.7576 and bounce back from the orange support zone.

ENA take time to see in different TD and you all will understand that ENA is long, so lets take this opportunity to have some profit.
Targets are 089-095$
hope this will go as we all wish
DYOR
nfa

ENA/USDT on the Edge Major Breakdown Signals Big Moves Ahead!The chart showcases ENA/USDT breaking down from a well-established channel pattern, signaling potential bearish momentum. This breakdown indicates a shift in market sentiment, as bulls have failed to hold the key support levels. The price action now reflects a retest of the broken channel's lower boundary, which is likely to act as a significant resistance area.
ENA has exited the channel pattern, with the price moving decisively below the structure. This breakdown is a critical bearish signal, as it invalidates the previous trend's upward momentum. The levels of $0.84 and $0.89 will act as key resistance points. The $0.84 level represents the immediate resistance derived from the channel's lower boundary, while $0.89 aligns with a historical supply zone, where sellers are likely to dominate if the price approaches this level. A failure to reclaim these levels will reinforce the bearish bias, encouraging sellers to push the price lower.
If the price fails to reclaim the resistance levels, the bearish breakdown could extend toward $0.73, which is the first significant demand zone, followed by $0.66, a mid-level support identified from previous accumulation zones, and $0.58, the ultimate bearish target if selling pressure accelerates.
The breakdown has been accompanied by increased sell-side volume, indicating strong participation by sellers. Any attempts to reclaim the resistance levels must also show increasing volume on the buy side to invalidate the bearish structure. The breakdown below the channel has likely shaken bullish confidence. When the price retests the resistance zone between $0.84 and $0.89, short positions may dominate, targeting the lower support levels.
Traders should watch for price action near the $0.84 to $0.89 resistance range. A clear rejection at this zone, coupled with low bullish volume, will confirm the bearish continuation. Conversely, if bulls manage to reclaim and hold above $0.89, it could invalidate the bearish outlook and signal a recovery toward $1.00.
ENA/USDT has shown significant bearish signs with the channel breakdown and subsequent retest of resistance levels. The likelihood of further downside remains high unless bulls reclaim the $0.89 level. Traders should exercise caution and focus on price action around the key resistance and support zones for optimal trade entries.

ENAUSDT — Double Top Breakdown: Is a Bigger Drop Coming?Yello, Paradisers! Have you spotted the double top pattern on #ENAUSDT? Let’s break it all down clearly.
💎#ENA is showing a double top breakout, which is a strong bearish signal. The price recently broke below the support neckline and is now retesting that same level, which has turned into a resistance zone around $0.85 to $0.91. This area is key. If the price gets rejected here, it’s likely to continue its downward move toward the next support at $0.68. There’s even a chance it could drop lower into a stronger support zone if the selling pressure increases.
💎However, if ENA manages to reclaim this resistance zone, the price could push higher and target the supply zone between $1 and $1.08. In this case, it would grab liquidity before continuing its downward trend. Keep in mind that this move wouldn’t necessarily signal a full reversal — it could just be a temporary bounce.
💎The key level to watch for bearish invalidation is $1.08. If we see a daily close above $1.08, it would suggest that the bearish structure has broken and the price could shift back into a bullish trend.
Remember, consistency is what separates successful traders from the rest. Stay focused, Paradisers.
MyCryptoParadise
iFeel the success🌴


ENAGoing as per plan. Ideally I would like that would brush the May low and reclaim it. It would hit several trigger
1. Cover the monthly imbalance
2. Would touch the monthly balance price action.
3. Hit the long term trend line.

ENA Double Top WarningENA create double top and now in support area, if this support breakout mostlikely will visit red line

ENAFake support has been created by smart money around the 0.90 zone to induce retail traders in placing their longs at that level
I would think the trend would target the weekly imbalance which would take out these lows whereas also give us a deviation.
Green box is my entry where I would seek a market structure shift as well
Daily MACD is under the zero line plus with additional imbalances created above, I dont think the trend will seek additional liquidity.
Long term trend is still bullish

ENA rebuy setup (1D)This is one of the symbols that Trump had invested in. It now appears that a supercycle has completed, and the price has entered a new wave phase (wave E).
The low-risk area for rebuying in spot trading includes the two entries we have highlighted on the chart.
Minimum targets are indicated on the chart. If ENA can stabilize above the supply zone, it may become very bullish again.
The closure of a daily candle below the invalidation level will invalidate this analysis.
For risk management, please don't forget stop loss and capital management
Comment if you have any questions
Thank You

$ENA - Point of InterestBitcoin dominance is soaring right now as CRYPTOCAP:BTC taking the lead.
If we get a rejection around 58% on CRYPTOCAP:BTC.D , then will be picking some #alts
POIs for MIL:ENA is around 1.12 to 1.09, will be targeting 1.40 to 1.50 (short term)
ENAI am long on ena
Nice displacement on 4H with a FVG with an OB untapped, Im looking to long on the Equilibrium of the OB as seen on chart. Overall trend is bullish therefore I see this as a no brainer
Max lev 8x
Stay safe and dont overlevarage

ENA BUY?????
A buy position above the final resistance for a spike, if the RSI also reaches the overbought zone and volume confirms the move. Please enter with your own risk management and after analyzing USDT dominance and Bitcoin dominance.

ENAUSDT 3DENA ~ 3D
MIL:ENA In the next 2-3 weeks you will see a new high price for this coins, Buy in stages, target at least 20%+

ENAUSDT: Short-Term Trading OpportunityENAUSDT: Short-Term Trading Opportunity
Market Overview
ENA is showing a favorable setup on the H4 and D1 timeframes, with a solid accumulation zone around $1.24 or lower. This presents a promising opportunity for short-term gains within the current market cycle.
Trade Plan
📌 Entry Point: $1.24 or lower – Ideal for positioning before potential upward movement.
🎯 Target: 20-30% profit – Targeting significant returns in a short timeframe.
⏳ Hold Time: Maximum 1 week – Designed for efficient capital allocation.
💡 Note: This is not financial advice. Always conduct your own research and manage risks effectively.

Bullish Cases for ENA/USDT#Bull_Insights #014
Coin Ticker : #ENA
Market : Binance
Time Frame : 1 Week.
This report analyzes the bullish indicators for ENA/USDT as depicted in the provided chart, highlighting potential upward trends and investment opportunities based on technical analysis.
Key Observations:
Volume Surge : There's a noticeable increase in trading volume at the end of 2024, which often precedes significant price movements. High volume can indicate strong buying interest, suggesting a potential bullish trend.
Price Consolidation : The price has been consolidating within a tight range, marked by the red dashed lines (approximately $1.2 - $1.4 USDT). Consolidation after a downtrend and rebound can lead to a breakout, often upwards if accompanied by increasing volume.
Support and Resistance: The consolidation area acts as a strong support level. If ENA breaks above the resistance with significant volume, it could signal the start of a new uptrend.
Moving Average Cross: Although not explicitly shown, the price action near what appears to be a moving average specifically on the daily time frame confirms a golden cross (short-term MA crossing above long-term MA), a bullish signal.
Relative Strength Index (RSI) : The RSI, if considered, rebound from the oversold area and currently showing bullish sentiment with a divergence in the formation (not visible in the chart). An RSI moving upwards from an oversold condition or showing bullish divergence could confirm buying momentum.
Pattern Formation : The price action seems to be forming a potential double bottom or and in some particular cases inverse head and shoulders pattern, both of which are bullish reversal patterns. Confirmation of these patterns with a breakout above the neckline or the red rectangle resistance area would be a strong bullish signal.
Fibonacci Retracement: The price is currently near the 1.68 Fibonacci extension level. A bounce from these levels could indicate the resumption of the forming uptrend.
🔼Bullish Cases:
Breakout Scenario: A breakout above the current resistance with high volume could lead to a target price calculated by the height of the consolidation range, potentially pushing ENA towards $1.6 - $1.8 USDT in the short term and will pave a way for the long term ATH move for the coin.
Pattern Confirmation : If the patterns mentioned (double bottom or inverse head and shoulders) are confirmed, this could lead to significant price appreciation, targeting levels beyond the previous highs.
Volume Confirmation: Continued increase in volume alongside price movement will validate the bullish case, suggesting strong market interest and potential for sustained growth.
Fundamental View on the future of MIL:ENA :
▶️ Sector: DeFi
▶️ MC: $3.73B
▶️ FDV: $18.58B
▶️ Unlocked supply: 20.22%
- Ethena is a synthetic dollar protocol built on Ethereum.
- It offers a crypto-native solution for money that doesn't rely on traditional banking infrastructure.
- Additionally, it provides a globally accessible, dollar-denominated savings instrument — the "Internet Bond."
Conclusion:
The current technical setup for ENA/USDT shows several bullish indicators. However, investors should watch for confirmation through volume and price action before making investment decisions. Always consider broader market conditions and news related to ENA that could affect its price independently of technical indicators.
Recommendation:
Monitor ENA/USDT closely for breakout signals above the current resistance. If confirmed with volume, consider entering long positions with stops below the consolidation area for risk management.

ENAUSDT Analysis - What Shall we Expect !!!As you can see, the price is likely forming a cup and handle pattern. If our assumption is correct, we should wait for this pattern to break out to see a price increase.
Give me some energy !!
✨We spend hours finding potential opportunities and writing useful ideas, we would be happy if you support us.
Best regards CobraVanguard.💚
_ _ _ _ __ _ _ _ _ _ _ _ _ _ _ _ _ _ _ _ _ _ _ _ _ _ _ _ _ _ _ _
✅Thank you, and for more ideas, hit ❤️Like❤️ and 🌟Follow🌟!
⚠️Things can change...
The markets are always changing and even with all these signals, the market changes tend to be strong and fast!!

ENA | Correction in ProgressI think ENA will go up next year but is due for a correction at the start of the year. The price recently broke below its diagonal support line and is now testing this same line as resistance - a classic bearish signal. Based on typical crypto patterns, we're likely to see a pullback to the second support zone (marked by the orange box) before any significant upward movement begins.

Prepare to BUY Spot DGB on H4 CyclePrepare to BUY Spot DGB on H4 Cycle
🌟 Short-Term Opportunity with Potential for Extended Gains! 🌟
🌍 Market Overview:
DGB is positioned for a BUY signal on the H4 timeframe, offering a promising setup for both short-term and mid-term gains.
📊 Trade Plan:
📌 Entry Point: $0.15 – Accumulate at this level for an optimal position.
🎯 Target:
+30% for short-term profits.
If D1 confirms the signal, aim for +100% for extended gains.
⏳ Hold Time:
Short-term: Up to 3 days.
Extended: Up to 2 weeks if targeting 100%.
🔍 Strategy Insights:
H4 Momentum:
Designed for quick profits based on short-term market waves.
D1 Confirmation:
If the D1 signal is confirmed, hold for larger trend potential.
💡 Note: This is not financial advice. Always DYOR before trading.
🔥 DGB is ready for action – Position yourself now! 🔥

ENA/BTC.DMarkets can be deceiving. Often you need to look deeper than just price action and combine indicators to help tell a better story. I've found divergence and convergence between price and various indicators, particularly volume-based metrics and oscillators fairly successful. Remember it's all about supply and demand. Find imbalances and deviations.
I've found order flow and auction market theory useful when navigating the markets.
By the way, can you spot the divergence? Let's see if the volume and open interest support the current move. If so, we should see a continuation in price action (until proven otherwise IE conformation or rejection moves in trends). This concept can be deceptive as we need to consolidate movement amongst whatever fancy indicator you like using. I'm specifically looking for deviations in market structure (higher highs and lower lows etc.) By observing changes in market structure amongst different indicators. It paints a better picture around buyer and seller pressure. Observe to see if the receiving side can absorb the pressure or not.

ENA/BTC.DMarkets can be deceiving. The markets are ruthless and will chew you up if you are not careful. Often you need to look deeper than just price action and combine indicators to help tell a better story. I've found divergence and convergence between price and various indicators. Particularly volume-based metrics and oscillators which highlight trend deviation a bit better. Remember it's all about supply and demand. Find imbalances and deviations.
I've found order flow and auction market theory useful especially in a bull market.

ENA/USDT LONGLimit buy in green zone 0.84 - 0.92
Fix profit in red zone 1.28 - 1.44
The forecast works as long as the price is within the Fibonacci retracement zone.
