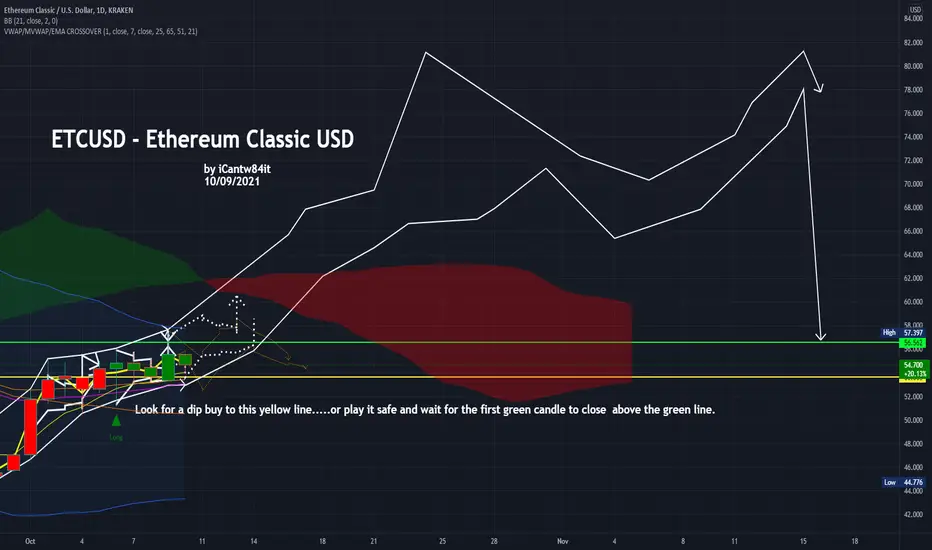
ETCUSD by request repeating bounce off support b4 breaking HiLook for this to come down and recheck the support before it goes up to break the previous High. Also called Re-accumulation. If you look back its repeating this move over and over....sometimes support doesnt hold and it comes back down to the last level of support and starts over. So make sure its following the right path. You can also use the same VWAP I am using in the image and when the first green candle closes above the cloud after the dip.......Thats your trigger to get in. Again Im not a financial advisor do not follow my trades blindly do your own DD. but this is what I see.
iCantw84it
ETCUSD.P trade ideas

ETCETC in the process of breaking out of the descending wedge. The breakout will take it to around $56. ETC is currently underperforming the rest of the crypto market. It might potentially catch up with the rest of the market.

ETCUSD PRICE PREDICTIONThe reason I think Ethereum Classic price goes higher because of Ethereum.
So don't be surprise when ETC goes up as well.
Current Market Cap: $6.8 billion. Price: $52
- January ETC will hit $483
- Retrace Feb and Mar
- Top: July/August: $1300
People will just FOMO in when price goes up so does not matter if it has true value or not.
Just like Dotcom bubble.
I don't think most of them will stay.
Only few maybe.

ETC weekly Movement (12-19 october)Hellooo...My Dragon Friends
i see ETC movement sideways. still waiting BIG new, may be tapering
Lets See
Happy Trading
Smart Trading
Money Management
Risk Management
Disclaimer On
related link ideas

ETC seated over multiple support lines.At the current moment ETC is seated over a 2018 support line ( Horizontal) and moving to a diagonal support line. IF price breaks down this area, price should move between 35-45 for a couple weeks then move up for a 400 % gains.

ETCUSD Dip buy on the daily if it holds above the line =MoonDip buy on this one waiting for it to drop down to the alst level of support and then moon shot.
by iCantw84it
ETC Ethereum classic is in a triangle. Breakouts end of Oct.ETC has formed in a triangle over the last week. Next major area of resistance around 59.88. Possible breakouts around the end of the month.

ETC longIt looks like we are in a decending channel, macd looks like it'll break to the upside and volume is decreasing, looks like a breakout

ETC/USDTesting/tracking elliot wave theory. Please do not trade off idea without S/L. Not financial advice.

ETCUSDT/ By Delvoski Hello .
everything is clear , If close above 77 : we will see higher and higher but if close under trend line see you next year again !

ETC Weekly Movement (05-12 October)Hellooo...My Dragon Friends
i see... my view still same with last week chart...Still On Track
Lets See
Happy Trading
Smart Trading
Money Management
Risk Management
Disclaimer On

ETCUSD H4: +50% gains BULLS THE BEST level TO BUY/HOLD(SL/TP)Why get subbed to me on Tradingview?
-TOP author on TradingView
-2000+ ideas published
-15+ years experience in markets
-Professional chart break downs
-Supply/Demand Zones
-TD9 counts / combo review
-Key S/R levels
-No junk on my charts
-Frequent updates
-Covering FX/crypto/US stocks
-before/after analysis
-24/7 uptime so constant updates
🎁Please hit the like button and
🎁Leave a comment to support our team!
ETCUSD H4: +50% gains BULLS THE BEST level TO BUY/HOLD(SL/TP)(NEW)
IMPORTANT NOTE: speculative setup. do your own
due dill. use STOP LOSS. don't overleverage.
🔸 Summary and potential trade setup
::: ETCUSD 4hour/candle chart review
::: range locked price action
::: expecting pullback/correction soon
::: updated/revised outlook
::: setup still valid as of RIGHT NOW
::: chart is LOG SCALE
::: get ready to BUY LOW later
::: pullback/soon CORRECTION MODE
::: BUY LOW near S/R level
::: entry - early October 2021
::: for now expect PULLBACK/CORRECTION MODE
::: will last 1-2 weeks
::: up to 50% gains possible later
::: short-term pullback/correction
::: re-test of range lows is likely
::: before uptrend can resume later
::: SPECULATIVE SETUP
::: do your own due dill
::: and use proper risk management
::: TP bulls is +50% gains
::: details: see chart
::: FINAL TP is +50% gains USD
::: recommended strategy: BUY/HOLD after pullback
::: TP BULLS +50% gains
::: SWING TRADE: BUY/HOLD IT
::: bull run not over yet
::: good luck traders!
::: BUY/HOLD and get paid. period.
🔸 Supply/Demand Zones
::: N/A
::: N/A
🔸 Other noteworthy technicals/fundies
::: TD9 /Combo update: N/A
::: Sentiment mid-term: BULLS/50% gains
::: Sentiment short-term: PULLBACK/MODE
RISK DISCLAIMER:
Trading Crypto, Futures , Forex, CFDs and Stocks involves a risk of loss.
Please consider carefully if such trading is appropriate for you.
Past performance is not indicative of future results.
Always limit your leverage and use tight stop loss.

ETCETC found some nice support level. If the level holds and the price breaks out to the upside we can easily get to the $50 level.

ETCETC price discovery is shrinking. This could cause an expansion. If it breaks to the upside major resistance at $52. Lower support around $37.

ETC broke down long term support#ETCUSD
$ETC just like $DOGE broke down the long term ascending support line and confirmed it as resistance, and now price is above a weekly support zone, if price hold this support zone and break the ascending resistance we will see more uptrend.
but I think it is possible to reject from resistance another time and going down to $16.

ETC Weekly Movement (28/09 - 05/10)Hellooo...My Dragon Friends
I see ETC movement similar with DOGE,
i HOPE movement sideways at range 43.65 - 60.00
dont break 43.50, will falling down deep (i Dont HOPE this happen)
Lets See
Happy Trading
Smart Trading
Money Management
Risk Management
Disclaimer On

Ethereum Classic (ETC) - September 28Hello?
Welcome, traders.
By "following", you can always get new information quickly.
Please also click "Like".
Have a nice day.
-------------------------------------
(ETCUSD 1W Chart) - Mid-Long-Term Perspective
Above the 25.179 point: The uptrend is expected to continue.
(1D chart)
Support section: 37.180-47.947
First resistance zone: near point 69.480
Second resistance section: 94.012-101.779
If it falls from the support zone, it is likely to move towards the 16.722 point, so trade cautiously.
-------------------------------------
(ETCBTC 1W Chart) - Mid to Long-Term Perspective
Above the 0.000970 point: An uptrend expected to continue.
(1D chart)
Support section: 0.000723-0.000906
First resistance section: near 0.001374
Second resistance section: 0.001642-0.001825
------------------------------------------
We recommend that you trade with your average unit price.
This is because, if the price is below your average unit price, whether it is in an uptrend or in a downtrend, there is a high possibility that you will not be able to get a big profit due to the psychological burden.
The center of all trading starts with the average unit price at which you start trading.
If you ignore this, you may be trading in the wrong direction.
Therefore, it is important to find a way to lower the average unit price and adjust the proportion of the investment, ultimately allowing the funds corresponding to the profits to regenerate themselves.
------------------------------------------------------------ -----------------------------------------------------
** All indicators are lagging indicators.
Therefore, it is important to be aware that the indicator moves accordingly with the movement of price and volume.
However, for the sake of convenience, we are talking in reverse for the interpretation of the indicator.
** The MRHAB-O and MRHAB-B indicators used in the chart are indicators of our channel that have not yet been released.
(Because it is not public, you can use this chart without any restrictions by sharing this chart and copying and pasting the indicators.)
** The wRSI_SR indicator is an indicator created by adding settings and options to the existing Stochastic RSI indicator.
Therefore, the interpretation is the same as the traditional Stochastic RSI indicator. (K, D line -> R, S line)
** The OBV indicator was re-created by applying a formula to the DepthHouse Trading indicator, an indicator disclosed by oh92. (Thanks for this.)
** Support or resistance is based on the closing price of the 1D chart.
** All descriptions are for reference only and do not guarantee a profit or loss in investment.
(Short-term Stop Loss can be said to be a point where profit and loss can be preserved or additional entry can be made through split trading. It is a short-term investment perspective.)


ETCETC having a potential double bottom with bullish divergence on the RSI. A break above the resistance will take it all the way to $55 range. The price is currently at the 60% fib level.

Bullish on ETCUSD, Possible rebounding incoming!!?? Daily ChartAs we can see on the two channel lines on the chart, ETC is moving inside the channel line(uptrending channel). As we can see, almost every time, the price drops to around EMA 200, it bounces back to a new height. You can refer to the circled spots, where the ETC bounces off the EMA 200. When it bounces off EMA 200, the gain is substantial. This time we are reaching the EMA 200 again, this could be a possible rebound. our EMA 200 has a higher baseline this time, so the rebound could potentially break the previous price rally.
The bears might say, the chinese government is cracking down on the cryptocurrency. Yeah sure, crypto trading has never been legalized in China, the traders use VPN to do their trading. I believe they will continue to do so, unless the chinese government crack down on VPN and block all the internet access to the outside world.

ETC Is Gearing Up for a Massive MoveOctober, November, and December are going to be historic, and memorable for #ethereumclassic $etc.
Trade and invest at your own risk.


ETCUSDI think ,we can see triangle pattern.
Price is weighting trend line.
I think this line not break.
