ETC, breaking out of the downtrend.The following content is machine translation:
In the 4-hour chart, the previous pull-up was supported by the resistance at 46 and dropped to around 40. During this period, a descending trend line was formed, and it has now broken through the descending trend line.
The indicator macd rebounded to the golden fork, and the RSI indicator rushed to the neutral 50 to reach the bullish range.
In terms of operation, grasp the intraday low and more, look at the previous high near 46, and see the breakthrough near 50.
ETCUSD.P trade ideas

ETCUSD - Ascending Triangle BreakoutETC is undergoing a break out
Right now on this 4Hr chart an ascending triangle can be observed, a bullish pattern
The breakout should continue

ETH Classic - ShortHello Traders and Investors,
ETC had a good run, but the top is in for it. HNS on the 5 minute which should push the price down to the closest support. A rebound back up to the neckline is possible after the first support is touched. But a continue in decline of the price is expected.
Let me know what you think.

ETC is at risk of forming a double topetc. There is a risk of forming a double top here
It is recommended to take profit on rallies
If it falls below the neckline and forms a double top, go short decisively
Follow me to take you to achieve financial freedom

Etc :)My imagination. We will go back to the bottom again.. but the currency is very good and has an excellent analysis. Once we return to the bottom, it will rise insanely.. It is not advice to sell or buy,
this analysis was analyzed by Jane's methods of analysis.. the figure drawn for imagination only

ETC USDT long tradeEtc made head and shoulder pattern on one hour time frame possible breakout.
Note : trade at ur own risk good luck


Fib CirclesFibonacci Circles is another indicator based on the Fibonacci Sequence used in technical analysis. It is created by drawing a trend line between two extreme ...

Fib ChannelThe Fibonacci channel is a technical analysis tool that is used to estimate support and resistance levels based on the Fibonacci numbers. It is a variation of the Fibonacci retracement tool, except with the channel the lines run diagonally rather than horizontally.

$ETC - Bounce from 60 period SMA on the 4 hour chart - LONGA simple idea along the lines of my last couple if you've seen, we've had a large expansion when ethereum classic started to get a lot of attention surrounding the merge narrative and mining moving over, a range was set on the break down from that rally and price has managed to break out and is currently come back down to retest it, also lining up with a bounce from the 20 period SMA which I like.
this is a good level to buy imo and i think we go to at least 40.6ish which is towards the top of the prior consolidation before breaking down
tldr
buy 37.6
target 40.6
stop 36ish (below a prior wick and 20 period SMA)
follow me on the tweeter :)

ETCUSDhi traders:As the crypto giant sets the tone and leads the pack, it is evident to see examples of 'impulse-correction-impulse', or 'drop-rally-drop', as you see in the structure clear continuation to up , i set entry and running now.

ETC is expected to rise in 5 waves.The following are machine translations:
On the daily chart, it started to rise from the double bottom structure below, and the low point of the callback continued to rise. This time it was blocked at 45 and fell, and it fell back to the starting point of the big Yangxian on July 28, stopped falling and rebounded, and is expected to rise in the fifth wave.
The indicator macd bullish energy column shrinks, and the RSI indicator lingers in the oversold zone.
Summary: The pattern is expected to rise in 5 waves, and the indicators are all in a bullish trend. At present, the decline has stopped and the rise is expected. The 5th wave is expected to open, and the upper target is near 50.

Bearish ETCETC has shown a top pattern in four hours
and has been broken
There is a high probability that the rebound here will not make a new high
and it will come down again without a new high
Follow me to take you to achieve financial freedom

BCH & ETC 4hr chartsBCH & ETC 4hr chart levels:
BCH
top = 202.32
R3 = 197.72
R2 = 193.12
R1 = 188.53
pivot = 183.93
S1 = 179.33
S2 = 174.73
S3 = 170.13
bottom = 165.53
ETC
top = 24.48
R3 = 23.82
R2 = 23.16
R1 = 22.51
pivot = 21.85
S1 = 21.20
S2 = 20.54
S3 = 19.89
bottom = 19.23
Do your own due diligence, your risk is 100% your responsibility. This is for educational and entertainment purposes only. You win some or you learn some. Consider being charitable with some of your profit to help humankind. Good luck and happy trading friends...
*3x lucky 7s of trading*
7pt Trading compass:
Price action, entry/exit
Volume average/direction
Trend, patterns, momentum
Newsworthy current events
Revenue
Earnings
Balance sheet
7 Common mistakes:
+5% portfolio trades, capital risk management
Beware of analyst's motives
Emotions & Opinions
FOMO : bad timing, the market is ruthless, be shrewd
Lack of planning & discipline
Forgetting restraint
Obdurate repetitive errors, no adaptation
7 Important tools:
Trading View app!, Brokerage UI
Accurate indicators & settings
Wide screen monitor/s
Trading log (pencil & graph paper)
Big, organized desk
Reading books, playing chess
Sorted watch-list
Checkout my indicators:
Fibonacci VIP - volume
Fibonacci MA7 - price
pi RSI - trend momentum
TTC - trend channel
AlertiT - notification
tickerTracker - MFI Oscillator
www.tradingview.com

ETC/USDTHello Traders,
As we discuss in our previous chart ETC now is ready for big short trade.
right now 5 move upside completed & ABC also.
you need to short it in 2 parts.
first form 41 & dca around 57 if it go up..
keep stop loss above 57.
target up to 24$ Minimum.
Have safe trade.
thank you.

looking into a swing = etcif we saw 3 day confirmation and 36 acted as a support and the price action
didnt fell down and closed into the triangle again
50-75 is possible entermediate term.
etc is up more than 200% in the past 3 weeks
ETC before the correction!?ETC found strong resistance near $47.
I am expecting a correction here through $28.50 – 23.00.
If holds, that’s a good level for longs

ETCUSD ❕ trade in rangeETC is moving in a range and the price has recently reached the lower boundary.
Volatility has declined along with trading volumes.
TD Sequential has formed a reversal up signal (4H and 1H TFs)
Price has entered a bullish RSI zone (30m TFs)
I expect that the asset may continue to grow within the range if it breaks up the downward channel and fixes above it.

ETC play book training exerciseThis is more of a training exercise then actual reliable TA.
I have mapped out 3 different paths i personally believe ETC can take in the coming days.
Purple Most likely to Play out
Green 2nd Most Likely to Play out
Yellow Least Likely to Play out
I could also be dead wrong and we drop to the floor.
My goal here is to see if out of the three options any of them have a good success rate.
Then I will be able to learn which direction to take my TA.
Thanks for viewing!

etc ready for take off soonready for take off .. falling wedge almost finished hope adding right now and wait profits

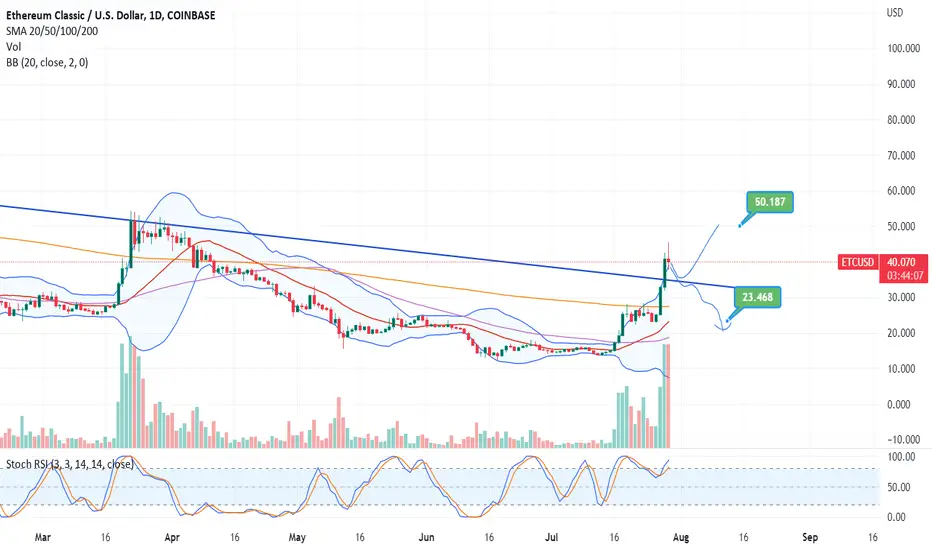
ETCUSD Struggling to break the 1D MA200Ethereum Classic (ETCUSD) has been trading within a long-term Channel Down since late May 2021. This full year of rejections has seen the price make a Lower Low on the -0.236 Fibonacci extension level every time. The Lower High usually comes around the 0.618 Fib, marginally below which the price is now.
In fact, it is struggling to break above the 1D MA200 (orange trend-line), after the rejection on July 19. Technically, with the 1D RSI rejected above the overbought region, this is a sell signal towards at least the 1D MA50 (blue trend-line). Even a marginal break above the 0.618 will still be a sell signal. Make sure you always have the SL tight as the closer we get to the Lower Highs (top) trend-line of the Channel Down, the more likely a break-out becomes. The way it is now, a break above the top (around 41.00 now) signals a complete shift to bullish sentiment on the long-term.
--------------------------------------------------------------------------------------------------------
** Please support this idea with your likes and comments, it is the best way to keep it relevant and support me. **
--------------------------------------------------------------------------------------------------------

ETCUSD ❕ price is over liquidityETC is out of the liquidity zone and downward channel.
Volumes again began to show interest in price growth.
TD Sequential formed a reversal signal upwards (1H TF).
Price tested 100MA as support and 50 as resistance (1H TF)
BB indicator is overbought (30M TF)
I expect ETC to move near resistance level, but after fixing above it will continue to grow.

ETC $50 & $80 Targets in 2022ETC $50 & $80 Targets in 2022.
Take position after breakout and pullback.
