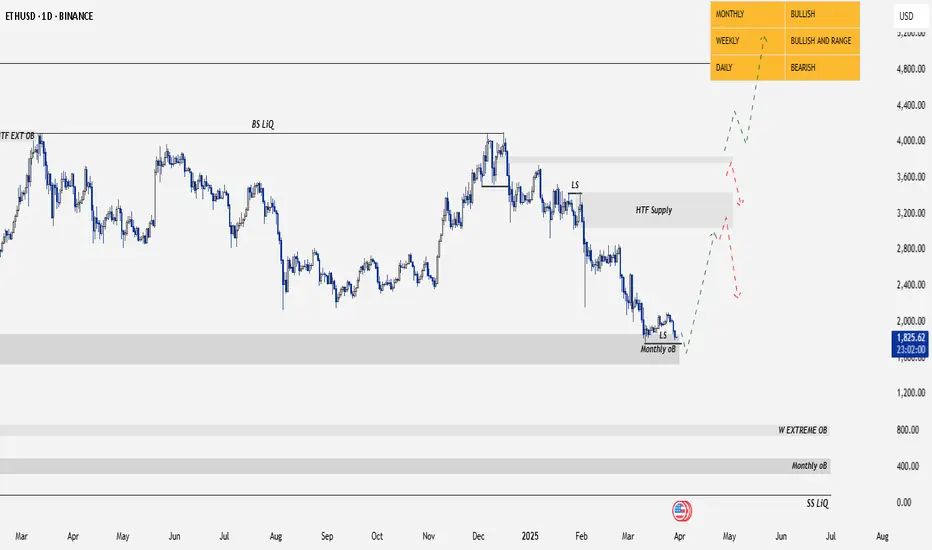
ETH next possible move Hi traders I decided to share with you some of my view in crypto following my strategy,as you can see ETH is in some critical zones n can melt more,what do you do as a buyer,you generate liquidity into demand zone,you dont goo against the market unless you have alot of money then you can buy n hold using good risks ok cool according to my view n analysis am seeing more further down side however I will be expecting aggressive rejection towards 1580 and not sure if is gonna reach 930 but demand zone is at 930,soo am gonna watch very carefully how tarrif on 2 April will affect the market n tension in wars,what is moving market weirdo like this is trade war and in coming civilians war that is talking place slowly but it's becoming more n more each n everyday and it is affecting the market soo more tarrif more drops,that's why is important to understand wat is going on in the world as a trader and investors in order to know when to trade n not too thanks n expect more analysis to come today
ETHBEARUSD trade ideas

ETHEREUM READY FOR TAKEOFF?Hi traders! Analyzing Ethereum (ETH/USD) on the 1H timeframe, spotting a potential entry:
🔹 Entry: 1,840.30 USD
🔹 TP: 1,990.20 USD
🔹 SL: 1,753.70 USD
Ethereum is showing signs of a possible bullish reversal! RSI is near oversold levels, and if momentum picks up, we could see a strong move toward 1,990.20 USD. Eyes on the charts! 📈
⚠️ DISCLAIMER: This is not financial advice. Trade responsibly.

ETH/USDT | Potential Trend Reversal from Monthly Demand Zone📉 Market Overview:
ETH/USDT is currently holding within a strong monthly demand zone, showing signs of possible accumulation. Price has tested this level and indicating a potential reaction.
🔍 Key Trading Conditions:
✅ Liquidity Sweep: If price sweeps the daily previous low, this could be a liquidity grab to trap sellers.
✅ Market Structure Shift (MSS): If price breaks a key lower high to the upside, it would confirm a short term bullish structure shift, signaling a potential trend reversal.
📊 Trade Plan:
🎯 Bullish Confirmation: Wait for a clear MSS to the upside on lower timeframes (4H/1H).
🔹 Entry: After a successful daily low sweep & bullish confirmation.
🔹 SL: Below the liquidity sweep low.
🔹 TP1: Mid-range supply zone.
🔹 TP2: Previous structural highs.
🚨 Risk Management:
Always wait for confirmation before entering.
Monitor price action around key levels.
Manage risk with proper stop-loss placement.
📌 Conclusion:
If ETH sweeps liquidity and shifts structure bullishly, we can expect a potential reversal. Stay patient and let price confirm the move!
📈 Like & Follow for More Market Updates! 🚀
ETHUSD ETHEREUM Long in short termVery hard week for ETHEREUM:
In my opinion eth has a good chance at this level to climb higher
It has nearly brokeen every possible support,but nobuilding signs of deivergences.
The strategy is short term
Never the less ,Trump´s policy is not good nor for crypto neither for other markets.
And thereforwe should think only in short term,taking chances.
On monday /tuesdays positive ton of the white house,on wed/ to Friday aggressive tons,at the weekend then again taming tone of the white house.
This will accompany us until 2029.
Ofcourse it wont be easy.For no one.
Therefor i make 5-10 different strategies,different apporches.
In case the profit targets hit,then its is ok.If not I immediately cut the positions.
STop is below themajor support.
If that level breaks,ETH will potentially fall to 1100-1250. Idont hope,that it happens.But these days,I expect always the unexpected.You may do this,too.
Position sizing: depends on your risk appetite.
I would use stops in any case....Good luck

ETHEREUM Technical Outlook ETHUSD Daily Analysis
Ethereum is currently trading at $1,830, testing a critical support level. The price action suggests two potential scenarios:
📈 Bullish Scenario: A rebound from $1,830 could lead to a push towards the $2,100 resistance zone. A breakout above this level would expose $2,530 as the next key target.
📉 Bearish Scenario: A confirmed break below $1,830 would signal further downside momentum, targeting $1,500 as the next major support level.
📌 Key Levels:
Resistance: $2,100, $2,530
Support: $1,830, $1,500

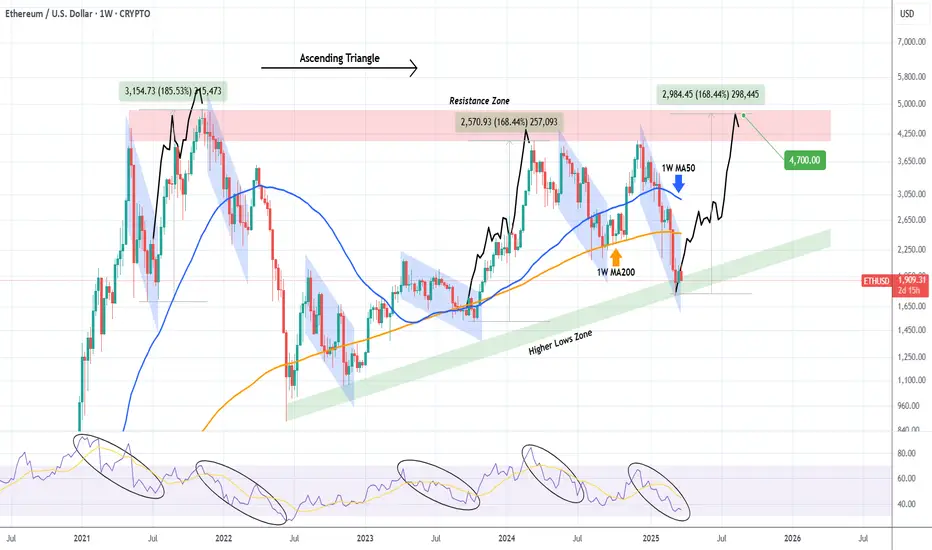
ETHEREUM Targeting 4500-4700Ethereum (ETHUSD) hit 2 weeks ago the bottom (Higher Lows Zone) of its 4-year Ascending Triangle pattern, following the recent 3-month correction.

ETHUSD Bullish ScenarioIn ETHUSD chart shows us clear bullish momentum.
RSI bullish divergence
Double bottom formation
Support zone
Bullish Falling Wedge
All these indicators shows that ETHUSD in upward direction after the breakout of trendline

ETHUSDAfter breaking strong weekly support zone, price went back to retest and dipped. Now we've broken H4 support, could have a retest on H1 before having a downward push but all in all we should reach the next weekly support zone of 1,550 - 1,500.

ETH/USD - The BIG Move is Coming! Are You Ready?
📉 Ethereum is at a critical level right now, and the next move could be explosive!
🔍 Key Insights:
✅ Major Resistance: $3,600 – If broken, ETH could rally to $4,000+!
✅ Strong Support: $3,200 – A breakdown here could lead to $2,900!
✅ Indicators flashing bullish signals – Smart money is already positioning!
💡 What’s Next?
With volatility increasing, a breakout trade could be highly rewarding. Are you going long or short? Drop your thoughts in the comments!
🔥 Like & Follow for real-time updates – Don’t miss the next big move!

Going Long on ETH with 100x Leverage !Alright, let’s talk about a high-probability setup that I’m trading right now—long ETH, stop-loss at $1,935, take-profit at $2,300. This isn’t just a random entry; it’s based on a super reliable pattern called a Running Flat.
What’s a Running Flat?
A Running Flat is a repetitive market structure that occurs all the time—so often, it feels like an infinite money glitch. It plays out nearly 90% of the time, making it one of the easiest and most profitable patterns to trade.
Think of it like a market cheat code:
📌 It traps early shorts
📌 It creates liquidity for smart money
📌 It explodes in the direction of the trend
And when you spot it? You take the trade, set your stop, and let the magic happen.
Why This ETH Trade?
We’ve got a textbook Running Flat formation
The market is primed for a breakout
The EW 2.0 model confirms the setup
Risk is tightly managed (SL at $1,935 means no overexposure)
100x Leverage – High Risk, High Reward
I know what you’re thinking: 100x leverage? Are you crazy? Well, maybe a little. But when you’re trading a setup with a 90% win rate, it’s all about maximizing opportunity while keeping risk under control. Tight stop, big reward. Simple.
The Trade Plan
✅ Go long ETH
✅ Stop-loss: $1,935 (discipline matters)
✅ Take-profit: $2,300 (targeting the move)
✅ Risk-reward: Favorable and repeatable
Final Thoughts
If this trade works, it’s another example of why Running Flats are pure magic. If it doesn’t? No big deal—we trade the next one.
But history says… we’re about to print money. Let’s see if the infinite money glitch delivers again. 🚀


LONGISHBased on market structure, price action and liquidity, expect ETHUSD to move in thos direction.

Ethereum Major Breakout Confirmed, Targeting $7800Ethereum has just confirmed a major breakout above a critical resistance zone, signaling a strong bullish continuation. Here's the detailed breakdown:
1.Ascending Triangle Breakout:
ETHUSD had been consolidating within an ascending triangle pattern since late 2024, with the upper resistance around $4000 and a rising support trendline (highlighted in yellow).
The breakout above $4000 on high volume confirms the bullish pattern, often a precursor to significant upward moves.
2. Accumulation Zone:
Prior to the breakout, ETH spent several months in an accumulation zone between $2000 and $4000. This phase allowed buyers to build positions, setting the stage for the current rally.
3. Price Targets:
The measured move of the ascending triangle (height of the pattern) projects a target around $7800. This is calculated by taking the height of the triangle (from the base at $2000 to the resistance at $4000, which is $2000) and adding it to the breakout point ($4000 + $2000 = $6000). However, considering the momentum and historical price action, the next psychological level at $7800 seems achievable.
4. Support Levels:
The previous resistance at $4000 now acts as strong support. If ETH pulls back, this level should hold to maintain the bullish structure.
Additional support lies around $3000, aligning with the 50-day moving average (not shown but inferred from typical setups).
5. Momentum Indicators:
While the chart doesn’t display specific indicators like RSI or MACD, the sharp upward move suggests strong momentum. Traders should watch for overbought conditions on RSI (above 70) as ETH approaches higher levels, which could signal a potential pullback.

ETH Did his last kiss! Huge upmove inComing I share my thoughts and ideas rarely
I always draw my lines to find out how the majority of people see the charts.
dont want to explain more , but now I think market makers tried their best to show market is bearish , ( as a prove check the fear and greed index ) which made wounder if these prices really are fairly valued or not ?!
anyway , maybe its time for eth to reclaim some shares from market dominance :)
will update this soon ...


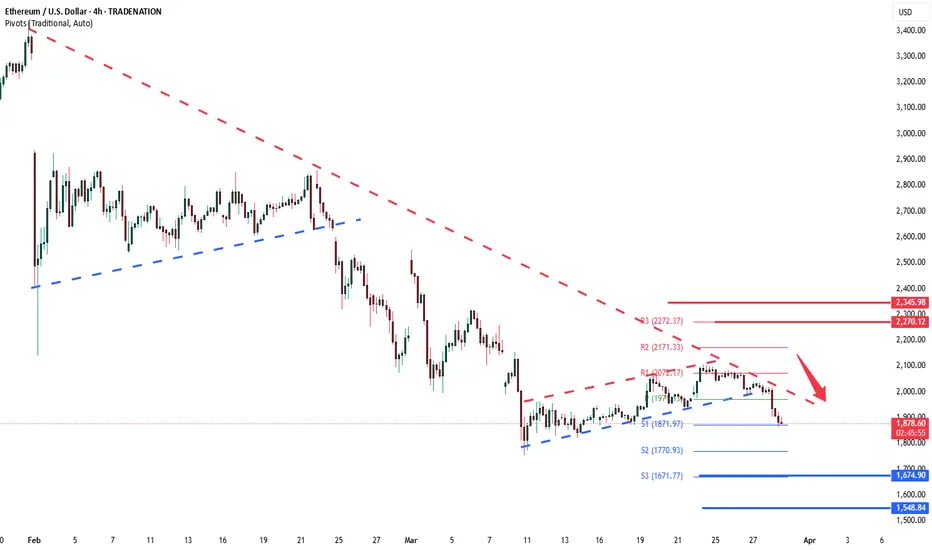
ETHUSD INTRADAY downtrend continuation below 2,171The ETH/USD pair is exhibiting a bearish sentiment, reinforced by the ongoing downtrend. The key trading level to watch is at 2,171, which represents the current intraday swing high and the falling resistance trendline level.
In the short term, an oversold rally from current levels, followed by a bearish rejection at the 2,171 resistance, could lead to a downside move targeting support at 1,872, with further potential declines to 1,770 and 1,670 over a longer timeframe.
On the other hand, a confirmed breakout above the 2,171 resistance level and a daily close above that mark would invalidate the bearish outlook. This scenario could pave the way for a continuation of the rally, aiming to retest the 2,272 resistance, with a potential extension to 2,345 levels.
Conclusion:
Currently, the ETH/USD sentiment remains bearish, with the 2,171 level acting as a pivotal resistance. Traders should watch for either a bearish rejection at this level or a breakout and daily close above it to determine the next directional move. Caution is advised until the price action confirms a clear break or rejection.
This communication is for informational purposes only and should not be viewed as any form of recommendation as to a particular course of action or as investment advice. It is not intended as an offer or solicitation for the purchase or sale of any financial instrument or as an official confirmation of any transaction. Opinions, estimates and assumptions expressed herein are made as of the date of this communication and are subject to change without notice. This communication has been prepared based upon information, including market prices, data and other information, believed to be reliable; however, Trade Nation does not warrant its completeness or accuracy. All market prices and market data contained in or attached to this communication are indicative and subject to change without notice.
Ethereum’s Rebound: V-Shaped Surge to an October 2025 PeakI have come today with a new ETH perspective, one that I think is more accurate than my last ETH TA.
Take a look here at how I got this one wrong, mainly because I was counting too much on this diagonal support to hold. Why didn’t it hold? Because there were too many traders looking at it, and when too many people are watching, the opposite happens, and it breaks.
I would advise looking at this TA first before you carry on with this one because the two tie together neatly.
My view is that from here, we will start a V-shaped recovery that will send ETH to $15,000–$18,000 by mid-October 2025. There is a very interesting fractal playing out that I discovered.
So, my alarm went off with this "Wyckoff Spring" indicator. It has only fired off two other times in history: once at the bottom of the COVID crash and the other time at the December 2016 bottom when ETH was just $8. So, I thought, well, let’s take a look to see if the first cycle has anything interesting.
As soon as I flipped to the daily chart, I immediately saw similarities. What if ETH is forming the fractal from the first cycle before the massive run-up? The timeframe and the drawdown percentages are nearly the same, the fractal is nearly identical, and the fact is, the Wyckoff Spring has fired off now, forming this fractal like in 2016. What are the chances…?
When you overlay the fractal, it lines up with mid-October 2025.
I have scanned the entire history of ETH, and I cannot find a fractal closer to this one. This could very well be the pico bottom for ETH this year.

ETHUSDT"We are in the C wave of a flat pattern, and with the completion of wave C, we expect the start of an upward wave."

ETHUSD Ethereum update 28.03.2025We have reached several Internal liquidity
from this zone, waiting for an upward reaction within 2-4 days.
Best regards EXCAVO

ETH Weakness and the Bearish Flag targeting $1300 levels ETH is currently showing signs of weakness. I anticipated stronger buying pressure and a significant bounce from the $1900 levels. However, this scenario hasn't played out, and instead, a bearish flag has formed on the daily chart. This pattern suggests a potential target around the $1300 range. Stay cautious—avoid FOMO and refrain from entering long positions at this stage.

ETHEREUM Ascending Triangle bottomed and is targeting $4700.Ethereum (ETHUSD) hit 2 weeks ago the bottom (Higher Lows Zone) of its 4-year Ascending Triangle pattern, following the recent 3-month correction. That correction has technically been the pattern's Bearish Leg and during those 4 years we've had another 5 similar to this, all with the exception of one, producing a Higher High.
This is actually more similar to the October 09 2023 and June 21 2021 bottoms, so at worst we should get a +168.44% rally from here that will interestingly enough test the Triangle's top (Resistance Zone) a $4700.
-------------------------------------------------------------------------------
** Please LIKE 👍, FOLLOW ✅, SHARE 🙌 and COMMENT ✍ if you enjoy this idea! Also share your ideas and charts in the comments section below! This is best way to keep it relevant, support us, keep the content here free and allow the idea to reach as many people as possible. **
-------------------------------------------------------------------------------
💸💸💸💸💸💸
👇 👇 👇 👇 👇 👇
ETH PoV - 1.600$? Ethereum is going through a phase of challenges and opportunities, with its current price approaching the target i've set for a potential purchase of $1600. In recent months, Ethereum has faced a significant price correction, with Ether's value dropping by about 40%, largely due to the growing competition from other blockchains like Solana and Cardano, which are gaining popularity due to their speed and low transaction costs. Additionally, the rise of memecoins and recent developments in the cryptocurrency regulatory landscape have shifted attention away from Ethereum, while other cryptocurrencies, such as Bitcoin, seem to enjoy greater favor among investors. Internally, Ethereum is still facing delays and challenges related to technical updates, as well as some tensions within the developer community, which has made it harder to maintain market leadership. The decision not to acquire Ether for a U.S. cryptocurrency reserve by the Trump administration has also disappointed many investors, fueling outflows from ETFs invested in Ethereum. Despite these difficulties, long-term prospects for Ethereum remain positive. In fact, some analysts suggest that if demand and supply stabilize, and if Ethereum can overcome internal challenges and effectively respond to competition, it could reach new all-time highs, with a target potentially surpassing $5000 in the next 12 months. This scenario is supported by the continued interest in ETFs that invest in Ether, the expansion of its network, and improvements in regulations, which could further incentivize institutional and retail adoption. Ultimately, while there are risks to consider, investing in Ethereum could be highly rewarding in the long term, with the possibility that the cryptocurrency could recover ground and set new value records in the next 12 months. Achieving a $5000 target, however, will depend on Ethereum's ability to innovate, address internal issues, and navigate the evolving regulatory landscape, but if it can maintain its central role in the cryptocurrency ecosystem, it may continue to grow significantly.
