ETH MOST POSSIBLE TPSThat is most possible movement from eth
Bottom line
1550-1900
Midtearm tps
Tp1 4000
Tp2 7000
Tp3 10000
Long tearm tps
Tp1 10000
Tp2 25000
Tp3 45000
ETHBEARUSD trade ideas

Possible buy on ethereumPrice retesting the liquidity void formed by the gap expecting price to continue with uptrend with final targets at 3262
day two price prediction for eth date:3/27/2025i have found a few more possibilities starting bearish and ending bullish much like my btc price prediction today but i feel eth has higher chance of going up more than down.

ETH USD ShortTrumps hope rally doesnt change in real fundamentals.
ETHUSD definitley a MUST-Short to me.
I cover the sells there where hype is the biggest: Others buy breakouts,or set their stops and take profits,I sell exactly those levels.

ETHUSD Buy Opportunity – Key 30m POI Support Zone COINBASE:ETHUSD
Ethereum (ETH/USD) has reached a key 30m POI (demand zone) at 1,987 - 1,994 , offering a potential buy opportunity. If this level holds, we could see a push toward 2,066.85.
📌 Trade Setup:
✅ Entry: 1,994.64
✅ Take Profit: 2,066.85
✅ Stop Loss: 1,978.50
A strong reaction here could trigger a bullish move. Are you taking this trade? 🚀

ethuusd buying change1 day support retest and reject
so next tp wealy support
tp 1 is 1 day last high CRYPTO:ETHUSD

ethusd short looks like higher time frame bearish retest is complete and price wants an impulse move in the direction of the predominant trend which is downwards

ETHUSD ETHEREUM Long following TechNasdaq turns, crypto follows.
Eth,Solana and bitcoin ,also XRP temporarily changing their directions to follow tech hype, and Trump´s tariffs-announcments.
There is no rational reason in behind of it: As traders we never care,what people say or do! We only follow the price,changes,and our trading rules.Only! What others say in the news or Social media, doesnt care us as traders,because we have understood that only the market is right.If the market says,go long,we follow.If market says,Sell! Then we go short.
Also dealing with quick profit taking is essential. We see that our profit target showing us attractive and lucrative profit numbers, and we get emotional: But the market says:Take that little profit and Get out here! Or Come with me in my direction,otherwise I will take away your profits!
As traders we have no emotional, and zero tolerance for emotional issues,regarding trading!
Therefor we are flexible. We have only one goal: Making Money!
As much and as many as we can! sIMPLE1
4 approches,with short term,midterm,profit taking targets.
Also keep it mind that the green zones are no stop loss zones,but they represent areas where we can cover more longs.

ETHUSD-BUY strategy 6 hourly KAGI chartIt feels possible that we may have seen a temporary bottom for ETH for the short-term. We are basing, and the change is of $ 2,350 test again.
Long-term seeing much lower levels, but its as noted a short-term chart and idea.
Strategy BUY current $ 1,875- 1,950 and take profit near $ 2,275 for now.


1 day chart eth price prediction date:3/26/2025using the triangle elliotwave and gann fan predicting a possible outcome of 3k on ethereum

daily price prediction for eth 2hr date:3/26/2025using the elliott wave pattern and gann fan i have found a possible outcome for BINANCE:ETHUSD to go around 3000$

The key is whether it can rise to 2271.0-2356.31
Hello, traders.
If you "Follow", you can always get new information quickly.
Please also click "Boost".
Have a nice day today.
-------------------------------------
The April TradingView competition is sponsored by PEPPERSTONE.
Accordingly, we will look at the coins (tokens) and items that can be traded in the competition.
I will talk about the ETHUSD chart.
--------------------------------------
(ETHUSD 1W)
If you look at the 1W chart, you can see how important the current price position is.
If it continues to decline this time, it is likely to fall to around 1337.54.
Therefore, the key is whether it can maintain the price by rising near the Fibonacci ratio of 0.236 (2089.91).
In order to turn upward on the 1W chart, it must rise near the Fibonacci ratio of 0.382 (2646.14) and maintain the price.
-
(1D chart)
Since the HA-Low indicator on the 1D chart is formed at the point of 1935.88, the key is whether it can receive support and rise near this area.
If it does not and falls below 1871.55, it is highly likely to fall to around 1626.95.
-
The M-Signal indicator on the 1W and 1M charts is passing near the Fibonacci ratio of 0.382 (2646.14).
Therefore, in order to turn into an uptrend, the price must rise above the M-Signal indicator on the 1W and 1M charts and be maintained.
To do so, we need to see if it can naturally rise above the M-Signal indicator on the 1W and 1M charts while maintaining the price by rising around 2271.0-2356.31.
However, in order to continue the uptrend, it is expected that the price must rise above the Fibonacci ratio of 0.382 (2646.14) and be maintained.
-
If the OBV does not rise above the upper line of the price channel and show an uptrend, it is likely that it will be difficult to sustain even if an uptrend appears.
The StochRSI indicator is showing a downward trend in the overbought zone.
Therefore, if the StochRSI indicator turns upward again and maintains the price around 1935.88, it is expected that it will lead to an attempt to rise to around 2271.0.
Therefore, when the competition started,
- If the StochRSI indicator did not turn upward,
- If the OBV did not rise above the upper line and showed an upward trend,
- If it did not receive support near 1935.88, it is expected that the SHORT position would be advantageous.
-
Thank you for reading to the end.
I hope you have a successful trade.
--------------------------------------------------
- Here is an explanation of the big picture.
I used TradingView's INDEX chart to check the entire range of BTC.
I rewrote the previous chart to update it while touching the Fibonacci ratio range of 1.902 (101875.70) ~ 2 (106275.10).
(Previous BTCUSD 12M chart)
Looking at the big picture, it seems that it has been maintaining an upward trend following a pattern since 2015.
That is, it is a pattern that maintains a 3-year bull market and faces a 1-year bear market.
Accordingly, the bull market is expected to continue until 2025.
-
(Current BTCUSD 12M chart)
Based on the currently written Fibonacci ratio, it is displayed up to 3.618 (178910.15).
It is expected that it will not fall again below the Fibonacci ratio of 0.618 (44234.54).
(BTCUSDT 12M chart)
Based on the BTCUSDT chart, I think it is around 42283.58.
-
I will explain it again with the BTCUSD chart.
The Fibonacci ratio ranges marked in the green boxes, 1.902 (101875.70) ~ 2 (106275.10) and 3 (151166.97) ~ 3.14 (157451.83), are expected to be important support and resistance ranges.
In other words, it seems likely that they will act as volume profile ranges.
Therefore, in order to break through these ranges upward, I think the point of interest is whether they can be supported and rise near the Fibonacci ratios of 1.618 (89126.41) and 2.618 (134018.28).
Therefore, the maximum rising range in 2025 is expected to be the 3 (151166.97) ~ 3.14 (157451.83) range.
In order to do that, we need to see if it is supported and rises near 2.618 (134018.28).
If it falls after the bull market in 2025, we don't know how far it will fall, but based on the previous decline, we expect it to fall by about -60% to -70%.
Therefore, if it starts to fall near the Fibonacci ratio of 3.14 (157451.83), it seems likely that it will fall to around Fibonacci 0.618 (44234.54).
I will explain more details when the bear market starts.
------------------------------------------------------

ETHEREUM Is $14000 even possible??Short answer? Yes it is.
Ethereum / ETHUSD is trading inside a 7 year Channel Up and lately has found itself under the 0.618 Fibonacci retracement level for the first time since November 2020.
This is technically a temporary overreaction like the bullish breakout over the 0.382 Fib in March 2024.
Based on the final year rallies inside this Channel Up, we can clearly see that, though very optimistic, $14000 is within reach and won't even be at the top of the Channel Up.
Follow us, like the idea and leave a comment below!!

(ETH/USD) Poised for a Major BreakoutMarket Structure & Analysis:
Falling Wedge Breakout: Ethereum previously broke out of a falling wedge pattern, which is a bullish reversal signal.
Ascending Triangle Formation: Price is currently forming an ascending triangle, indicating potential for a breakout.
Support Levels:
$2,021 – Local support.
$1,926 - $1,873 – Strong demand zone.
Resistance Levels:
$2,120 - $2,251 – First resistance zone.
$2,531 - $2,564 – Final bullish target zone.
Trading Plan:
Buy Setup:
Enter long on breakout above $2,120 with strong momentum.
Stop Loss: Below $2,021 (support level).
Take Profit Targets:
TP1: $2,251 (first resistance).
TP2: $2,531 (main target).
TP3: $2,564 (extended bullish target).
Risk Factors:
A failure to break $2,120 could result in a pullback to $1,926.
Macroeconomic factors or Bitcoin’s movement may impact Ethereum’s trend.

ETH Quick sell to double bottom then buy*I am in no way a financial advisor and you should always do your own due diligence before placing any trade. Do not trade what you are not comfortable with losing. No trade is guaranteed.
SL 2163
TP 1761

ETHUSD is testing multi year support. I bought today.ETH is currently at a critical juncture. The price is testing a key support level at 2,074.52 USD after a 31% pullback from its recent high. Technical indicators like RSI and volume suggest that the downward momentum may be slowing, but confirmation of a reversal is needed (e.g., a break above 2,281.03 USD with increased volume). On the other hand, a break below 2,074.52 USD could lead to further downside.
For Bulls: If you’re looking to buy ETH, watch for a strong bounce at this support level with confirmation from volume and RSI. A break above 2,281.03 USD would be a good entry point for a potential swing trade targeting 2,984.22 USD.
For Bears: If the price breaks below 2,074.52 USD, it could be a good opportunity to short ETH with a target of 1,800 USD or lower.
For Long-Term Holders: The current pullback appears to be a normal correction after a strong uptrend. If you believe in ETH’s long-term fundamentals (e.g., its role in DeFi, staking, and layer-2 scaling), this could be a good level to accumulate, especially if the price holds above 2,074.52 USD.

The ETHUSD market is bullishETHUSD has currently successfully broken through the resistance level of 2,100 and has re-entered a new range.
The ETHUSD market is bullish. The current price is 2,075, and the intraday fluctuation range is between 2,044 and 2,080. There are signs that ETHUSD has initially formed a bottom. Judging from the 4-hour candlestick chart, the price is attempting to break through upwards, with the key resistance level at 2,160.
Looking ahead to 2025, the expected price range of ETHUSD is between 2,904 and 4,887. This week, ETHUSD has shown a strong and positive performance. In the following period, the key focus should be on whether ETHUSD can break through the key resistance level of 2,160, which will play a decisive role in its short-term and medium-term trends.
💎💎💎 ETHUSD 💎💎💎
🎁 Buy@2040 - 2050
🎁 TP 2070 2080 2090
The market has been extremely volatile lately. If you can't figure out the market's direction, you'll only be a cash dispenser for others. If you also want to succeed,Follow the link below to get my daily strategy updates

ETHDISCLAMER ON !!!!
ETH Support $1.749 and target $2.600
The market is not yet bullish in the short term, so buying must be disciplined cutloss
For the long term, you can buy in installments

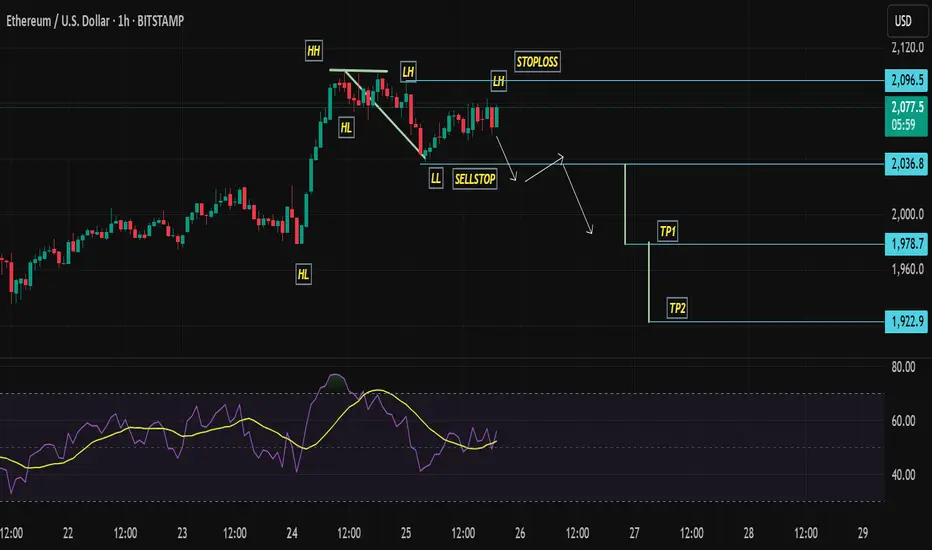
ETHUSDBearish trend with bear continuation flag and double top formation. indicating a possible bearish trend.
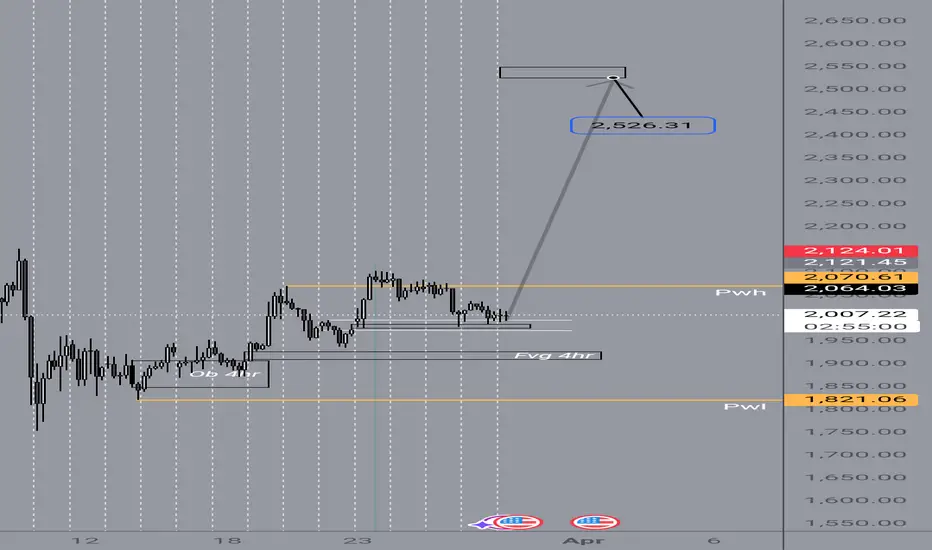
Ethereum (ETH/USD) Bullish Breakout – Eyes on $2,500+ Target 📈 Chart Overview:
Timeframe: 4H (Ethereum/USDT)
Trend Reversal: Ethereum has broken out of a falling wedge pattern, indicating a shift from bearish to bullish momentum.
Support Level: Around $1,800 - $1,900, where price previously found strong buying interest.
Retest Confirmation: ETH successfully retested the breakout level (~$2,020), confirming a potential bullish continuation.
Resistance Zone: The next key resistance area is around $2,250, followed by a potential move towards the $2,530 - $2,550 target zone.
📊 Trade Setup:
Bullish Bias: Price action suggests an upward move towards $2,250 and potentially $2,530.
Risk Management: A stop-loss can be set below $2,020 to minimize downside risk.
🔥 Conclusion: If Ethereum maintains momentum above the retest zone, it could see a strong rally in the coming days! 🚀

Ethereum elliot wave cycleEthereum has tested the price in the 1800 zone and in the low zone of the trend after an ABC correction in 3 moves which could give more pullback moves to go up maybe it could reach 1500 and then go up.

LTCUSD INTRADAY at decisive point Technical Analysis of LTC/USD
Trend Overview: LTC/USD exhibits a neutral sentiment within a prevailing range-bound trading structure. The recent price action suggests an oversold bounce-back, forming a bearish sideways consolidation. This indicates indecision in the market, with neither bulls nor bears taking full control.
Key Levels:
Resistance: 960.00, 988.50, 1031.40
Support: 883.00, 840.10, 808.80
Price Action Analysis: The key resistance level at 960.00 serves as a crucial pivot point. An oversold rally from current levels could face rejection at this zone, leading to further downside movement. Failure to break this resistance may result in renewed bearish momentum, targeting lower support levels at 883.00, followed by 840.10 and 808.80 in the longer timeframe.
Alternatively, a confirmed breakout and daily close above 960.00 would shift sentiment to bullish, potentially opening the door for an upward move towards 988.50 resistance. Further bullish momentum could drive LTC/USD to 1031.40, reinforcing a stronger uptrend.
Conclusion: LTC/USD remains in a consolidation phase, with the 960.00 level acting as a decisive point for future price direction. A bearish rejection at this level could reinforce a downward trajectory, while a breakout above it would invalidate the bearish bias, signaling potential further gains. Traders should closely monitor price action near 960.00 to assess the next significant move.
This communication is for informational purposes only and should not be viewed as any form of recommendation as to a particular course of action or as investment advice. It is not intended as an offer or solicitation for the purchase or sale of any financial instrument or as an official confirmation of any transaction. Opinions, estimates and assumptions expressed herein are made as of the date of this communication and are subject to change without notice. This communication has been prepared based upon information, including market prices, data and other information, believed to be reliable; however, Trade Nation does not warrant its completeness or accuracy. All market prices and market data contained in or attached to this communication are indicative and subject to change without notice.
