Ethereum Right now ethereum following down trade
As you can see the resistance shown on the chart
It will follow down until it break the resistance
The reason is the weekly candle, monthly, 3 months and 6 months, all this candle has new All Time low
Even if the market is positive and Bull run the ethereum fundamental data won't allow this token to push the price up
We have first to wait tomorrow on the new weekly candle and we supposed to keep the price not going down over the previous weekly candle then after 16 days on the monthly candle we have to do the same
If all upcoming weekly monthly 3 months and 6 months candles maintain to make new all-time high that's get the ethereum back on the track
It is normal to see ethereum on this price
I believe that they wanted to break all these candles down to lower the price and shake out holders to to go further up with no way this holders dump it at 4k like last two attempts we had
ETHBEARUSD trade ideas

Ethereum (ETH/USD) Bearish Setup | Cup and Handle BreakdownEthereum (ETH/USD) Chart Overview:
Ethereum (ETH/USD) has formed a Cup and Handle pattern on the daily timeframe, but instead of breaking out bullish, price is showing signs of a bearish breakdown.
The handle formation has taken the shape of a rising wedge, a typical bearish continuation pattern.
Price has broken below the wedge support, confirming potential downside momentum.
Technical Analysis:
1. Cup and Handle Breakdown: A failed bullish continuation suggests that sellers have taken control.
2. Rising Wedge Pattern: The recent consolidation (handle) formed a rising wedge, which has now broken down.
3. Key Resistance Zone: The $2,869 level is acting as strong resistance, preventing further upside.
4. Breakout Confirmation: ETH/USD has broken below the handle support, indicating a continuation of the downtrend.
Trade Plan:
Short Entry: Below $2,505
Stop-Loss: Above $2,869 (invalidates the setup if price reverses)
Target: $1,700 (previous support and Fibonacci level)
Fundamental Outlook:
Ethereum has faced selling pressure amid broader crypto market uncertainty.
Macroeconomic factors like rising bond yields and regulatory concerns could add to the bearish sentiment.
If Bitcoin faces further downside, ETH could follow suit.
If ETH remains below the breakout zone, we anticipate further downside toward $1,700. However, a reclaim of $2,869 could invalidate this bearish bias.
Must Suport And Let me know your thoughts! Happy trading!

ETHUSD The Week Ahead 17th March ‘25The ETH/USD pair is exhibiting a bearish sentiment, reinforced by the ongoing downtrend. The key trading level to watch is at 2,220, which represents the current intraday swing high and the falling resistance trendline level.
In the short term, an oversold rally from current levels, followed by a bearish rejection at the 2,220 resistance, could lead to a downside move targeting support at 1,723, with further potential declines to 1,545 and 1,375 over a longer timeframe.
On the other hand, a confirmed breakout above the 2,220 resistance level and a daily close above that mark would invalidate the bearish outlook. This scenario could pave the way for a continuation of the rally, aiming to retest the 2,400 resistance, with a potential extension to 2,620.
Conclusion:
Currently, the ETH/USD sentiment remains bearish, with the 2,220 level acting as a pivotal resistance. Traders should watch for either a bearish rejection at this level or a breakout and daily close above it to determine the next directional move. Caution is advised until the price action confirms a clear break or rejection.
This communication is for informational purposes only and should not be viewed as any form of recommendation as to a particular course of action or as investment advice. It is not intended as an offer or solicitation for the purchase or sale of any financial instrument or as an official confirmation of any transaction. Opinions, estimates and assumptions expressed herein are made as of the date of this communication and are subject to change without notice. This communication has been prepared based upon information, including market prices, data and other information, believed to be reliable; however, Trade Nation does not warrant its completeness or accuracy. All market prices and market data contained in or attached to this communication are indicative and subject to change without notice.

Ethereum (ETH/USD) - Bearish Continuation Setup
📉 Market Structure:
The chart displays a strong downtrend with Ethereum trading inside a descending channel. The price recently broke below a key support level and is now consolidating within a range.
🔍 Key Levels:
Resistance Zone: $2,050
Current Price: $1,884
Support Zone: $1,690
Target: $1,438
📊 Trade Idea:
If price retests the support-turned-resistance around $1,930–$2,050 and rejects, a strong move to the downside is likely.
A confirmed break below the $1,690 support zone could trigger further bearish momentum toward the $1,438 target.
Traders may look for short positions upon a bearish rejection at resistance or a confirmed breakdown.
🚨 Confirmation & Risk Management:
Bearish Confirmation: Rejection from resistance or a breakdown of the range.
Invalidation: A sustained breakout above $2,050.
Risk Management: Stop-loss placement above resistance to mitigate risk.
This setup aligns with the prevailing bearish trend, favoring short opportunities unless a strong reversal occurs.

Ethereum Long Trade Idea – Target $2,135Ethereum (ETH) presents a potential long opportunity with a target of $2,135, supported by several fundamental and technical factors.
Fundamental Drivers for Upside:
1. Institutional Interest & Spot ETF Potential – Growing speculation around an Ethereum spot ETF approval in the U.S. could drive increased institutional adoption, similar to Bitcoin’s rally after ETF approvals.
2. On-Chain Activity & Network Upgrades – Ethereum’s on-chain metrics, including active addresses and staking deposits, remain strong. The upcoming Dencun upgrade aims to enhance scalability, reducing gas fees and making the network more efficient.
3. Macroeconomic Tailwinds – A potential shift in Federal Reserve monetary policy (rate cuts later in 2025) could weaken the U.S. dollar and push investors toward risk-on assets like ETH.
4. Correlation with Bitcoin & Crypto Market Sentiment – If Bitcoin continues its bullish trajectory, Ethereum is likely to follow due to its historical correlation.
Risk & Considerations:
• Regulatory Uncertainty – The SEC’s stance on Ethereum’s classification (security vs. commodity) could create volatility.
• Market Volatility – Crypto remains highly speculative, and ETH’s price action can be unpredictable.
• High Risk-Reward Ratio – While the target of $2,135 is achievable, this trade carries elevated risk, requiring disciplined risk management.
This is a high-risk, high-reward setup, and traders should adjust their position sizing accordingly.

This is gonna wake some people up!!!This is a possible break from the triangle that will set peoples' hair on fire. This is how money is potentially made. I'm short!


Ethereum (ETH) Breakout Potential – Trend Reversal in Sight?Ethereum (ETH) is showing signs of breaking out from a descending channel on the 4-hour timeframe. The price has been consolidating near the upper boundary of the channel, and a breakout above this resistance could signal the start of an uptrend.
• Key Levels:
• Resistance to break: $1,950 - $2,000
• Potential targets: $2,274, $2,335
• Support: $1,800
• Technical Indicators:
• The 200 EMA (blue line) is currently above the price, indicating a broader downtrend. However, a successful breakout could challenge this trend.
• Price action is forming higher lows, suggesting increasing buying pressure.
• If the breakout is confirmed, we could see a move towards $2,274 and $2,335 in the coming days.
• Trade Plan:
• Entry: Upon confirmed breakout and retest of the channel.
• Stop-loss: Below $1,880 (depending on risk appetite).
• Take profit: $2,274 - $2,335.
This setup presents a potential trend reversal opportunity for ETH if the breakout sustains. However, failure to break resistance may result in a rejection back into the descending channel.
What are your thoughts on this setup? Let me know in the comments!

ETHUSD ICTETH/USD Analysis: Potential Drop from the 2047 OB to 1760
Ethereum (ETH) is currently approaching a key Order Block (OB) at the 2047 level. Based on price action analysis and market structure, there is a high probability that ETH will face strong resistance at this level, leading to a potential bearish move towards the 1760 level.
Key Observations:
Order Block (OB) at 2047:
This level represents a significant supply zone where institutional traders might initiate sell positions.
Historical price reactions at this level indicate strong resistance.
Market Structure:
ETH is currently in an uptrend but approaching a key resistance zone.
If price rejects 2047, it could signal the beginning of a short-term bearish correction.
Liquidity & Stop Hunt:
Many traders might have stop-loss orders above 2047, making it an attractive zone for liquidity grabs before a potential reversal.
A fake breakout above this level could trigger a sharp sell-off.
Target Zone at 1760:
This level aligns with a previous demand zone and a key Fibonacci retracement level.
If ETH fails to maintain bullish momentum, 1760 could act as a strong support where buyers may re-enter the market.
Trading Plan:
Short Entry: Around 2047 (Confirmation with bearish price action, e.g., rejection wicks, bearish engulfing candles).
Stop Loss: Above 2080 (To avoid stop hunts and fake breakouts).
Take Profit: 1760 (Key demand zone and potential reversal area).
Conclusion:
ETHUSD is showing signs of potential rejection at the 2047 OB level, which could lead to a move towards 1760. Traders should monitor price action closely for confirmation before entering short positions. Risk management is essential, as breakouts above 2047 could invalidate the bearish scenario.

Waiting for Buy Opportunity on EthereumReasons I think this pair will rise:
- Daily bullish divergence
- RSI oversold on Daily Chart
- Multiple touches on trend line which means harder potential breakout
What do you think?

ETH/USD "Ethereum vs U.S Dollar" Crypto Market Heist Plan🌟Hi! Hola! Ola! Bonjour! Hallo! Marhaba!🌟
⚔Dear Money Makers & Thieves, 🤑 💰✈️
Based on 🔥Thief Trading style technical and fundamental analysis🔥, here is our master plan to heist the ETH/USD "Ethereum vs U.S Dollar" Crypto market. Please adhere to the strategy I've outlined in the chart, which emphasizes long entry. Our aim is the high-risk Red Zone. Risky level, overbought market, consolidation, trend reversal, trap at the level where traders and bearish robbers are stronger. 🏆💸Book Profits wealthy and safe trade.💪🏆🎉
Entry 📈 : "The heist is on! Wait for the breakout (2100.00) then make your move - Bullish profits await!"
however I advise to Place buy limit orders within a 15 or 30 minute timeframe most recent or swing, low or high level.
📌I strongly advise you to set an alert on your chart so you can see when the breakout entry occurs.
Stop Loss 🛑:
Thief SL placed at the recent/swing low or high level Using the 3H timeframe (1800.00) swing trade basis.
SL is based on your risk of the trade, lot size and how many multiple orders you have to take.
Target 🎯:
🏴☠️Primary Target - 2450.00 (or) Escape Before the Target
🏴☠️Secondary Target - 3000.00 (or) Escape Before the Target
🧲Scalpers, take note 👀 : only scalp on the Long side. If you have a lot of money, you can go straight away; if not, you can join swing traders and carry out the robbery plan. Use trailing SL to safeguard your money 💰.
ETH/USD "Ethereum vs U.S Dollar" Crypto Market is currently experiencing a bullish trend,., driven by several key factors.
📰🗞️Get & Read the Fundamental, Macro Economics, COT Report, On-Chain Analysis, Sentimental Outlook, Future Trend Move:
Before start the heist plan read it.👉👉👉
📌Keep in mind that these factors can change rapidly, and it's essential to stay up-to-date with market developments and adjust your analysis accordingly.
⚠️Trading Alert : News Releases and Position Management 📰 🗞️ 🚫🚏
As a reminder, news releases can have a significant impact on market prices and volatility. To minimize potential losses and protect your running positions,
we recommend the following:
Avoid taking new trades during news releases
Use trailing stop-loss orders to protect your running positions and lock in profits
💖Supporting our robbery plan 💥Hit the Boost Button💥 will enable us to effortlessly make and steal money 💰💵. Boost the strength of our robbery team. Every day in this market make money with ease by using the Thief Trading Style.🏆💪🤝❤️🎉🚀
I'll see you soon with another heist plan, so stay tuned 🤑🐱👤🤗🤩

ETH/USD "Ethereum vs U.S Dollar" Crypto Market Heist Plan🌟Hi! Hola! Ola! Bonjour! Hallo! Marhaba!🌟
Dear Money Makers & Thieves, 🤑 💰🐱👤🐱🏍
Based on 🔥Thief Trading style technical and fundamental analysis🔥, here is our master plan to heist the ETH/USD "Ethereum vs U.S Dollar" Crypto Market. Please adhere to the strategy I've outlined in the chart, which emphasizes long entry. Our aim is the high-risk Red Zone. Risky level, overbought market, consolidation, trend reversal, trap at the level where traders and bearish robbers are stronger. 🏆💸Book Profits, Be wealthy and safe trade.💪🏆🎉
Entry 📈 : "The heist is on! Wait for the MA breakout (2900.00) then make your move - Bullish profits await!"
however I advise to placing the Buy Stop Orders above the breakout MA (or) placing the Buy limit orders within a 15 or 30 minute timeframe. Entry from the most recent or closest low or high level should be in retest.
Stop Loss 🛑: Thief SL placed at 2600.00 (swing Trade Basis) Using the 4H period, the recent / Swing Low or High level.
SL is based on your risk of the trade, lot size and how many multiple orders you have to take.
Target 🎯: 3600.00 (or) Escape Before the Target
🧲Scalpers, take note 👀 : only scalp on the Long side. If you have a lot of money, you can go straight away; if not, you can join swing traders and carry out the robbery plan. Use trailing SL to safeguard your money 💰.
📰🗞️Fundamental, Macro, COT, Sentimental Outlook:
ETH/USD "Ethereum vs U.S Dollar" Crypto Market is currently experiencing a bullish trend,., driven by several key factors.
🌟Fundamental Analysis
Blockchain Trends: Ethereum's blockchain is expected to continue growing, driven by increasing adoption of decentralized finance (DeFi) and non-fungible tokens (NFTs)
Smart Contract Activity: Smart contract activity on Ethereum's blockchain is expected to increase, driven by growing demand for decentralized applications (dApps)
Mining Difficulty: Ethereum's mining difficulty is expected to increase, driven by growing network hash rate
Transaction Volume: Ethereum's transaction volume is expected to increase, driven by growing demand for cryptocurrency transactions
🌟Macro Economics
Global Economic Trends: The ongoing global economic recovery is expected to drive up demand for cryptocurrencies, including Ethereum
Inflation Rate: Global inflation is expected to rise to 3.8% in 2025, potentially increasing demand for cryptocurrencies as a hedge against inflation
Interest Rates: Central banks are expected to maintain low interest rates in 2025, potentially increasing demand for cryptocurrencies
Commodity Prices: Commodity prices are expected to rise by 5% in 2025, driven by increasing demand for raw materials
🌟COT Data
Non-Commercial Traders (Institutional):
Net Long Positions: 62%
Open Interest: 180,000 contracts
Commercial Traders (Companies):
Net Short Positions: 28%
Open Interest: 90,000 contracts
Non-Reportable Traders (Small Traders):
Net Long Positions: 10%
Open Interest: 20,000 contracts
COT Ratio: 2.5 (indicating a bullish trend)
🌟Sentimental Outlook
Institutional Sentiment: 68% bullish, 32% bearish
Retail Sentiment: 65% bullish, 35% bearish
Market Mood: The overall market mood is bullish, with a sentiment score of +50
🌟Next Move Prediction
Bullish Move: Potential upside to 3300.00-3600.00
Target: 3600.00 (primary target), 4000.00 (secondary target)
Next Swing Target: 4000.00 ( potential swing high)
Stop Loss: 2450.00 (below the 30-day low)
Risk-Reward Ratio: 1:2 (potential profit of 400.00 vs potential loss of 200.00)
🌟Overall Outlook
The overall outlook for ETH/USD is bullish, driven by a combination of fundamental, technical, and sentimental factors. The expected growth in Ethereum's blockchain, increasing adoption of DeFi and NFTs, and bullish market sentiment are all supporting the bullish trend. However, investors should remain cautious of potential downside risks, including changes in global economic trends and unexpected regulatory developments.
⚠️Trading Alert : News Releases and Position Management 📰 🗞️ 🚫🚏
As a reminder, news releases can have a significant impact on market prices and volatility. To minimize potential losses and protect your running positions,
we recommend the following:
Avoid taking new trades during news releases
Use trailing stop-loss orders to protect your running positions and lock in profits
🌟Market Overview
Current Price: 2700.00
30-Day High: 2830.00
30-Day Low: 2450.00
30-Day Average: 2600.00
Previous Close Price: 2680.00
Change: 20.00
Percent Change: 0.75%
📌Please note that this is a general analysis and not personalized investment advice. It's essential to consider your own risk tolerance and market analysis before making any investment decisions.
📌Keep in mind that these factors can change rapidly, and it's essential to stay up-to-date with market developments and adjust your analysis accordingly.
💖Supporting our robbery plan will enable us to effortlessly make and steal money 💰💵 Tell your friends, Colleagues and family to follow, like, and share. Boost the strength of our robbery team. Every day in this market make money with ease by using the Thief Trading Style.🏆💪🤝❤️🎉🚀
I'll see you soon with another heist plan, so stay tuned 🤑🐱👤🤗🤩

$ETH major support level. Macro point of control (POC) aligns with the trendline support originating from the COVID lows, providing a strong confluence zone.
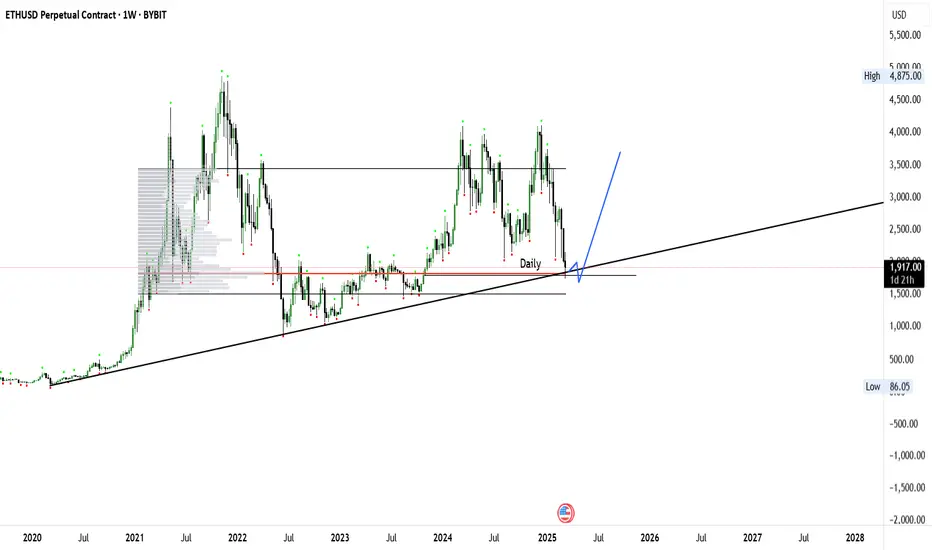
ETHUSD: Cyclical Pivot can slingshot it to at least $6,000Ethereum is almost oversold on its 1D technical outlook (RSI = 35.473, MACD = -206.770, ADX = 45.110) but this 1W candle is rebounding on the P1 trendline, which is the Pivot that started from the November 2021 ATH and already caused the a bounce on the August 5th 2024 contact. A similar P1 trendline was present during the 2018-2021 Cycle and its final contact was the March 2020 COVID crash, which kickstarted the insane rally. All similar rallies have hit at least the 1.5 Fibonacci extension and in some occasions the 2.0 Fib. Consequently we are confident enough to aim for at least the 1.5 Fib (TP = 6,000). Risk seekers can attempt a 9,000 test but more cautiously.
## If you like our free content follow our profile to get more daily ideas. ##
## Comments and likes are greatly appreciated. ##

$2000 is now a critical zone for Ethereum$2000 is now a critical zone for Ethereum.
The market has been bearish and still bearish.
These are the areas.
$1600 and ascending trendline are the resistance zone I am looking
$1600, $1400 and $886 are some key support zone to watch out for is this bleeding continues
NOTE:
The market has presented a great opportunity for investors who have the capacity to hold for long. If you are one, keep accummulating.

YO LISTEN MFsIf you shorting man fk
If you selling man fk
If you fomo man fk
If you panic man fk
This dang should be back at 2300$ because btc back to 85,000$
Stop doing all this bull shit
All this emotional like dang it will crash
For pssyss
If you psssys pls sell you bag and stop being like a MF
We ARE GOING ONE DAY BACK TO HIT ALL TIME HIGH

ETHEREUM SHORT TO $786! (UPDATE)ETH buyers can't find enough momentum!
That's the power of EW Theory strategy. We can see ETH remains within a 3 Sub-Wave (A,B,C) correction channel. From pure price action we can see that price remains bearish. Wave C target still remains around $786🩸

Ethereum logarithmic cyclesEthereum monthly chart logarithmic cycles shows us sideways movement is ending soon and direction will be found.
Highest probability -> Bull market until April 2026.
Lowest Probability -> Bear market until April 2026.

ETHEREUM SHORT TO $786! (UPDATE)ETH keeps on dumping😉
That's the power of Elliott Wave. We can see from our analysis that ETH remains within a 3 Sub-Wave (A,B,C) corrective channel. From naked price action we can still see that price remains bearish. Wave C target still remains around $786🩸

Ethereum - Watch This Massive Support!Ethereum ( CRYPTO:ETHUSD ) is weak but testing strong support:
Click chart above to see the detailed analysis👆🏻
The entire crypto market is currently not able to stop the bleeding and also Ethereum just dropped another -20% over the past three days. It might seem like a horrible scenario but overall Ethereum is still in a bullish market. Just watch the final confluence of support now.
Levels to watch: $2.000, $4.000
Keep your long term vision,
Philip (BasicTrading)

ETHUSD | 13.03.2025BUY 1900.00 | STOP 1740.00 | TAKE 2100.00 | After a smooth and prolonged decline, we expect a local increase in prices to the levels of 2100.00 - 2150.00.

PRICE SETTTING UP FOR THE NEXT EXPANSION (PREPARE TO BUY)We had a previous post about the price levels above 4878, we also found the time and price subdivisions that connect the significant tops and bottoms in the past and what to expect forward. We also marked the 965 and 1545 levels as the variance of 1.0 and 1.618 expansion from the primary bottom.
We made a top projection at 4106 level forward from the 1545 level which is the current top where the sharp correction commenced from. With the correction in progress we expect the range between 965 and 1545 to be a strong range to park up long term buy entries.
We also see the current correction making a bottom that will be the base for the new advance pass the 4869.47 high. This expected bottom is closely tied with BITCOIN reaching 52000 price level as the 50% expected correction.
Below 1545 every decline is a chance to add more buy entries, however, margin trades should use strict stoploss rules to manage risk. Trade safe.

ETH is in accumulation phaseETH is range-bound, once it breaks its accumulation phase, it will show you a bull run.
