ETHBEARUSD trade ideas

Ethereum H4 | Falling toward a pullback supportEthereum (ETH/USD) is falling towards a pullback support and could potentially bounce off this level to climb higher.
Buy entry is at 1,674.75 which is a pullback support that aligns close to the 38.2% Fibonacci retracement.
Stop loss is at 1,520.00 which is a level that lies underneath a multi-swing-low support and the 61.8% Fibonacci retracement.
Take profit is at 1,913.15 which is a swing-high resistance.
High Risk Investment Warning
Trading Forex/CFDs on margin carries a high level of risk and may not be suitable for all investors. Leverage can work against you.
Stratos Markets Limited (tradu.com):
CFDs are complex instruments and come with a high risk of losing money rapidly due to leverage. 63% of retail investor accounts lose money when trading CFDs with this provider. You should consider whether you understand how CFDs work and whether you can afford to take the high risk of losing your money.
Stratos Europe Ltd (tradu.com):
CFDs are complex instruments and come with a high risk of losing money rapidly due to leverage. 63% of retail investor accounts lose money when trading CFDs with this provider. You should consider whether you understand how CFDs work and whether you can afford to take the high risk of losing your money.
Stratos Global LLC (tradu.com):
Losses can exceed deposits.
Please be advised that the information presented on TradingView is provided to Tradu (‘Company’, ‘we’) by a third-party provider (‘TFA Global Pte Ltd’). Please be reminded that you are solely responsible for the trading decisions on your account. There is a very high degree of risk involved in trading. Any information and/or content is intended entirely for research, educational and informational purposes only and does not constitute investment or consultation advice or investment strategy. The information is not tailored to the investment needs of any specific person and therefore does not involve a consideration of any of the investment objectives, financial situation or needs of any viewer that may receive it. Kindly also note that past performance is not a reliable indicator of future results. Actual results may differ materially from those anticipated in forward-looking or past performance statements. We assume no liability as to the accuracy or completeness of any of the information and/or content provided herein and the Company cannot be held responsible for any omission, mistake nor for any loss or damage including without limitation to any loss of profit which may arise from reliance on any information supplied by TFA Global Pte Ltd.
The speaker(s) is neither an employee, agent nor representative of Tradu and is therefore acting independently. The opinions given are their own, constitute general market commentary, and do not constitute the opinion or advice of Tradu or any form of personal or investment advice. Tradu neither endorses nor guarantees offerings of third-party speakers, nor is Tradu responsible for the content, veracity or opinions of third-party speakers, presenters or participants.

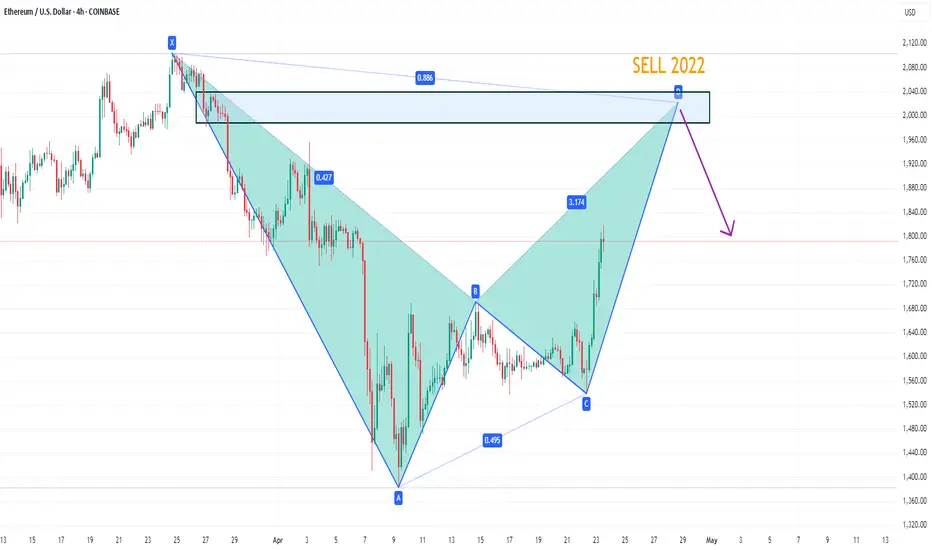
ETHUSD potential bearish bat patternOn the 4-hour chart, ETHUSD stabilized and rebounded. The current upper resistance is around 2022. Once it reaches that level, pay attention to the potential bearish bat pattern. At the same time, this position is in the previous supply area.
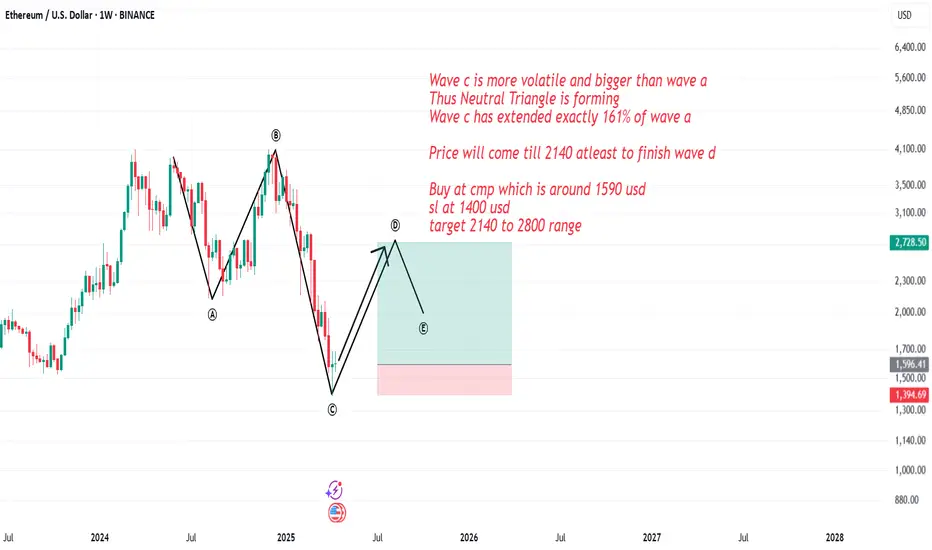
Buy Ethusd for 1:5 risk reward Etherium will be bullish for 2 to 3 months now till it reach 2140 usd range
Wave c is more volatile and bigger than wave a
Thus Neutral Triangle is forming
Wave c has extended exactly 161% of wave a
Price will come till 2140 atleast to finish wave d
Buy at cmp which is around 1590 usd
sl at 1400 usd
target 2140 to 2800 range
ETH/USD "Ethereum vs U.S Dollar" Crypto Heist Plan (Swing/Day)🌟Hi! Hola! Ola! Bonjour! Hallo! Marhaba!🌟
Dear Money Makers & Robbers, 🤑💰✈️
Based on 🔥Thief Trading style technical and fundamental analysis🔥, here is our master plan to heist the ETH/USD "Ethereum vs U.S Dollar" Crypto market. Please adhere to the strategy I've outlined in the chart, which emphasizes long entry and short entry. 🏆💸"Take profit and treat yourself, traders. You deserve it!"💪🏆🎉
Entry 📈 :
"The loot's within reach! Wait for the breakout, then grab your share - whether you're a Bullish thief or a Bearish bandit!"
🏁Buy entry above 1700
🏁Sell Entry below 1380
📌However, I recommended to place buy stop for bullish side and sell stop for bearish side.
Stop Loss 🛑: "🔊 Yo, listen up! 🗣️ If you're lookin' to get in on a buy (or) sell stop order, don't even think about settin' that stop loss till after the breakout 🚀. You feel me? Now, if you're smart, you'll place that stop loss where I told you to 📍, but if you're a rebel, you can put it wherever you like 🤪 - just don't say I didn't warn you ⚠️. You're playin' with fire 🔥, and it's your risk, not mine 👊."
🚩Thief SL placed at 1560 (swing Trade Basis) for Bullish Trade
🚩Thief SL placed at 1520 (swing Trade Basis) for Bearish Trade
Using the 1H period, the recent / swing low or high level.
SL is based on your risk of the trade, lot size and how many multiple orders you have to take.
Target 🎯:
🏴☠️Bullish Robbers : TP 1860 (or) Escape Before the Target
🏴☠️Bearish Robbers : TP 1200 (or) Escape Before the Target
⚒💰ETH/USD "Ethereum vs U.S Dollar" Crypto Market Heist Plan is currently experiencing a neutral to bullish trend,., driven by several key factors.... 👇👇👇
📰🗞️Get & Read the Fundamental, Macro, COT Report, On Chain Analysis, Sentimental Outlook, Intermarket Analysis, Future trend targets.. go ahead to check 👉👉👉🔗
📌Keep in mind that these factors can change rapidly, and it's essential to stay up-to-date with market developments and adjust your analysis accordingly.
⚠️Trading Alert : News Releases and Position Management 📰 🗞️ 🚫🚏
As a reminder, news releases can have a significant impact on market prices and volatility. To minimize potential losses and protect your running positions,
we recommend the following:
Avoid taking new trades during news releases
Use trailing stop-loss orders to protect your running positions and lock in profits
💖Supporting our robbery plan 💥Hit the Boost Button💥 will enable us to effortlessly make and steal money 💰💵. Boost the strength of our robbery team. Every day in this market make money with ease by using the Thief Trading Style.🏆💪🤝❤️🎉🚀
I'll see you soon with another heist plan, so stay tuned 🤑🐱👤🤗🤩

Ethereum (ETH/USD) at Key Resistance – Potential Bearish ReversaEthereum has recently shown a strong recovery from the $1500 level and is now trading near a significant resistance zone around $1830.
According to technical analysis, if the price breaks below the nearby support at $1766, the next potential downside targets are $1695, $1628, and $1567.
In the event of further selling pressure, ETH could decline toward $1509, which marks a strong historical support zone.
This analysis is intended for informational and educational purposes only. Please conduct your own research before making any investment or trading decisions.

Sign of a bullish trendAs we can see here, this could be a sign of a bullish trend. If the price rises to $1690, we will have broken through the resistance level, indicating a clear upward movement. We would initially set the take profit level at $1815. The news is also positive — Bitcoin has recently experienced a breakout as well.

ETH breaking out from daily down trend?The daily down trend seems like coming to an end with a little sprout out of the top trend line resistance. Target to look out for will be 1800 to clear.

ETHUSD Long term Buy opportunityBased on technical analysis it has change the character and continue create a continuation pattern. we can find long term buy opportunity in demand zone 800$-1000$.
This is not financial advice.

ETHPossible buy zone. We're waiting for a future event that will unbalance cryptocurrencies.
Wychoff and our own analysis are reflected in this chart.

ETHUSD Market Analysis – Short SetupI'm going short on ETHUSD based on current market structure and key resistance levels.
📉 Trade Details:
Entry Price: $1,649.43
Stop Loss: $1,656.60
Take Profit: $1,564.97
🧭 Reason for the Trade:
ETHUSD recently tapped a resistance zone near $1,650, which has acted as a supply area multiple times in the past. After a weak bullish push with low momentum, price started to stall showing signs of rejection with long upper wicks on the H4 candles.
This hints that sellers are stepping in and bulls are losing steam.
🔥 Why I’m Short:
Price rejected the $1,650 zone
Weak bullish candles near resistance
H4 shows bearish structure forming
Risk/reward ratio is solid
📍Risk Management:
I’m keeping things tight with my Stop Loss at $1,656.60 — just above the resistance zone. If price breaks above this, it means sellers are likely out of the game.
Take Profit is set at $1,564.97, right above a demand area and previous support. This gives the trade room to breathe while locking in profit before price bounces.

ETHUSDT Bullish Bias - Medium Term TargetsETHUSDT Trade levels defined
Strategy = Williams Alligator + MACD
should test its HH marked by horizontal line
Entry at CMP, Take profit and SL defined.

ETHUSD Will Grow! Buy!
Take a look at our analysis for ETHUSD.
Time Frame: 12h
Current Trend: Bullish
Sentiment: Oversold (based on 7-period RSI)
Forecast: Bullish
The market is on a crucial zone of demand 1,640.45.
The oversold market condition in a combination with key structure gives us a relatively strong bullish signal with goal 2,004.78 level.
P.S
Please, note that an oversold/overbought condition can last for a long time, and therefore being oversold/overbought doesn't mean a price rally will come soon, or at all.
Disclosure: I am part of Trade Nation's Influencer program and receive a monthly fee for using their TradingView charts in my analysis.
Like and subscribe and comment my ideas if you enjoy them!

$ETHUSD Buy After the recent drop in prices of major crypto currencies, BITSTAMP:ETHUSD seemed poised to rally and 1,756 to 2000 remains a crucial zone to see watch because price moving above would mean a solid recovery and possibly a new all time high

A-typical rising wedge giving way to 1160 fib targetWhat looks like a triangle here is an accurate representation of the hopium surrounding ETH... But with consumer spending looking fragile, we won't see the bottom any time soon.

ETH/USD Bearish Reversal Setup – Targeting $1,470 After ResistanPair: Ethereum / U.S. Dollar (ETH/USD)
Exchange: Coinbase
Timeframe: 15 minutes
Indicators:
EMA 30 (red line): ~1635.82
EMA 200 (blue line): ~1585.79
🟣 Key Levels & Zones
Resistance Zone (Purple Rectangle Top): Around $1,647 – previously tested and rejected.
Support Zone (Purple Rectangle Bottom): Around $1,470 – marked as the "EATARGET POINT".
Current Price: ~$1,645
📉 Bearish Breakdown Setup
Chart Pattern: There’s a potential double top or distribution zone forming near the resistance.
Projection: The price is expected to break below the smaller support zone and drop to the target zone around $1,470.67, representing an 11.13% drop.
Measured Move Tool: Indicates a bearish price target if the price breaks down from the current consolidation.
✅ Confluence
Price is currently hovering under resistance.
EMAs show short-term bullish momentum but could flatten if breakdown confirms.
Support near $1,635 is being tested – a break below could trigger the expected drop.
⚠️ Trading Implications
Short Setup: A trader might look to enter short around $1,647 if breakdown confirmation occurs.
Stop Loss: Just above the resistance zone (~$1,650+).
Take Profit: Near $1,470 zone.


ETHSimple chart :
- Don’t fight the trend, just stick to your strategy.
- follow the signs.
- Never go all in and always DCA.
Only this way we will learn to master our emotions.
Happy Tr4Ding !

ETHUSD Technical Outlook (READ CAPTION)Hello Traders Look At my Given Chart And Share Your Ideas About it
As of April 17, 2025, Ethereum (ETH) is trading at approximately $1,581.14, reflecting a slight decline of 0.82% from the previous close.
Price Levels:
Current Price: Approximately $1,573.69
Support Levels: $1,5.42, $1,539.00, and $1,530.21
Resistance Levels: $1,642.30, $1,645.00, and $1,650.00 .

ETH/USD... 1h Chart Pattren...MY buy position on ETH/USD at 1,670 with targets at 1,760 and 1,850 looks promising. Let's dive into some key factors to consider:
*Technical Indicators*
1. *RSI (Relative Strength Index)*: Check if ETH is oversold or overbought. An RSI below 30 might indicate a buying opportunity, while above 70 could suggest it's overbought.
2. *MACD (Moving Average Convergence Divergence)*: A bullish crossover (MACD line crossing above the signal line) could support your buy position.
3. *Support/Resistance Levels*: Identify key support levels around 1,670. If there's strong support, it could bounce back up. Resistance levels near 1,760 and 1,850 might pose challenges.
*Market Sentiment*
1. *News and Trends*: Keep an eye on crypto market news, regulatory announcements, and technological developments that could impact ETH's price.
2. *Broader Market Conditions*: The overall crypto market sentiment can influence ETH's price. A bullish trend in Bitcoin often lifts other cryptocurrencies.
*Risk Management*
1. *Stop-Loss Orders*: Set a stop-loss below a significant support level to limit potential losses. This could be around 1,600 or lower, depending on the current support levels.
2. *Position Sizing*: Ensure you're not risking more than you can afford to lose on this trade. Consider your overall portfolio and risk tolerance.
3. *Diversification*: Make sure your portfolio is diversified to mitigate risks associated with crypto volatility.
*Additional Considerations*
1. *Volume*: Check the trading volume. Higher volume can validate the strength of the price movement.
2. *Trend Lines*: Identify any trend lines that might influence the price. A break above a downward trend line could signal a reversal.
*Next Steps*
- *Analyze Charts*: Take a closer look at the ETH/USD charts on different time frames (1-hour, 4-hour, daily) to identify patterns and key levels.
- *Stay Updated*: Keep up with market news and technical analysis to adjust your strategy as needed.
- *Review Risk Management*: Regularly review your stop-loss and take-profit levels based on market conditions.
Would you like to explore specific technical indicators or discuss potential scenarios based on market news?

ETHUSD LONGETH/USD has broken its structure on the 4H timeframe and taken support exactly at a key Fibonacci level. From here, a potential long trade setup could be forming.
If we enter around these levels, there’s a good chance of making a decent profit.

NEoWave Analysis of Ethereum ChartThe Ethereum chart appears to have entered a long-term correction in the form of a flat pattern since May 2022, and its wave C is currently forming.

CRYPTO - Ethereum - Ascending triangle - Get longEthereum is forming an ascending triangle and is about to break up.
Ascending triangles are high probability patterns. They have set targets and are easy to figure out the stop loss.
The stochastic has just traded down and is ready to bounce.
RSI is above 50 so buyers are in control.
The current price is 1641.
Target 1 is 2000 which is 20% with no leverage.
You need a stop loss at 1550.
