ETH on weekly chartBINANCE:ETHUSDT
The price respects the trend and every time it approaches it there is a rebound .
The price at 4000 forms a strong resistance, and when the price last hit it, there was a drop.
We may see a rebound from this area, but it is required to exceed 4000 to achieve the targets at the top, and I think that these targets are the longest range for him in this cycle .
ETHBEARUSD trade ideas

Technical analyses - Ethereum (ETH) - Retrest upThe bearish trend is currently very strong for ETHEREUM - ETH/USD. As long as the price remains below the resistance at , you could try to take advantage of the bearish rally. The first bearish objective is located at . The bearish momentum would be revived by a break in this support. Sellers would then use the next support located at as an objective. Crossing it would then enable sellers to target . Be careful, given the powerful bearish rally underway, excesses could lead to a short-term rebound. If this is the case, remember that trading against the trend may be riskier. It would seem more appropriate to wait for a signal indicating reversal of the trend.

ETH/USD "Ethereumvs US Dollar" Crypto Market Heist Plan🌟Hi! Hola! Ola! Bonjour! Hallo!🌟
Dear Money Makers & Thieves, 🤑 💰🐱👤
Based on 🔥Thief Trading style technical and fundamental analysis🔥, here is our master plan to heist the ETH/USD "Ethereum vs US Dollar" Crypto market. Please adhere to the strategy I've outlined in the chart, which emphasizes long entry. Our aim is the high-risk Red Zone. Risky level, overbought market, consolidation, trend reversal, trap at the level where traders and bearish robbers are stronger. 🏆💸Be wealthy and safe trade.💪🏆🎉
Entry 📈 : "The heist is on! Wait for the breakout (2900.0) then make your move - Bullish profits await!"
however I advise placing Buy Stop Orders above the breakout MA or Place Buy limit orders within a 15 or 30 minute timeframe. Entry from the most recent or closest low or high level should be in retest.
Stop Loss 🛑:
Thief SL placed at the recent / nearest swing low level Using the 2H timeframe (2600.0) swing trade basis.
SL is based on your risk of the trade, lot size and how many multiple orders you have to take.
Target 🎯:
-Bullish Thieves TP 3500.0 (or) Escape Before the Target
Scalpers, take note 👀 : only scalp on the Long side. If you have a lot of money, you can go straight away; if not, you can join swing traders and carry out the robbery plan. Use trailing SL to safeguard your money 💰.
📰🗞️Fundamental, Macro, COT, Sentimental Outlook:
The ETH/USD "Ethereum vs US Dollar" Crypto market is currently experiencing a bullish trend,., driven by several key factors.
💥 Fundamental Analysis: Bullish
- Ethereum's fundamentals are strong, with a growing developer community and increasing adoption of decentralized applications (dApps).
- The upcoming Ethereum 2.0 upgrade is expected to improve scalability and security.
💥 Macro Economics: Neutral
- The global economic outlook is uncertain, but Ethereum's decentralized nature makes it less susceptible to traditional economic factors.
- Increasing institutional investment in cryptocurrencies is a positive macroeconomic factor for Ethereum.
💥 COT Report:
- Non-Commercial Traders (Speculators): 40% Long, 60% Short
- Commercial Traders: 50% Long, 50% Short
- Non-Reportable Traders: 30% Long, 70% Short
💥 Sentimental Market Analysis: Bullish
- The overall market sentiment for ETH/USD is bullish, with many traders expecting a price increase.
- This sentiment is driven by Ethereum's strong fundamentals, increasing adoption, and upcoming upgrades.
💥 Positioning:
- Institutional Traders: 45% Bullish, 30% Bearish, 25% Neutral
- Banks: 40% Bullish, 35% Bearish, 25% Neutral
- Hedge Funds: 50% Bullish, 25% Bearish, 25% Neutral
- Corporate Traders: 35% Bullish, 40% Bearish, 25% Neutral
- Retail Traders: 55% Bullish, 20% Bearish, 25% Neutral
💥 Price Prediction:
- Short-term (next 30 days): $2,500-$3,500
- Medium-term (next 3 months): $3,000-$4,500
- Long-term (next 6 months): $4,000-$6,000
💥 Overall Outlook: Bullish
- The overall outlook for ETH/USD is bullish, driven by Ethereum's strong fundamentals, increasing adoption, and upcoming upgrades.
⚠️Trading Alert : News Releases and Position Management 📰 🗞️ 🚫🚏
As a reminder, news releases can have a significant impact on market prices and volatility. To minimize potential losses and protect your running positions,
we recommend the following:
Avoid taking new trades during news releases
Use trailing stop-loss orders to protect your running positions and lock in profits
📌Please note that this is a general analysis and not personalized investment advice. It's essential to consider your own risk tolerance and market analysis before making any investment decisions.
📌Keep in mind that these factors can change rapidly, and it's essential to stay up-to-date with market developments and adjust your analysis accordingly.
💖Supporting our robbery plan will enable us to effortlessly make and steal money 💰💵 Tell your friends, Colleagues and family to follow, like, and share. Boost the strength of our robbery team. Every day in this market make money with ease by using the Thief Trading Style.🏆💪🤝❤️🎉🚀
I'll see you soon with another heist plan, so stay tuned 🤑🐱👤🤗🤩

#ETH weekly perspective#ETH will probably continue in this image. I will follow this chart and formation. I plan to evaluate its weekly development here.

ETHEREUM SHORT TO $786! (UPDATE)Remember my ETH short bias from 5 months ago? Despite it pushing up a little, price has remained within the trendlines & bearish channel, keeping its main trend in a 'downtrend'.
We are still within a 3 Sub-Wave (A,B,C) corrective channel, with the current bearish move down being Wave C. Wave C target still remains around $786🩸

Is Ethereum Ready to Rally? Critical Levels and Elliott Wave InsIf you find this information inspiring/helpful, please consider a boost and follow! Any questions or comments, please leave a comment!
Ethereum Analysis: Key Levels and Market Structure
Ethereum has been moving in tandem with Bitcoin, but there are some distinct levels and market structures developing that are worth paying attention to. While most of the focus has been on BTC, ETH has been presenting some solid trade setups as well. Here’s my breakdown of where we stand and what I’m watching next.
Holding the Low: 2563 as a Double Zig-Zag
Ethereum has been working through a potential 2xZZ (double zig-zag) pattern, and 2563 stands as a key level to maintain that structure. If this low holds, the bullish case remains intact. However, we aren’t currently sitting in a Golden Zone (GZ) or a major discount level based on the recent dump, which adds some caution to aggressive entries.
Bullish Steps: 2665 & 2800 as Critical Resistance
For any bullish momentum to materialize, the first step is 2665—this level needs to break for buyers to start taking control. From there, 2800 is the larger resistance level that Ethereum must break and hold to show real strength. A rejection at this zone could lead to another corrective leg downward.
Confirmation of the Double ZZ: 2900 Break
The completion of the double zig-zag pattern will be officially confirmed with a break of the 2900 pivot. This is the critical point where bullish structure would be fully validated, signaling further upside potential. Until that happens, Ethereum remains in a make-or-break zone.
Until then, I’ll be watching how price action (PA) prints before making any major decisions. What do you think—will ETH break through or are we looking at more downside? Drop your thoughts below!
Trade safe, trade smart, trade clarity.

Ethereum Bullish Flag: A High-Potential Setup! Hi, traders. I’ve just taken this trade on Ethereum as I’m spotting a clear Bullish Flag pattern on the 1-hour timeframe. After a strong drop, the price started consolidating within this channel, respecting the trendlines.
My entry is at $2,620, anticipating a breakout to the upside. My initial target is around $2,932, which aligns with a key resistance level, and my stop loss is set at $2,598, just below the support zone, where the pattern would be invalidated.
The RSI is also supporting this setup, sitting around 40, indicating there’s still room for an upward move if the breakout happens.
Will this scenario play out? Let’s see! If you have any comments or want to share your analysis, feel free to drop them below. Good luck with your trades!
Disclaimer:
This is not financial advice. Trading involves risk, and you should only trade with money you can afford to lose. Always do your own analysis before entering any trades.

$ETH seems like it's forming a bullish flagCRYPTOCAP:ETH seems like it's forming a bullish flag. once we break out we will fly

ETHUSD Analysis: Potential Breakout OpportunityThe current liquidity zone at $2100 presents a crucial area of interest. If ETHUSD breaks through this level, it may trigger a new bullish trend. This could be a significant inflection point, potentially leading to a sustained upward movement in the market.
Key Considerations:
The liquidity zone at $2100 acts as a major price barrier, with heavy buying activity likely to occur if it's breached.
A successful breakout above $2100 could lead to a sustained upward movement in the market, potentially driven by increased investor confidence and momentum.
This could be an attractive entry point for long positions, with a potential target of $2200-$2300 in the short-term.
Risks and Cautions:
A failure to break through the liquidity zone at $2100 could lead to a reversal in market sentiment, potentially resulting in a decline to $2000-$1900.
It's essential to monitor market conditions and adjust trading strategies accordingly to minimize potential losses.
Please note that this analysis is for informational purposes only and should not be considered as investment advice.

ETHUSD Is Going Up! Long!
Here is our detailed technical review for ETHUSD.
Time Frame: 1D
Current Trend: Bullish
Sentiment: Oversold (based on 7-period RSI)
Forecast: Bullish
The price is testing a key support 2,621.94.
Current market trend & oversold RSI makes me think that buyers will push the price. I will anticipate a bullish movement at least to 3,230.06 level.
P.S
The term oversold refers to a condition where an asset has traded lower in price and has the potential for a price bounce.
Overbought refers to market scenarios where the instrument is traded considerably higher than its fair value. Overvaluation is caused by market sentiments when there is positive news.
Like and subscribe and comment my ideas if you enjoy them!

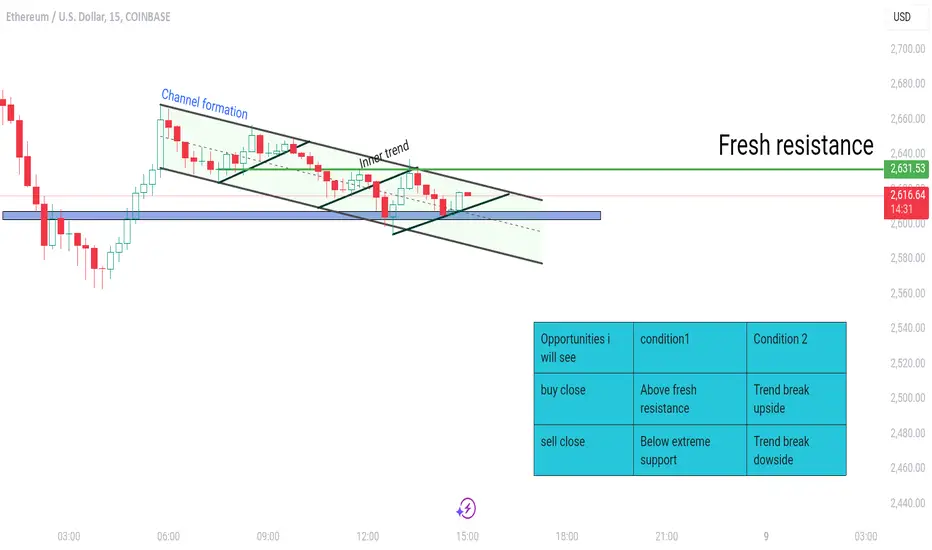
Neutral Here I am just showing how one can create own setup before making entry and exit
Just wait for setup to come on chart then entry with proper sl.
Etherieum - ETHUSD - Wait for a reversal. Be patient before buy!Dear Traders,
after the big sell off there in quite uncertainty regarding etherium, I would recommend to wait for a reversal signal or the price to go back to 2150 dollars berfore buying it. Now is forming a downtrend and there is no clear signal for a reversal.
Best.

POThe hexagram of Bo (Splitting) is symbolized by a mountain attached to the earth. The superior man, in accordance with this, should strengthen the foundation below to stabilize his residence.

ETH RangingSpotted this range zone ETH. A downward movement towards the nearest support is more likely to be the outcome here.

ETH ranging in 2000-4000 fieldETH is quite stable now.
It move up and down in range 2000-4000
when ETH under 2000, it will confirm a down trend,
similar with ETH reach ATH will confirm an up tren

I'm buying ETHUSDShakeout after sharkouts. I'm tired men...
But I want you to know it shouldnt be the same with last cycle, if it is... everybody will make a killing. The market has to adapt, history mirrors itself.
I'm buying at 2620
I plan to hold for long, to above the 6k
Risk responsibly

ETHUSD BUY ANALYSIS SMART MONEY CONCEPT Here on Ethusd price has form a demand around level of 2635.24 which is likely to continue going up so trader should go for short with expect profit target of 3013.07 and 3379.90 .Use money management

ETHUSD: Replicating Bitcoin's past Cycle to $14,000?Ethereum is almost oversold on 1D and straight bearish on its 1W technical outlook (RSI = 41.942, MACD = 3.920, ADX = 30.130) struggling to find bullish momentum and get detached from the consolidation it's been inside since March 2024. The whole Cycle however is technically much like Bitcoin's 2018-2021 Cycle. As the 1W MA200-1M MA50 zone supported Bitcoin on the Cycle bottom and later during the COVID crash, it is doing so on Ethereum for the past 2 years and most recently this week. If it holds, we may see a massive rally starting to the 1.618 Fibonacci extension (TP = 14,000).
## If you like our free content follow our profile to get more daily ideas. ##
## Comments and likes are greatly appreciated. ##

eth loking bearish Eth is in bearish phase.
As per Dow analysis it is making LH and ll
Volume is low

Preparing for powerful purchases at the turn of the quarterTo date, the market has come to a new opportunity for purchases and another market review. For the bear market, the pullback on the last monthly candle worked well, vib cream og troy performed well with growth impulses up to 30%+. However, as I emphasized, we still have the potential to go to 75k in bitcoin and below, and therefore we continue to catch only pullbacks on large charts against the bear market. I still recommend carefully weighing the top-up for large-cap coins, as such assets may continue to fall until the fall.
In the coming week, we are approaching the key bifurcation point – the middle of the quarter. There is still time before this day for the bears to attack, however, the opening of the month on ether above 3250 is likely to compensate for the attempt of a new loy test in the new week. Due to this picture, there is a fairly high probability of a pullback and an attempt to change the trend today. If the successful extinguishing of sales continues, we can expect an exit to 3100 on ether by the end of the week and in the case of opening a new weekly candle above 3000-3100, continued purchases with the aim of turning the monthly candle into a bullish one. In a more negative scenario, customer activity will remain rather weak with an increase in purchases as we approach the middle of the quarter. In this case, at the beginning of the week, there is a possibility of new sales attempts on the 2600 retest with an increase in purchases from the middle of the week.
Depending on the opening of the second half of the quarter above / below 3250, it will be possible to make a forecast about the further movement of the market.
To date, ether has tested the main medium-term support of 2500, for a fall below which there are no arguments yet when bitcoin is held above 90k, the euro above 1.025 and wti oil above 70. If one of the assets goes below one, there will be a risk of the alt market sinking to an additional 30-40% from current levels. At the moment, the probability of holding these assets above the levels with a gradual reversal of the altcoin market and attempts to turn the quarterly candle into a bullish one for individual coins prevails. That is, in the second half of the quarter, there is a probability of a large bull run with coin impulses up to 100%+.
To date, coins such as vib og alpaca pda vidt have reached the medium-term bottom, which I primarily consider for storing funds in the medium term and additional scalping. In case of market disruptions, drawdowns of no more than 20-25% are likely when tested with ether 2500-2600. The growth potential for these coins is to exceed the opening level of this month with an increase of up to 50% in the short term and a reversal of annual candles in the medium term with an increase of up to 100%+. We also reached powerful supports for uft wing combo slf quick pivx ast, which can slide to 30-35% lower in the event of ether disruptions, but they also look good in the mid-range with a growth potential of up to 70%+ in the event of a bullish reversal of the annual candle in the future.
Coins with the monitoring tag are still the most oversold. Among them, vite stands out, which gave good breakouts at every opportunity. The growth potential remains up to 0.021-25, which can give up to 300% profit. Cream troy amb hard remains in an extremely oversold position with a growth potential of up to 100%+. Troy stands out strongly, which, unlike cream, did not retest the drop level by 0.0031-35, this rebound can bring up to 150%+.
Let me remind you that coins with the monitoring tag are subject to the threat of delisting, which most often occur in the first half of the week, and therefore it is worth keeping short stops at the current price at the beginning of the week or taking assets into operation in the second half of the week.

ETH - Looking more bullish, 3 Take Profits soonLooking more bullish on micro time frames.
Price is trying to more back up to equalize with 200ma near $3200.
RSI and MACD ticking upwards.
More ETH ETF's approvals this year.
Most likely end of summer to fall 2025.

ETH Final bear Target 850-900$ETH Final Target 850-900$
Disclaimer
The information and publications are not meant to be, and do not constitute, financial, investment, trading, or other types of advice or recommendations supplied or endorsed by TradingView.

Bearish Heaven Looking at market structure and the various patterns given,we are currently in a M formation that needs to complete its second leg.
