ETHUSD | 07.04.2025BUY 1490.00 | STOP 1300.00 | TAKE 1780.00 | Local upward correction in the main descending trend channel. 1780.00 is the key level consolidation above which will allow to develop a longer price rise to the level of 2100.00.
ETHBEARUSD trade ideas

Ethereum is Under PressureFenzoFx—Ethereum has lost 4.5% of its value today, erasing gains from the previous trading day. The immediate resistance level is $1,755, in conjunction with the 50-period SMA. The downtrend will likely resume if this level holds, targeting the previous lower lows at $1,370.
Please note that the bearish outlook should be invalidated if ETH/USD exceeds $1,755. If this scenario unfolds, the price may target $1,950.
>>> Trade ETH/USD swap free at FenzoFx Decentralized Broker.

Crypto Update - First entry successful, looking for moreWhile our first-entry zone held beautifully across the crypto board, I would love for a deeper push into demand to get filled on better and larger orders. I can see this happening in Crypto as well as the broader markets.
Yesterday was a nice push but I don't believe we're fully out of the woods for a long-term bull run.
Stay patient and wait for your entries to make sure you don't get stuck with a losing position and no funds in the reserve.
Happy Trading :)

Ethereum Struggles Below $1,700 – Is a Reversal on the Horizon?📊 ETH/USD Daily Technical Outlook – April 9, 2025
Ethereum is currently trading around $1,649, facing resistance near the $1,700 level. After a decline from the $1,800 region earlier this month, ETH/USD has been attempting to find support and establish a base. The market is at a critical juncture, with price action suggesting a potential reversal or further downside movement.
CoinCodex
📈 Current Market Structure:
ETH/USD has been in a downtrend since reaching highs near $1,800 in early April. The pair has formed a series of lower highs and lower lows, indicating bearish momentum. Currently, the price is consolidating just below the $1,700 resistance, suggesting indecision among market participants.
🔹 Key Resistance Levels:
$1,700 – $1,720: Immediate resistance zone. A break above this area could signal a potential reversal and open the door for further gains.
$1,800: Previous support turned resistance. A move above this level would indicate a shift in market sentiment.
🔸 Key Support Levels:
$1,600: Psychological support level. A break below this could lead to increased selling pressure.
$1,500: Major support zone. Holding above this level is crucial for bulls to prevent further declines.
📐 Price Action Patterns:
Ethereum's recent price action suggests the formation of a descending triangle, a bearish continuation pattern. The horizontal support around $1,600 combined with descending highs indicates that sellers are gaining control. A decisive break below the $1,600 support could lead to a measured move targeting the $1,500 area.
🧭 Potential Scenarios:
✅ Bullish Scenario:
If ETH/USD breaks above the $1,700 resistance with strong volume, it could signal a reversal, targeting the $1,800 level. This move would require a shift in market sentiment and increased buying interest.
❌ Bearish Scenario:
A break below the $1,600 support could lead to further declines, with the next target around $1,500. This scenario would confirm the descending triangle pattern and suggest continued bearish momentum.
📌 Conclusion:
Ethereum is at a pivotal point, trading just below key resistance at $1,700. The formation of a descending triangle suggests a bearish bias, but a break above resistance could invalidate this pattern. Traders should monitor these key levels closely and watch for a decisive move to determine the next directional bias.
💬 Do you think Ethereum will break above $1,700, or is further downside ahead? Share your thoughts below 👇

Bullish bounce off pullback support?The Ethereum (ETH/USD) is falling towards the pivot and could bounce to the pullback resistance.
Pivot: 1,589.64
1st Support: 1,482.06
1st Resistance: 1,757.78
Risk Warning:
Trading Forex and CFDs carries a high level of risk to your capital and you should only trade with money you can afford to lose. Trading Forex and CFDs may not be suitable for all investors, so please ensure that you fully understand the risks involved and seek independent advice if necessary.
Disclaimer:
The above opinions given constitute general market commentary, and do not constitute the opinion or advice of IC Markets or any form of personal or investment advice.
Any opinions, news, research, analyses, prices, other information, or links to third-party sites contained on this website are provided on an "as-is" basis, are intended only to be informative, is not an advice nor a recommendation, nor research, or a record of our trading prices, or an offer of, or solicitation for a transaction in any financial instrument and thus should not be treated as such. The information provided does not involve any specific investment objectives, financial situation and needs of any specific person who may receive it. Please be aware, that past performance is not a reliable indicator of future performance and/or results. Past Performance or Forward-looking scenarios based upon the reasonable beliefs of the third-party provider are not a guarantee of future performance. Actual results may differ materially from those anticipated in forward-looking or past performance statements. IC Markets makes no representation or warranty and assumes no liability as to the accuracy or completeness of the information provided, nor any loss arising from any investment based on a recommendation, forecast or any information supplied by any third-party.

ETH USD🧠 Ethereum’s Cycle Is No Mystery
📉 Dump → 🔁 Consolidation → 🚀 Pump → Repeat?
📊 Cycle Breakdown:
📌 Pump → Dump → Consolidation (CON's)
✅ Pattern repeated since 2018
✅ Consolidation zones are launching pads
✅ RSI mirrors this exact behavior every time
🔎 Now sitting inside a Fair Value Gap (F.V.G) and RSI bonus back area
⚡️Current Signals:
🔹 RSI is bottoming in the same bonus zone as before major moves
🔹 ETH price sitting on vertical support + FVG zone
🔹 Last time this setup formed? ➡️ 🚀 ETH went from ~$90 → $4,000+
🏁 What to Watch Next:
‣ Breakout from current RSI range
‣ Retest of $1,400–$1,500 support
‣ Next potential targets: $3,000 → $4,100
💡 History doesn’t repeat—but it rhymes 👀

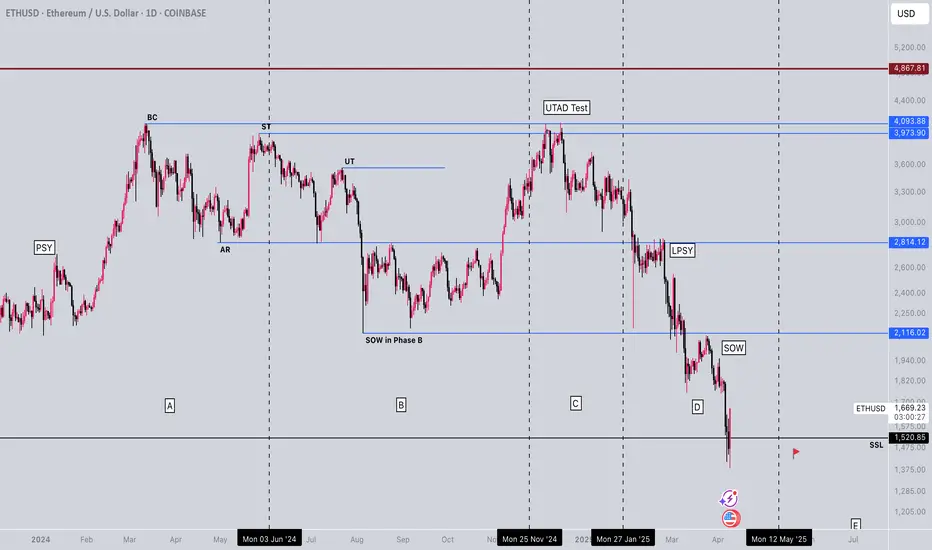
ETH just completed its Wyckoff Distribution EventContext:
PSY—preliminary supply, where large interests begin to unload shares in quantity after a pronounced up-move. Volume expands and price spread widens, signaling that a change in trend may be approaching.
BC—buying climax, during which there are often marked increases in volume and price spread. The force of buying reaches a climax, with heavy or urgent buying by the public being filled by professional interests at prices near a top. A BC often coincides with a great earnings report or other good news, since the large operators require huge demand from the public to sell their shares without depressing the stock price.
AR—automatic reaction. With intense buying substantially diminished after the BC and heavy supply continuing, an AR takes place. The low of this selloff helps define the lower boundary of the distribution TR.
ST—secondary test, in which price revisits the area of the BC to test the demand/supply balance at these price levels. For a top to be confirmed, supply must outweigh demand; volume and spread should thus decrease as price approaches the resistance area of the BC. An ST may take the form of an upthrust (UT), in which price moves above the resistance represented by the BC and possibly other STs before quickly reversing to close below resistance. After a UT, price often tests the lower boundary of the TR.
SOW—sign of weakness, observable as a down-move to (or slightly past) the lower boundary of the TR, usually occurring on increased spread and volume. The AR and the initial SOW(s) indicate a change of character in the price action of the stock: supply is now dominant.
LPSY—last point of supply. After testing support on a SOW, a feeble rally on narrow spread shows that the market is having considerable difficulty advancing. This inability to rally may be due to weak demand, substantial supply or both. LPSYs represent exhaustion of demand and the last waves of large operators’ distribution before markdown begins in earnest.
UTAD—upthrust after distribution. A UTAD is the distributional counterpart to the spring and terminal shakeout in the accumulation TR. It occurs in the latter stages of the TR and provides a definitive test of new demand after a breakout above TR resistance. Analogous to springs and shakeouts, a UTAD is not a required structural element: the TR in Distribution Schematic #1 contains a UTAD, while the TR in Distribution Schematic #2 does not.
ETHUSDT UpdateETHUSDT broke the High on 1hr time frame, we can take enter from this buy zone and ride with targets on $3500.
Note: It's Swing- Long Term Trade


Ethereum has been highly volatile and is rapidly losing value.Ethereum has been highly volatile and is rapidly losing value. This is not only due to actions taken by Trump but also because of the looming recession that many analysts are predicting. But will this recession truly materialize, and if so, will it also impact the crypto market?
The recession is most likely to continue affecting traditional markets, especially financial firms. Tech companies have already suffered significantly and may face an additional decline of up to 20%. Ethereum will also be affected, as it is not classified as a digital currency but rather as an asset—primarily due to U.S. regulatory policies.
This means Ethereum is tied to recessionary trends. Since the crypto market hasn't yet entered its own growth cycle, which is still expected to come, we may still see a short-term drop in price down to around $831. After that, our mid-term price targets are up to $2,460.

Ethereum - Short Term Sell Trade Update!!!Hi Traders, on April 8th I shared this idea "Ethereum - Expecting Retraces Before Prior Continuation Lower"
I expected retraces and further continuation lower until the two Fibonacci resistance zones hold. You can read the full post using the link above.
The bearish move delivered, as expected!!!
If you enjoy this idea, don’t forget to LIKE 👍, FOLLOW ✅, SHARE 🙌, and COMMENT ✍! Drop your thoughts and charts below to keep the discussion going. Your support helps keep this content free and reach more people! 🚀
-------------------------------------------------------------------------------------------------------------------
Disclosure: I am part of Trade Nation's Influencer program and receive a monthly fee for using their TradingView charts in my analysis.

ETH broke down 1570$ and ready to touch 800$ :-(I open a big long position and I'm sure that ETH will fall down to 800 to liquid my positions.

After big dip later I will grow up with ETHI will go high little bit but be careful after yesterday hit SL

Daily descending wedge on ETH suggests bullish future aheadThis is a bullish pattern, so there's a hope and expectation the price will rise if and when we break up out of it. Price falling down out of this pattern would be exceptionally bearish.

1W ETHUSD: Rising wedge, tread carefully at end of yearAs above.
Rising wedge present on 1W has a ~60% chance of a bearish break once it violates the bottom trend line. Potential targets if this bearish pattern occurs is ~$1300, $1000, and back to $900 low.
Will follow.
Good luck traders.


Ether is a buy between 1300-1500!!This price point is significant as it aligns with Ethereum's previous highs from 2018, suggesting a potential support level. The occurrence of a monthly divergence indicates that selling pressure may be diminishing, potentially paving the way for a bullish reversal.
Looking ahead, industry projections are optimistic about Ethereum's future performance. Analysts anticipate that Ethereum could reach new all-time highs, with some forecasts suggesting prices exceeding $5,000 in the coming year.
From a fundamental perspective, Ethereum's transition to a proof-of-stake consensus mechanism has significantly reduced its energy consumption and introduced deflationary pressures on its supply. This shift, along with ongoing network upgrades, enhances Ethereum's scalability and security, reinforcing its position as a leading platform for decentralized applications and finance.
Furthermore, the approval of Ethereum-focused exchange-traded funds (ETFs) has opened new avenues for institutional investment, contributing to increased demand and potential price appreciation.
In summary, the current price dip presents a favorable buying opportunity, supported by technical indicators and robust economic fundamentals. With continued network enhancements and growing institutional interest, Ethereum's outlook remains positive.
Please note alot of these things can take time to reflect in price. So although some of these news are a few years long it does not make it any less impactful! Buy when there is blood on the street.

ETHEREUM BEARISH BREAKOUT|SHORT|
✅ETHEREUM keeps falling
Down and the price made a
Bearish breakout of the
Key horizontal level of 1600$
And the breakout is confirmed
So we are bearish biased
And we will be expecting a
Further bearish move down
SHORT🔥
✅Like and subscribe to never miss a new idea!✅
Disclosure: I am part of Trade Nation's Influencer program and receive a monthly fee for using their TradingView charts in my analysis.

ETH - Last chance for Ethereum at this area or...?This blue box last chance or i'll probably quit eth :(
0.786 fib + weekly buy zone + insane buy walls on order book
Pectra Upgrade is in a month...
Good luck

Ethereum may targetting 400$Why would we think otherwise when we look at this graph?
Perhaps only large companies like Blackrock can change the fate of Ethereum.
* The purpose of my graphic drawings is purely educational.
* What i write here is not an investment advice. Please do your own research before investing in any asset.
* Never take my personal opinions as investment advice, you may lose your money.

$ETH why is it cancelled? Things you porobably need to know.There are several reasons why CRYPTOCAP:ETH is being sidelined—some obvious, others you may not have considered. Here's my analysis.
Let’s be clear: something is wrong in this cycle, and the ETF providers are at the heart of the problem.
The famous line, *"there is no second best"*, rings true—because they ensure no one overshadows their main asset: $BTC.
They’ve already tried to destroy crypto outright—really hard—and failed. The elites are 100% devoted to the USD; it’s their lifeblood. Crypto, especially stablecoins like USDT or USDC, became a competitor, and they did everything possible to wreck the market. When direct attacks didn’t work, they turned to a new strategy: controlling it from the inside.
They embraced crypto, and now they’re making billions off crypto enthusiasts who mistakenly believe these players are here for their benefit. This won’t last forever, but that’s a topic for another day.
Now, let’s address why Ethereum is underperforming—and why it’s likely to continue.
### 1. **Corruption in the Proof-of-Stake System**
All PoS systems rely on staking: the more you stake, the more rewards you earn. Typical staking rewards in crypto average about 10% APR, significantly higher than traditional bank interest rates.
But here’s the catch: these rewards are minted, creating inflation because more coins are constantly being dumped into the market. This results in a class of "retired" investors who stake massive amounts, live off their staking rewards, and sell them without ever touching their capital. This creates constant sell pressure on PoS coins.
The Ethereum Foundation controls how much staking is rewarded. Because it’s run by the same people staking, their vested interest is to keep APRs high, even though this fuels inflation. Ironically, Ethereum’s inflation rivals the USD—a troubling reality for a crypto meant to outperform traditional finance.
### 2. **Ethereum’s Ripple Effect on the Market**
Most altcoins rely on Solidity smart contracts, meaning Ethereum’s performance directly impacts the broader altcoin market. When Ethereum underperforms, it drags down Layer 2 solutions, DeFi projects, and the entire altcoin ecosystem.
Knowing this, why did ETF providers rush to approve ETH ETFs? Simple: *“There is no second best.”*
By taming Ethereum, ETF providers manipulate the market to keep Bitcoin afloat, cancel bear markets, and kill any chance of an altseason. On-chain data shows their strategy: when they buy Bitcoin, they sell Ethereum. This frustrates altcoin holders, pushing them to dump their bags and pivot toward—guess what—Bitcoin.
### 3. **The ETF Trojan Horse**
Ethereum, with its corrupt foundation, is the perfect tool for entities like BlackRock to maintain Bitcoin dominance. By doing so, they effectively prevent bear markets and suppress altseasons.
But this strategy has an endpoint. ETFs will milk the crypto space for as much profit as possible. Once they’ve extracted enough, they’ll dump their holdings, funneling all that capital back into USD. This has been their plan all along.
When that happens, the crypto market—including Bitcoin—will crash. Ethereum’s role has essentially been to funnel cash into Bitcoin, making it easier for institutions to accumulate wealth before transferring it all back into USD.
---
In short, Ethereum is being used as a tool in the ETF providers' larger scheme. It’s not about creating a thriving ecosystem but about maintaining dominance, controlling markets, and ultimately cashing out into the USD.

ETHUSD downtrend continuation below 1,724The ETH/USD pair is exhibiting a bearish sentiment, reinforced by the ongoing downtrend. The key trading level to watch is at 1,724, which represents the current intraday swing high and the falling resistance trendline level.
In the short term, an oversold rally from current levels, followed by a bearish rejection at the 1,724 resistance, could lead to a downside move targeting support at 1,409, with further potential declines to 1,350 and 1,265 over a longer timeframe.
On the other hand, a confirmed breakout above the 1,724 resistance level and a daily close above that mark would invalidate the bearish outlook. This scenario could pave the way for a continuation of the rally, aiming to retest the 1,840 resistance, with a potential extension to 1,926 levels.
Conclusion:
Currently, the ETH/USD sentiment remains bearish, with the 1,724 level acting as a pivotal resistance. Traders should watch for either a bearish rejection at this level or a breakout and daily close above it to determine the next directional move. Caution is advised until the price action confirms a clear break or rejection.
This communication is for informational purposes only and should not be viewed as any form of recommendation as to a particular course of action or as investment advice. It is not intended as an offer or solicitation for the purchase or sale of any financial instrument or as an official confirmation of any transaction. Opinions, estimates and assumptions expressed herein are made as of the date of this communication and are subject to change without notice. This communication has been prepared based upon information, including market prices, data and other information, believed to be reliable; however, Trade Nation does not warrant its completeness or accuracy. All market prices and market data contained in or attached to this communication are indicative and subject to change without notice.

Ethereum - Expecting Retraces Before Prior Continuation LowerH1 - Bearish trend pattern in the form of lower highs, lower lows structure.
Strong bearish momentum
Lower lows on the moving averages of the MACD indicator.
Expecting retraces and further continuation lower until the two Fibonacci resistance zones hold.
If you enjoy this idea, don’t forget to LIKE 👍, FOLLOW ✅, SHARE 🙌, and COMMENT ✍! Drop your thoughts and charts below to keep the discussion going. Your support helps keep this content free and reach more people! 🚀
--------------------------------------------------------------------------------------------------------------------
Disclosure: I am part of Trade Nation's Influencer program and receive a monthly fee for using their TradingView charts in my analysis.
