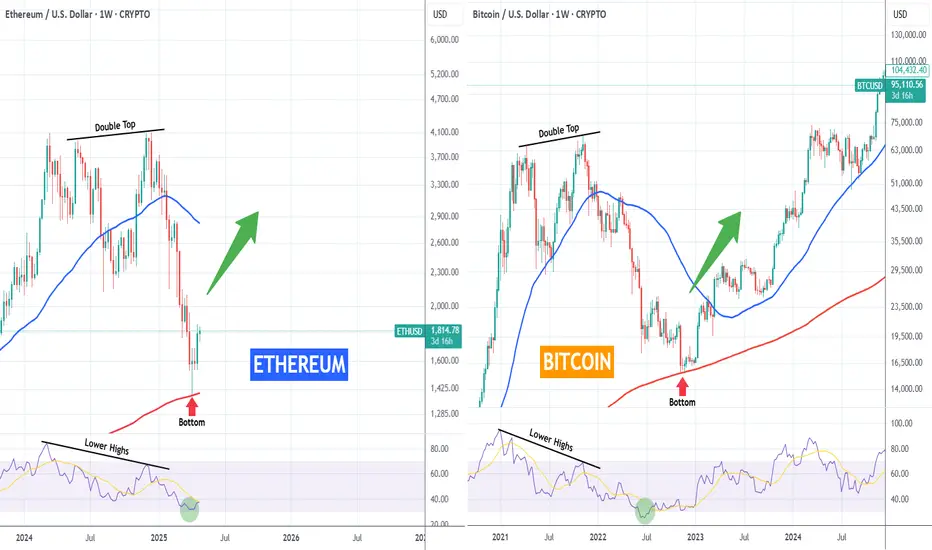
ETHEREUM vs BITCOIN fractals you'd never thought to look at!Odd comparison but you'd be lying if you say those fractals between Ethereum (ETHUSD) 2024 - 2025 and Bitcoin (BTCUSD) 2021 - 2022 don't look similar. But if you do believe it, can this mean ETH is about to see a rally to a new All Time High?
Anyway as the title says, this is fun fractal for compar
Key stats
ETHThe chart looks like Bitcoin’s movement in 2020. I think it will rise to $4,000 by autumn. If it breaks that level, we could see $8,000–$10,000 by 2026, and and possibly even reach $14,000.
At the moment, it’s hard to believe this forecast, but the market can move any way, and there’s always a chan

This is just to show off my trendline skills, nothing more Hmmm. This is ethereum obviously. I don’t know much about TA but I think the little I learned put me a step ahead and I’m thankful for OpenAI. I get to work with a personal trainer or every information and logic I need.. just a chat away. It’s incredible.
So I think Eth is consolidating, just lear

Nobody appreciate it !!!Currently, ETH is forming an ascending triangle, indicating a potential price increase. It is anticipated that the price could rise, aligning with the projected price movement (AB=CD).
However, it is crucial to wait for the triangle to break before taking any action.
Give me some energy !!
✨We sp

Ethereum's $2k Crossroads: Squeeze Up or Crash Down?Ethereum at a Crossroads: Eyeing $2,000 Amidst Short Squeeze Hopes, Crash Warnings, and Existential Questions
Ethereum (ETH), the bedrock of decentralized finance (DeFi) and the engine behind countless non-fungible tokens (NFTs), finds itself ensnared in a complex web of conflicting market signals

[LONG] ETHUSDT - Binance | Going Now?Welcome,
- Status: 📈 Long
- ETH good
- TP: I have 5 TP, the last 20% depend on you
- SL: When TP 1 is met, move SL to the entry position for FREE RISK. After the next TP is met, use Trailing Stop.
Keep wait..
Lets see..

ETH/USD Breakout Trading Setup – Long Entry with 16% Target PoteEntry Point: $1,593.08
Target Point: $1,807.83
Stop Loss: $1,472.68
Risk/Reward Ratio: Roughly 2.1:1
Indicators Used:
EMA 30 (Red Line) at $1,593.08 (near entry point)
EMA 200 (Blue Line) at $1,605.09
Analysis:
1. Consolidation Phase:
ETH is in a sideways range after a prior downtrend, co

ETHUSD is forming a H&S pattern on the H1ETHUSD is forming a H&S pattern on the H1 chart. The right shoulder has yet to finish forming so our TP1 will be on the neckline. TP2 will be if it breaks out from the trendline and TP3 will be the completion of the H&S pattern. Pattern will be invalidated if it breaks past the shoulder line.
Pleas

ETHUSD Ready for PUMP or what ?Currently, ETH is forming an ascending triangle, indicating a potential price increase. It is anticipated that the price could rise, aligning with the projected price movement (AB=CD).
Give me some energy !!
✨We spend hours finding potential opportunities and writing useful ideas, we would be happ

[WAITING] ETHUSDT - Binance | What now?Welcome,
- Status: Neutral
- ETH Stil Consolidation, waiting signal for validation entry
Keep wait..
Lets see..

See all ideas
Curated watchlists where ETHBULLUSD is featured.

Gen 2: Crypto is here to stay - and it's brought some friends…
19 No. of Symbols

Proof of Work: Embracing the crunch
27 No. of Symbols

Smart contracts: Make the smart decision
36 No. of Symbols

Staking Coins: Pick up a stake
18 No. of Symbols

Top altcoins: Choose your alternatives carefully
28 No. of Symbols
See all sparks