Ethereum’s Last Chance: Let Jesus Take The WheelEthereum’s price action over the course of this crypto bull run, and especially since the beginning of this year, 2025, has been nothing short of horrendous. It’s failed to hold almost every single important level that it needed to, to be able to keep pushing higher. This has caused almost all crypto investors and altcoin traders to pull their investments out, and drive the price even lower. At its current point, altcoin traders have lost all but 100% of the confidence they once had in it, and to retail investors, this is basically toxic waste once they see the losses that have been taken, it’s driving them away en masse.
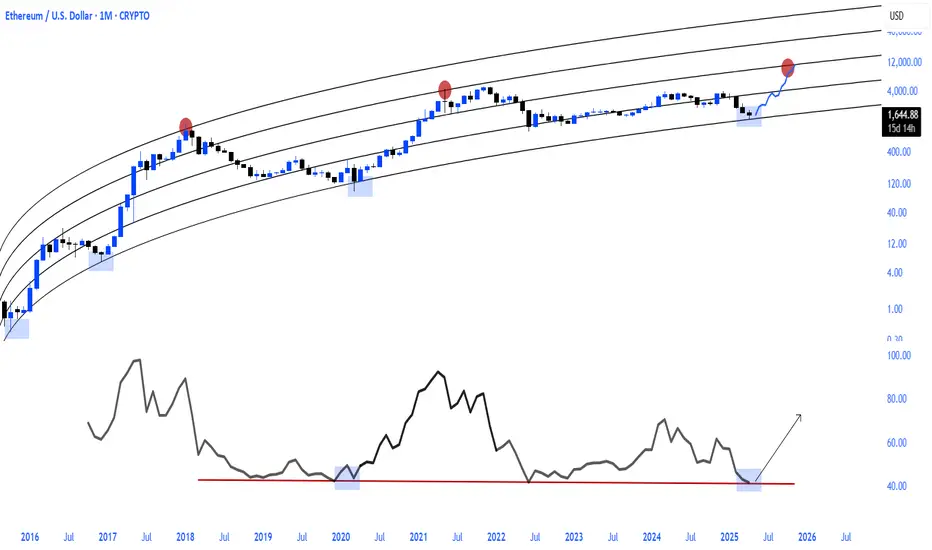
With that being said, this is ETH’s final stand, it’s time to either show out, or go home with nothing to show for itself. It’s at a very critical support level right now, and if it breaks down below this, the trade will be cancelled. It’s just finished completing the ‘Jesus Take The Wheel’ pattern on the weekly & MONTHLY. This is an extremely high probability pattern, and could cause a blow-off top for Ethereum.
We also see that we got a Wykoff Pattern here, with the last one that we got around the $2k level being a fake out. The only other times it has printed aside from the last fake out, it has been the start of a bull run. ETH now has 6 weeks in total, or about 4 more weeks from now to start recovering old levels, and taking off to the moon.
I drew a bar pattern on the chart that I took from its original bullish pattern from the start of the 2013 bull run. I believe we’ll have a shortened cycle, and due to not having much time left to complete the bull run during this 4-year cycle, that’s all we will get. Thankfully, the price has been beaten down so much, that getting in now, will offer 1000% gains, in just about 6 months. This will be one of the most incredible feats in all of crypto.
Fear is at an all time high, and ETH has been teasing everyone with a bull run for months and even years now. We haven’t seen an all time high since 2021. Most investors will suffer from boredom exhaustion as well, and with the stock market also sinking, we could see a huge push once we recover some levels, for the masses to finally come into the market via Ethereum ETF’s, so they don’t have to actually risk any money moving crypto around. The boomers and traditional investors with stock accounts will be free to throw cash at these ETF’s and that’s what will give us our final pumps past all time highs, once the crypto traders all get back into the market, and get us to new ATH’s in the first place, and help us recover key levels.
One thing is clear: ETH needs to stop trying so hard to control its environment, it’s time to just let Jesus Take The Wheel 🚀
ETHBULLUSD trade ideas

ETH/USD Breakout Trading Setup – Long Entry with 16% Target PoteEntry Point: $1,593.08
Target Point: $1,807.83
Stop Loss: $1,472.68
Risk/Reward Ratio: Roughly 2.1:1
Indicators Used:
EMA 30 (Red Line) at $1,593.08 (near entry point)
EMA 200 (Blue Line) at $1,605.09
Analysis:
1. Consolidation Phase:
ETH is in a sideways range after a prior downtrend, consolidating within the purple support zone.
This zone (~$1,555 to ~$1,593) has been tested multiple times, suggesting a strong base.
2. Bullish Breakout Anticipation:
The setup expects a breakout above consolidation, targeting a 16.11% move to $1,807.83.
A breakout strategy is being applied, assuming ETH will reverse from this consolidation area a

Is Ethereum DEAD ?🚨🚨🚨Important Video 🚨🚨🚨
MartyBoots here , I have been trading for 17 years and sharing my thoughts on ETH here.
.
Is COINBASE:ETHUSD DEAD?
Very interesting chart but Tariffs could do more damage
Important Video
Watch video for more details

ETH Wykoff Accumulation and Massive Falling WedgeWe could be seeing a big up move here this weekend. Wyckoff accumulation is almost complete, if support holds we should see a breakout of the falling wedge. However, I think this will be a huge trap to shake out sellers, so be looking to take profits.

ETHUSD INTRADAY falling resistance retest at 1,724The ETH/USD pair is exhibiting a bearish sentiment, reinforced by the ongoing downtrend. The key trading level to watch is at 1,724, which represents the current intraday swing high and the falling resistance trendline level.
In the short term, an oversold rally from current levels, followed by a bearish rejection at the 1,724 resistance, could lead to a downside move targeting support at 1,409, with further potential declines to 1,350 and 1,265 over a longer timeframe.
On the other hand, a confirmed breakout above the 1,724 resistance level and a daily close above that mark would invalidate the bearish outlook. This scenario could pave the way for a continuation of the rally, aiming to retest the 1,840 resistance, with a potential extension to 1,926 levels.
Conclusion:
Currently, the ETH/USD sentiment remains bearish, with the 1,724 level acting as a pivotal resistance. Traders should watch for either a bearish rejection at this level or a breakout and daily close above it to determine the next directional move. Caution is advised until the price action confirms a clear break or rejection.
This communication is for informational purposes only and should not be viewed as any form of recommendation as to a particular course of action or as investment advice. It is not intended as an offer or solicitation for the purchase or sale of any financial instrument or as an official confirmation of any transaction. Opinions, estimates and assumptions expressed herein are made as of the date of this communication and are subject to change without notice. This communication has been prepared based upon information, including market prices, data and other information, believed to be reliable; however, Trade Nation does not warrant its completeness or accuracy. All market prices and market data contained in or attached to this communication are indicative and subject to change without notice.

ETHUSDT We are in the C wave of a flat pattern, and with the completion of wave C, we expect the start of an upward wave.

ETH Bulls Might Have a Shot – Tight Range Before the Breakout📅 What just happened on ETH?
Ethereum recently printed a local bottom just below 1400 – a level that felt unthinkable just a few months ago. But as it often happens in crypto, the unexpected became reality.
💡 What came next?
From that low, ETH bounced strongly, signaling the start of a natural correction. While I personally don’t believe this is the final bottom, I do see opportunity on the upside.
🧐 What the chart tells us:
Sharp reversal from under 1400
Quick drop but failed continuation lower
Current tight consolidation, which often leads to breakout setups
🧠 My view:
Right now, this looks like a temporary bottom, and until proven otherwise, I’m interested in buying the dip. As long as the structure holds, bulls might have the upper hand short-term.
🎯 My Trading Plan:
Looking to go long, with 1800 as my target.
Risk-Reward? I’m aiming for at least 1:2, so I’ll be waiting for the right entry signal before jumping in.

ETH - Log long Chart!Hello TradingView Family / Fellow Traders. This is Richard, also known as theSignalyst.
Let’s keep it simple! ⚡
📈 ETH is approaching a major structure and potential rejection zone marked in blue.
As long as this key support holds, the long-term bullish bias remains intact.
It’s only a matter of time before the bulls step in — confirmation will come from lower timeframes. 👀
📚 Always follow your trading plan regarding entry, risk management, and trade management.
Good luck!
All Strategies Are Good; If Managed Properly!
~Rich

ETH/USD....2h chart pattren..MY signaling a short position on ETH/USD at $1,630, with targets at $1,500 and $1,400. Here's a quick breakdown:
Trade Setup:
Entry: 1,630 (Sell)
Target 1: 1,500
Target 2: 1,400
Stop-Loss: (You didn’t specify — want to include one?)
Considerations:
Is this a scalp, swing, or position trade?
Are you basing this on technical analysis, market sentiment, or fundamentals?
If you'd like, I can:
Pull up recent ETH/USD chart trends
Help you set a risk-reward ratio
Provide TA like resistance/support or RSI/MACD insights
Want a quick chart read or market sentiment check?

#Ethereum + $10k Local top!#Ethereum + $10k Local top!
A real #Altcoins Season will only begin when CRYPTOCAP:ETH rises.
Whether you love it or hate it, it's just a fact and the truth is always bitter.


ETH - Cash inflowThe price of Ethereum has remained stable in the $1,500 to $1,600 range for about a month, but according to the analysis of indicators that are positively correlated with Ethereum, we can see the influx of liquidity into the market and we expect this digital currency to increase to the target range in the coming days.
Sasha Charkhchian

ETHPossible buy zone. We're waiting for a future event that will unbalance cryptocurrencies.
Wychoff and our own analysis are reflected in this chart.

ETHUSD: Prepare to buy if this trendline breaks.Ethereum remains bearish on its 1D technical outlook (RSI = 41.779, MACD = -115.050, ADX = 39.213) despite an encouraging start to the day as the 4 month Channel Down is intact. The 1D RSI is supported and is trading sideways and ETH itself is back to historic buy levels. We are willing to buy only after a break over the 1D MA50 validates the trend change technically. If that happens we will aim for the 2.0 Fibonacci extension (TP = 2,800). You can use as an extra validation condition a potential break of the 1D RSI above the R1 level.
## If you like our free content follow our profile to get more daily ideas. ##
## Comments and likes are greatly appreciated. ##

#ETH/USDT#ETH
The price is moving within a descending channel on the 1-hour frame, adhering well to it, and is heading for a strong breakout and retest.
We are seeing a rebound from the lower boundary of the descending channel, which is support at 1555.
We have a downtrend on the RSI indicator that is about to be broken and retested, supporting the upward trend.
We are looking for stability above the 100 moving average.
Entry price: 1591
First target: 1628
Second target: 1658
Third target: 1695

ETH/USD... 1h Chart Pattren...MY buy position on ETH/USD at 1,670 with targets at 1,760 and 1,850 looks promising. Let's dive into some key factors to consider:
*Technical Indicators*
1. *RSI (Relative Strength Index)*: Check if ETH is oversold or overbought. An RSI below 30 might indicate a buying opportunity, while above 70 could suggest it's overbought.
2. *MACD (Moving Average Convergence Divergence)*: A bullish crossover (MACD line crossing above the signal line) could support your buy position.
3. *Support/Resistance Levels*: Identify key support levels around 1,670. If there's strong support, it could bounce back up. Resistance levels near 1,760 and 1,850 might pose challenges.
*Market Sentiment*
1. *News and Trends*: Keep an eye on crypto market news, regulatory announcements, and technological developments that could impact ETH's price.
2. *Broader Market Conditions*: The overall crypto market sentiment can influence ETH's price. A bullish trend in Bitcoin often lifts other cryptocurrencies.
*Risk Management*
1. *Stop-Loss Orders*: Set a stop-loss below a significant support level to limit potential losses. This could be around 1,600 or lower, depending on the current support levels.
2. *Position Sizing*: Ensure you're not risking more than you can afford to lose on this trade. Consider your overall portfolio and risk tolerance.
3. *Diversification*: Make sure your portfolio is diversified to mitigate risks associated with crypto volatility.
*Additional Considerations*
1. *Volume*: Check the trading volume. Higher volume can validate the strength of the price movement.
2. *Trend Lines*: Identify any trend lines that might influence the price. A break above a downward trend line could signal a reversal.
*Next Steps*
- *Analyze Charts*: Take a closer look at the ETH/USD charts on different time frames (1-hour, 4-hour, daily) to identify patterns and key levels.
- *Stay Updated*: Keep up with market news and technical analysis to adjust your strategy as needed.
- *Review Risk Management*: Regularly review your stop-loss and take-profit levels based on market conditions.
Would you like to explore specific technical indicators or discuss potential scenarios based on market news?

ETHEREUM | 1H | IMPORTANT LEVELS AND MY TARGETHey there, my dear friends!
I’ve taken a deep dive into BINANCE:ETHUSDT just for you. If it breaks above the 1,693 level, the next target will be 1,800.0. On the flip side, a key support level sits around 1,473.0.
All I ask in return is your support through likes — it really means a lot!
Big thanks to everyone showing love and support with those likes!

Weekly Cryptocurrency Analysis:Ethereum(ETH)–Issue 274(FreeThe analyst believes that the price of ETHUSD will decrease within the time specified on the countdown timer. This prediction is based on a quantitative analysis of the price trend.
___Please note that the specified take-profit level does not imply a prediction that the price will reach that point. In this framework of analysis and trading, unlike the stop-loss, which is mandatory, setting a take-profit level is optional. Whether the price reaches the take-profit level or not is of no significance, as the results are calculated based on the start and end times. The take-profit level merely indicates the potential maximum price fluctuation within that time frame.

Ethereum Hits Support – Time to Load Up?🎢 The Great 112‑Day Drop
What happened? Over the past 112 days, ETH tumbled –66%, sliding from $4109 down to $1383 and oh yeah, it even poked its nose below the January 2018 all-time high. 7 years ago!
Support Zone: 0.786 + Volume Profile
0.786 Fib: $1,570.85 (drawn from the 2022 low $870.80 to that $4109 high).
5‑Year POC: $1565
Hold Tight: For 2 weeks, the 0.786 level has acted as support, bouncing price right back up.
Sell in May and go away? Rather buy in May and grab some gains on the way?
Trade Blueprint: Your Ethereum Game Plan
Entry Zone: $1570.85
Stop Loss: Below $1369.79
Profit Targets: $1800, $2000 ,$2500, $3000
Risk/Reward: Risk ≈13%, Reward ≈91%, a solid 7:1 R:R
DCA
Missed the perfect entry? No drama... dollar‑cost average between $1700 and $1500.
Keep an eye on the monthly open at $1822. Bulls need to break this resistance zone.
Bottom Line
Ethereum’s –66% dive has handed us a golden ticket at the 0.786 fib and 5‑year POC. This is one of those “buy the dip” moments.
________________________________
💬 Found this helpful? Drop a like and comment below. Want TA on another coin? Let me know and I’ll break it down for you.
Happy trading everyone! 💪

Global Market Overview. Part 4.1: ETHEthereum: Fell. Miscalculated. Still Believe.
(Previous post:https://www.tradingview.com/chart/BTCUSD/ecmMaAdq-Global-Market-Overview-Part-4-BITCOIN/)
Let me get straight to the point: I lost over $300,000 during the last Ethereum rally. That’s a fact. And I’m not alone.
But here’s what truly matters: I still consider Ethereum one of the most fundamentally strong assets in the entire crypto market.
And I’ll explain why this drop isn’t a collapse into the abyss — but a temporary breakdown in price mechanics, driven not by fundamentals, but by greed and speculation.
What went wrong?
At first glance, the market behavior made no sense.
While BTC, Solana, XRP — and even meme coins — were being aggressively bought up, Ethereum just... froze.
No breakout. No test of previous highs. Not even a real attempt.
Which is strange, considering:
Ethereum has become a deflationary asset — more ETH is being burned than issued
ETH ETFs have attracted hundreds of millions of dollars
Developers are consistently improving the network and reducing fees
It remains the backbone of both the DeFi and NFT ecosystems
And yet — the price stood still. And then it fell.
Why? Because we are to blame.
Let’s be honest. I made a mistake. Just like millions of others.
Instead of holding ETH on spot, I went long with leverage on futures.
I thought I’d amplify my volume. Boost my profits.
Instead — I amplified my liquidation.
That’s exactly what happened to the market:
ETH futures volume exceeded spot volume
Open interest in long positions skyrocketed
Market makers saw the imbalance — and began systematically flushing out over-leveraged positions
The price didn’t fall because there’s something wrong with Ethereum.
It fell because the market became too one-sided.
Greed became vulnerability — and the market makers took full advantage.
And then came tariffs.
As if the futures flush wasn’t enough, the market got hit with more bad news:
Trump’s administration escalated a new trade war.
Stock indices dropped. The dollar strengthened.
Crypto got slammed again — this time not technically, but macroeconomically.
Now Ethereum is sitting far below its highs.
Disappointment in the eyes of millions.
And yes — heavy losses, including mine.
Will there be a reversal?
Yes. Hell yes.
I don’t know exactly when, but I’m absolutely certain that it will come.
Ethereum will recover.
Why?
There’s fundamental demand. Exchanges are running low. Whales are accumulating and transferring ETH to cold storage.
Technologically, it’s stronger than its competitors. No other L1 or L2 has the developer base or ecosystem Ethereum commands.
The market will get a tailwind. Any de-escalation in the trade war could reignite the entire crypto space.
It’s undervalued. ETH at $2,000 is a floor. In a normal market phase, it’ll trade much higher — significantly.
This isn’t a revenge play. It’s analysis.
I’m not writing this to justify myself.
I’m writing to say this: Ethereum is not dead.
It’s exhausted. Temporarily.
I understand those who sold. It’s human.
But I’m staying. Because unlike hype-driven altcoins, Ethereum is infrastructure.
You can’t replace it.
You can’t bypass it.
You can only ignore it — and regret it later.
Bottom line
Ethereum doesn’t have to move in sync with Bitcoin.
It has its own path.
But that path is not downward.
Right now, it just happens to go through the pain of futures liquidations and media noise.
As soon as Trump exhales, as soon as the rhetoric shifts — the market will see ETH at $2,500 and beyond.
And this growth won’t be speculative — it’ll be based on fundamentals.
Yes, I lost $300K.
But I haven’t lost faith in the asset.
And I’m not going anywhere.
Because Ethereum doesn’t end with this drawdown.
It’s just getting ready for its next phase.

Be careful with ETH !!!now is the time for ETH to rise again to 1900 . STRONG SUPPORT 1530 .
Give me some energy !!
✨We spend hours finding potential opportunities and writing useful ideas, we would be happy if you support us.
Best regards CobraVanguard.💚
_ _ _ _ __ _ _ _ _ _ _ _ _ _ _ _ _ _ _ _ _ _ _ _ _ _ _ _ _ _ _ _
✅Thank you, and for more ideas, hit ❤️Like❤️ and 🌟Follow🌟!
⚠️Things can change...
The markets are always changing and even with all these signals, the market changes tend to be strong and fast!!

CRYPTO - Ethereum - Ascending triangle - Get longEthereum is forming an ascending triangle and is about to break up.
Ascending triangles are high probability patterns. They have set targets and are easy to figure out the stop loss.
The stochastic has just traded down and is ready to bounce.
RSI is above 50 so buyers are in control.
The current price is 1641.
Target 1 is 2000 which is 20% with no leverage.
You need a stop loss at 1550.
