Karma hit fastKarma hit fast.
Hacker steals 2,930 ETHETH CRYPTOCAP:ETH ($5.4M) from zkLend... then gets phished while using Tornado Cash.
All 2,930 ETHETH CRYPTOCAP:ETH ($5.4M) gone — to another thief.
Trade ETHETH CRYPTOCAP:ETH , come to Gate – no need to think of reasons, just a pure recommendation! 😄
ETHBULLUSD trade ideas

EthereumETHUSD
- Bearish Channel as corrective pattern in Long Time Frame
- Support Level
- Demand Zone
- Completed " 12345 " Impulsive Waves
- Order Block

How is the market predictible? I was just wondering if there is some pattern on the market/economy...
The 2020-2023 range was wild because of the pandemic so I'm not sure if it relevants as it is. The next cycle (nowadays) is more calmer, could it be a reference point for the future forecast?
Has it linear increase or even concave upward like hyperbolic?
What do you think?
These are just speculations, wery rough numbers more like share my thought.

DOUBLE BOTTOM IN ETH / ETH TO $2,500Hello! We have confirmation of a double bottom. Eth has a bullish pattern, the price reached the liquidity zone at $1,780, took positions, and the price began to form a double bottom. The price of Eth has already gained liquidity, and on a weekly and daily chart, the price will be looking at $2,500. Remember that a weekly chart is for seeing results between 20-30 days and a weekly chart will be seeing results over a period of 3 months. It is not ruled out that the price remains in its range. However, the indicators, price action, and market sentiment tell us that Eth is suitable for long positions.

ETHEREUM SHORT TO $786! (UPDATE)ETH keeps on dumping😉
That's the power of Elliott Wave. We can see from our analysis that ETH remains within a 3 Sub-Wave (A,B,C) corrective channel. From naked price action we can still see that price remains bearish. Wave C target still remains around $786🩸


ETHUSD – Double Bottom Formation & Falling Wedge Breakout | 4H AEthereum (ETH) has completed a Falling Wedge breakout followed by the formation of a potential Double Bottom pattern on the 4H timeframe, signaling a bullish reversal setup.
Technical Analysis:
Falling Wedge Breakout indicates trend reversal potential.
Double Bottom structure formed around $1,700 – $1,750 support zone.
Key Resistance Levels: $2,005 and $2,500 (pattern targets).
Fundamental Outlook:
Growing Ethereum network activity and ETF speculations supporting bullish sentiment.
Market participants eyeing Ethereum’s role in broader crypto adoption & DeFi space.
Broader crypto market recovery adding positive momentum.
If price sustains above $1,880, further upside towards $2,005 and possibly $2,500 can be expected. Break below recent bottom may invalidate this setup.
Watch for volume confirmation and market sentiment drivers!
Must Support Me Share My Idea With Your Firends Mention Your Feed back Comment Section

ETHUSD INTRADAY downtrend continues below 2,171The ETH/USD pair is exhibiting a bearish sentiment, reinforced by the ongoing downtrend. The key trading level to watch is at 2,171, which represents the current intraday swing high and the falling resistance trendline level.
In the short term, an oversold rally from current levels, followed by a bearish rejection at the 2,171 resistance, could lead to a downside move targeting support at 1,872, with further potential declines to 1,770 and 1,670 over a longer timeframe.
On the other hand, a confirmed breakout above the 2,171 resistance level and a daily close above that mark would invalidate the bearish outlook. This scenario could pave the way for a continuation of the rally, aiming to retest the 2,272 resistance, with a potential extension to 2,345 levels.
Conclusion:
Currently, the ETH/USD sentiment remains bearish, with the 2,171 level acting as a pivotal resistance. Traders should watch for either a bearish rejection at this level or a breakout and daily close above it to determine the next directional move. Caution is advised until the price action confirms a clear break or rejection.
This communication is for informational purposes only and should not be viewed as any form of recommendation as to a particular course of action or as investment advice. It is not intended as an offer or solicitation for the purchase or sale of any financial instrument or as an official confirmation of any transaction. Opinions, estimates and assumptions expressed herein are made as of the date of this communication and are subject to change without notice. This communication has been prepared based upon information, including market prices, data and other information, believed to be reliable; however, Trade Nation does not warrant its completeness or accuracy. All market prices and market data contained in or attached to this communication are indicative and subject to change without notice.

Bullish Divergence on the dailyI would also say that there is a bullish divergence happening on the daily, which further indicates likelihood of upward momentum.

Resistance line from 2020As you can see from this simple monthly chart, we are in a symmetrical wedge and at the resistance line dating back to early 2020. I would say it's far more likely we trend up from here on the macro.

K.I.S.S => ETHHello TradingView Family / Fellow Traders. This is Richard, also known as theSignalyst.
📉 ETH Market Update – Keeping It Simple 📉
Since breaking below its last major low in December 2024, Ethereum (ETH) has been stuck in a bearish trend.
But don’t lose hope, bulls! 🐂
For the long-awaited altseason to kick off, ETH needs to flip the script and break above its last major high — currently sitting at $2,100.📈
Until then, patience is key. 🧘♂️
📚 Always follow your trading plan regarding entry, risk management, and trade management.
Good luck!
All Strategies Are Good; If Managed Properly!
~Rich

ETH bullish RSI divergenceA bullish RSI divergence has formed on the daily timeframe, supporting the weekly trendline.
Are we going up from here ?

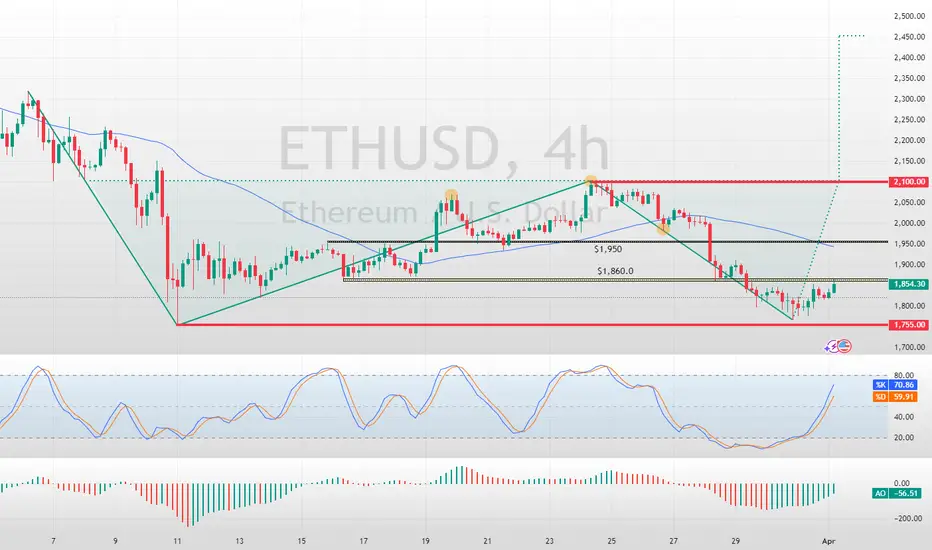
Ethereum Price Rebounds: Key Levels to WatchFenzoFx—Ethereum's downtrend stabilized at $1,755, a key support level. Currently, ETH/USD trades at $1,854, testing resistance.
A double bottom pattern on the 4-hour chart suggests potential growth if bulls secure a close above $1,860. The next target could be $1,950, supported by the 50-period moving average.

Ethereum Not Dead- i know some peoples think ETH will go to 250$ or 500$, so wait for it...
- I've always maintained that I'm not a fan of ETH because of its scalability limitations and centralization, for that reason ETH needs some messy L1...L2...etc..
- That said, my opinion doesn’t matter much, ETH is here to stay. The Ethereum ecosystem hosts thousands of projects; I’d say it’s too big to fail.
- i used Bitstamp exchange to look further back in the chart's history.
- i simplified this monthly chart so much that even a 10 year old kid could understand it, just check the RSI low levels and compare it with previous years. Again, check the max RSI level for the previous ATHs.
- i won't discuss where to buy because, whether you get ETH at $1,800 or $1,500, the bull run for ETH and Altcoins hasn't started yet.
Happy Tr4Ding !

Heading into 50% Fibonacci resistance?Ethereum (ETH/USD) is rising towards the pivot which has been identified as a pullback resistance and could reverse to the 1st support.
Pivot: 1,945.48
1st Support: 1,751.48
1st Resistance: 2,038.68
Risk Warning:
Trading Forex and CFDs carries a high level of risk to your capital and you should only trade with money you can afford to lose. Trading Forex and CFDs may not be suitable for all investors, so please ensure that you fully understand the risks involved and seek independent advice if necessary.
Disclaimer:
The above opinions given constitute general market commentary, and do not constitute the opinion or advice of IC Markets or any form of personal or investment advice.
Any opinions, news, research, analyses, prices, other information, or links to third-party sites contained on this website are provided on an "as-is" basis, are intended only to be informative, is not an advice nor a recommendation, nor research, or a record of our trading prices, or an offer of, or solicitation for a transaction in any financial instrument and thus should not be treated as such. The information provided does not involve any specific investment objectives, financial situation and needs of any specific person who may receive it. Please be aware, that past performance is not a reliable indicator of future performance and/or results. Past Performance or Forward-looking scenarios based upon the reasonable beliefs of the third-party provider are not a guarantee of future performance. Actual results may differ materially from those anticipated in forward-looking or past performance statements. IC Markets makes no representation or warranty and assumes no liability as to the accuracy or completeness of the information provided, nor any loss arising from any investment based on a recommendation, forecast or any information supplied by any third-party.

ETH - 4 Red Monthly CandlesThis is the second time we’ve seen four consecutive red monthly candles for ETH. The last occurrence was during the 2018 bear market, where ETH crashed 88% from its peak.
This time, the four-month decline has resulted in a 57% drop so far. However, with the price now at a key support zone, I anticipate that the April 2025 candle will be green, signaling a strong recovery—potentially exceeding the previous month’s losses.
If April turns out to be another red month, we could see ETH dropping further toward the $1,300 level before finding a stronger bottom.
Let’s see how this plays out!
Cheers,
GreenCrypto

ETHEREUM BULLISH BIAS|LONG|
✅ETHEREUM fell again to retest the support of 1760$
But it is a strong key level
So I think that there is a high chance
That we will see a further bullish
Move up given that we are already
Seeing a bullish move up
LONG🚀
✅Like and subscribe to never miss a new idea!✅
Disclosure: I am part of Trade Nation's Influencer program and receive a monthly fee for using their TradingView charts in my analysis.

ETH/USD 4-hour chart analysisInstrument: ETH/USD (Ethereum vs. US Dollar)
Timeframe: 4-hour chart
Current Price: Around $1,825
Support Zone: $1,815 - $1,654 (marked in red)
Entry Point: Likely around $1,824.95 (highlighted near the buy setup)
Targets:
1st Target: Around $2,105.89
2nd Target: Around $2,227.71
3rd Target: Around $2,551.64
Final Target: Around $2,730.15
Stop Loss: Likely below $1,815 or around $1,654 (lower red zone)
The trade setup suggests a potential long (buy) trade if price confirms a reversal from the support zone. Let me know if you need further analysis.
Support Levels (S):
1. $1,815 - $1,825 → Strong support zone (current entry area)
2. $1,654 → Major support level (stop-loss area)
Resistance Levels (R):
1. $2,105 - $2,127 → First resistance (Take Profit 1)
2. $2,551 → Second resistance (Take Profit 2)
3. $2,750 - $2,800 → Final resistance (strong supply zone)
These levels act as potential bounce or rejection points. If price holds above support, an upward move is likely, but a break below could trigger a bearish trend. Let me know if you need further insights!

day four eth price prediction date: 3/31/2025ethereum is looking like it could be bouncing off of the bottom resistance and could be starting a triangle wave if so we should look for a breakout of those two lines


LONG ON ETHEREUM (ETH/USD)Ethereum has given a change of character (choc) to the upside on the 4 hour timeframe...
followed by a nice sweep of engineered liquidity!
Its currently respecting a key demand are and I believe it will now rise for 300-500 points this week.
I am buying Eth to the next level of resistance.

Is Ethereum going for a lower low?So far, MARKETSCOM:ETHEREUM is struggling to find strong support, from which it could change course and go for higher highs. At the moment, the main scenario on the watch is the one, examining lower lows. If it clear the lowest point of March, that may attract more sellers into the game, at least in the near term.
CRYPTO:ETHUSD
Let us know what you think in the comments below.
Thank you.
74.2% of retail investor accounts lose money when trading CFDs with this provider. You should consider whether you understand how CFDs work and whether you can afford to take the high risk of losing your money. Past performance is not necessarily indicative of future results. The value of investments may fall as well as rise and the investor may not get back the amount initially invested. This content is not intended for nor applicable to residents of the UK. Cryptocurrency CFDs and spread bets are restricted in the UK for all retail clients.
