Etherium will blast in upcoming weeksI m very sure that Etherium will very bullish in coming days so traders don't escape this opportunity 2800 is very good zone where market can reach .
ETHBULLUSD trade ideas

Eth to $2,500?Hello friends! Well, I'm sharing my opinion. Eth is feeling boring. There isn't much volatility, however, the rebound is clear. It's clear that it will be testing the $2,250 area. However, there are two scenarios:
A) A brief approach with a very sharp rejection.
B) A strong upward breakout to use the $2,250 area as support and reach the famed $2,500, which is a highly liquid area.
In conclusion, the price will seek the $2,250 area early in the week, and buying pressure will determine the final direction.
Disclaimer: This is only an opinion; it should not be used as investment advice or recommendation.

ETH USD SHORT Ethereum price has been choppy and low in volume since it's major dump during the week.
And still can't get passed the minor resistance zone, from which I'm capitalizing on to the next major Support in confluence with the diagonal Support Trendlines.
So let's see how price moves.
The_KLASSIC_TRADER.

ETH to 4k-4.8k & potentially a new HIGH*I am in no way a financial advisor and you should always do your own due diligence before placing any trade. Do not trade what you are not comfortable with losing. No trade is guaranteed.
SL 1970
TP 1: 4,000
TP 2: 4,800

$ETHNot much to say about CRYPTOCAP:ETH but we can see that institutions love ETH, possible $10,000 per Ethereum is coming.
What your thoughts? Comment Like & Share
Whales Only: Ride Ethereum’s 5x Wave to $8K and Beyond"Attention traders and whales—check this chart! I’m breaking it down with monthly candles.
Short-term traders: Think twice before shorting. Flip your chart to monthly, peek at the RSI, and see the risk you’re taking for a few bucks. Whales are lurking, and they’ll scoop your tiny bags when you least expect it.
Long-term traders and whales: This is your playground. Last bear market, monthly RSI hit 44 with ETH priced between $900-$1,000. From there, we spiked to $4,000 three times. Buyers loaded up at $900-$1,200, sold at the top—first a 3x run, then two 2x corrections. Total move? 5x.
Fast forward to today: RSI’s back at 44, the same level as the last bear bottom. History’s whispering opportunity. When the next bear market hits, most coins will bleed red—but not Ethereum. Expect green daily candles and long-trade fireworks. From $1,750, we’re eyeing a 3x-5x surge: first to $8K, dip to EUROTLX:4K , then back-to-back $8K runs.
We’re sitting at $1,970 now, just above the $1,750 bottom. This is a whale’s game—perfect for those dropping $100M+ into the market. Load up, legends. The chart doesn’t lie. "

Ethusd Long setup #nonchalantICTjust a long setup im seeing on ethusd. We purged sellstops and reverted higher. Then continued respecting discount arrays.

ETH/USDETH reaches the historical buy zone that triggers a macro bottom.
✅ Price is testing this trendline, just like it did in 2020, 2021, 2022, and 2023 - each time leading to a major bounce!
✅ RSI is also touching historical support, signaling a possible reversal.
If history repeats, this could be a high-reward buying opportunity before the next major move!

ETHUSD Bearish continuation pattern forming?The ETH/USD pair is exhibiting a bearish sentiment, reinforced by the ongoing downtrend. The key trading level to watch is at 2,140, which represents the current intraday swing high and the falling resistance trendline level.
In the short term, an oversold rally from current levels, followed by a bearish rejection at the 2,140 resistance, could lead to a downside move targeting support at 1,723, with further potential declines to 1,545 and 1,375 over a longer timeframe.
On the other hand, a confirmed breakout above the 2,140 resistance level and a daily close above that mark would invalidate the bearish outlook. This scenario could pave the way for a continuation of the rally, aiming to retest the 2,344 resistance, with a potential extension to 2,537 and 2,620 levels.
Conclusion:
Currently, the ETH/USD sentiment remains bearish, with the 2,140 level acting as a pivotal resistance. Traders should watch for either a bearish rejection at this level or a breakout and daily close above it to determine the next directional move. Caution is advised until the price action confirms a clear break or rejection.
This communication is for informational purposes only and should not be viewed as any form of recommendation as to a particular course of action or as investment advice. It is not intended as an offer or solicitation for the purchase or sale of any financial instrument or as an official confirmation of any transaction. Opinions, estimates and assumptions expressed herein are made as of the date of this communication and are subject to change without notice. This communication has been prepared based upon information, including market prices, data and other information, believed to be reliable; however, Trade Nation does not warrant its completeness or accuracy. All market prices and market data contained in or attached to this communication are indicative and subject to change without notice.

Could Pectra Upgrade leads Eth to 11K this cycle?
sentiment on ETH never has been that low while all the arguments against ETH will just be vanished with the upcoming Pectra upgrade
volume is as low as pre 2017 era so I think we can consider ourselves around June July 2017, when ETH made a ~70% retrace from 450 to 150 than peaked at 2K
Despite some delays I don't see why the upgrade will not happen...patience is key
_______
In a more technical view lets zoom to the daily timeframe
- its visible on the weekly chart: ETH bounced from weekly POC, saving it from collapse (?)
- around 0.5 fib now from low cycle to top cycle
- bounced back above that big blue trendline, its an important support that we dont want to loose
I would say the low has been done on the 11th of March, as for BTC
2 and a half possibilities here,
- bullish scenarios : I think there's too much stake on this asset, we bounce from here to see at least 2800 zone
either only up from now, either we go back to 1800 to make a double bottom, sort of H&S pattern kinda happening often at least this cycle
as long as we dont make a lower low this scenario is valid
in this scenario if the upgrade keep its promises and volume is back, I don't see why we wouldn retest new ATHs
- bearish scenario : we breakdown for a lower low aiming to 1600 area, the retest of the trendline above would fail and it would probably be the end of this bull market, that a lot of ppl have already called
______
fast check on whats happening if we zoom again:
Heres the 4H
4H closes in 1 hour but as you can see for now ETH pinged from that blue trendline i think we really dont want to loose
I bought a bit again today, lets see
cheeeers

2.5 reasons to not buy crypto todayLet me be clear - I am BULLISH on crypto! But for your wallet's sake, be patient! All (most) crypto investors want to be millionaires by next week on XRP and the like. I won't argue whether you will be or not - but please just give yourself a better entry!
Maybe we pop again before falling, maybe we never fall again, but with the broader markets in a bad place, we have every reason to dip further for more liquidity. For months I've been spitting out this same video in longer form and I simply wanted to show here, in the most basic way possible, why the crypto market wants to come down further. There are SO MANY BUYERS down below! If BTC wants to hit $1MM, ETH $10K and XRP $200, then we will need the liquidity that is sitting below to get there. We will need to shake out the last few that are holding crappy positions near ATH's and reload with larger institutional $.
The past few months in crypto have taught me an incredible lesson about patience because though my analysis has been telling me to wait, wait, wait, I am tempted every day to buy. And I'm not - instead I've been trusting my analysis and intuition and have been shorting BTC futures every chance I get.
Hope this helps someone to NOT BUY crypto today!
Happy Trading :)

ETHUSD Market Analysis: Technical Indicators and Bearish SentimeAs of now, ETHUSD has dropped to $1,961, registering a daily decline of $94.9. Earlier, it exhibited robust upward momentum, surging past the $2,000 threshold. However, it has since experienced a pronounced downturn.
In terms of technical analysis, although the MACD doesn't clearly indicate a trend, its histogram has transitioned from positive to negative and is shrinking, suggesting that bullish strength is waning. The KDJ indicator, with a reading of 90, is in overbought territory. The 4 - hour candlestick chart reveals a substantial price drop relative to earlier levels. Even though the last candlestick is bullish, the overall market sentiment remains bearish.
Recently, trading volume has dwindled. The phenomenon of prices rising while volume falls indicates a significant weakening of upward momentum.
The market may be influenced by profit - taking from the previous rally, which has triggered a selling frenzy. Moreover, external factors like macroeconomic conditions and regulatory policies could also be at play. If key support levels, such as $1,874, fail to be reclaimed, bears are likely to retain their dominance. Investors should vigilantly monitor these support levels and prudently adjust their investment strategies.
ETHUSD
sell@1980-2000
tp:1900
buy@1850-1870
1930-1950
I will share trading signals every day. All the signals have been accurate for a whole month in a row. If you also need them, please click on the link below the article to obtain them.

Ethereum (ETH/USD) – Potential Breakout from Range Towards $2,50📊 Chart Insights:
ETH/USD is currently ranging near the $1,950 zone, following a consolidation phase.
A strong resistance zone is visible between $2,302 - $2,527, which has historically acted as a rejection point.
Support levels are established around $1,824 - $1,909, forming a strong base for price action.
A breakout above the current range could signal a bullish move toward the $2,302 resistance level, with a further target at $2,527.
📈 Trading Plan:
✅ Entry: Buy above $1,966 on confirmation of breakout.
🎯 Targets: $2,302 and $2,527 for profit-taking.
❌ Stop Loss: Below $1,909 to manage risk.
📉 Bearish Scenario: If ETH fails to hold $1,909, a retest of $1,824 is possible.
🔥 Ethereum could see a strong rally if momentum builds above resistance! Are you ready?

ETH/USD.... 4H SETUPMY ETH/USD trade idea suggests a strong bullish setup, targeting significant upside levels. Here’s a refined breakdown:
📈 Trade Setup
Entry: Buy now at 1960 (current level).
Targets:
🎯 Target 1: 2230 (first key resistance).
🎯 Target 2: 2525 (next major level).
🎯 Target 3: 2830 (longer-term bullish objective).
Stop-Loss: 1765 (below recent support to manage risk).
🛠 Confirmation Factors:
Trend: Is ETH/USD forming higher highs & higher lows?
Indicators: RSI above 50? MACD bullish cross? Volume increasing?
Key Resistance Levels: Watch price action at 2000-2050 for confirmation.
🚨 Final Thought: Bullish setup looks promising, but confirmation at 2000-2050 would strengthen confidence. Want a fresh market check for confirmation?

"Ethereum Potential Breakout and Key Fibonacci Levels"This 4-hour Ethereum chart highlights a possible bullish move as the price approaches key resistance levels. Fibonacci retracement analysis suggests potential targets at $2,343 (0.5 Fib) and $2,458 (0.618 Fib). A successful retest of support could confirm an upward trend.
The moving average in yellow represents dynamic resistance, and a breakout above it may signal further strength. Will Ethereum sustain its momentum and push higher? Share your thoughts in the comments.
#Ethereum #ETH #CryptoTrading #TechnicalAnalysis #Crypto

ETH Eyeing Bullish Targets: $2,244 & $2,380On the 4‑hour chart, ETH appears to be carving out a descending wedge pattern (often a bullish formation) while the RSI is trending upward from oversold territory. Here are the key points to watch:
1.Descending Wedge:
- Price has bounced near the lower boundary of the wedge around the mid‑$1,900s.
A break above wedge resistance (roughly in the $2,000–$2,050 zone) could trigger accelerated upside.
2.Fibonacci & Price Targets:
- Expect 1 (~$2,244): First target aligns with a measured move out of the wedge and a key Fib extension zone.
- Expect 2 (~$2,380): Second target corresponds to a higher Fib extension (2.0–2.272), marking a stronger bullish continuation if momentum holds.
3.RSI Confirmation:
- The 4‑hour RSI is turning upward, suggesting improving bullish momentum. A sustained move above 50–55 on the RSI would strengthen the case for further upside.
4.Pullback Risk:
- If ETH fails to break wedge resistance, it may retest support in the $1,900 area. A close below that could delay or invalidate the bullish setup.
Overall, ETH’s structure and momentum suggest a potential move toward $2,244 initially, with a push to $2,380 if buyers maintain control. A break above the wedge and sustained bullish RSI would be the clearest signals for continuation to these higher levels.

Falling towards pullback support?Ethereum (ETH/USD) is falling towards the pivot which has been identified as a pullback support and could bounce to the 1st resistance which acts as a pullback resistance.
Pivot: 1,940.23
1st Support: 1,827.50
1st Resistance: 2,107.47
Risk Warning:
Trading Forex and CFDs carries a high level of risk to your capital and you should only trade with money you can afford to lose. Trading Forex and CFDs may not be suitable for all investors, so please ensure that you fully understand the risks involved and seek independent advice if necessary.
Disclaimer:
The above opinions given constitute general market commentary, and do not constitute the opinion or advice of IC Markets or any form of personal or investment advice.
Any opinions, news, research, analyses, prices, other information, or links to third-party sites contained on this website are provided on an "as-is" basis, are intended only to be informative, is not an advice nor a recommendation, nor research, or a record of our trading prices, or an offer of, or solicitation for a transaction in any financial instrument and thus should not be treated as such. The information provided does not involve any specific investment objectives, financial situation and needs of any specific person who may receive it. Please be aware, that past performance is not a reliable indicator of future performance and/or results. Past Performance or Forward-looking scenarios based upon the reasonable beliefs of the third-party provider are not a guarantee of future performance. Actual results may differ materially from those anticipated in forward-looking or past performance statements. IC Markets makes no representation or warranty and assumes no liability as to the accuracy or completeness of the information provided, nor any loss arising from any investment based on a recommendation, forecast or any information supplied by any third-party.

Ethereum to $12,000 then $1,400 in 2025-2026Sets of twin waves interlinked by a corrective wave.
The impulse waves have a 1.272 relationship (log scale) to one another.
Timing is the most difficult. Look for general milestones (New Year) or major events (2026 World Cup in America+Mexico+Canada) that would also track with a proportion of the sister wave you're predicting based on.
Love you K.

Ethereum: The Undisputed Winner of the Next Altcoin Supercycle! Ethereum is setting up for a monumental breakout, and those still sleeping on it might wake up too late. With ETH 2.0 flashing a textbook WXYXZ correction—which historically has a 90% accuracy rate in predicting upside moves—we're looking at an explosive rally beyond $4,200 by year-end! But that's just the technical side of the story…
Trump's Crypto Gambit: The $350M ETH Play
The Trump family’s World Liberty Fund just made a massive $350M Ethereum acquisition, making it the largest institutional ETH buy in history. Why does this matter? Because Trump is no longer just a meme-coin catalyst—he's now one of the biggest Ethereum whales. His recent executive order designating ETH as one of the five official US crypto reserves is a game-changer, adding legitimacy and long-term demand.
ETH ETFs: The Institutional Money Tsunami 🌊
The Ethereum ETF is already approved, and this is just the beginning. If Bitcoin ETFs triggered a flood of institutional inflows, Ethereum is next in line for a massive institutional liquidity injection. With Wall Street giants accumulating ETH, the supply crunch will drive prices parabolic.
Solana’s Demise = Ethereum’s Gain
Let’s be real—Solana's meme-coin mania is unsustainable. The network is plagued by centralization risks, constant outages, and rug-pull scams. As investors lose faith in Solana, they’ll shift back to Ethereum’s battle-tested ecosystem for launching serious projects.
MACD Screaming "Buy Now!"
The MACD indicator is flashing a major bullish reversal, signaling that seller exhaustion is at extreme levels. With selling pressure drying up, the only direction left for ETH is UP! 🚀
The Path to $4,200+ 🚀
With:
✅ ETH 2.0’s corrective pattern ending (massive breakout incoming)
✅ Trump-backed ETH adoption fueling demand
✅ Ethereum ETF already approved, unlocking institutional money
✅ Solana's inevitable collapse pushing liquidity to ETH
✅ MACD confirming a bottom with barely any sellers left
Always do your own DD I, can be wrong.

DO YOU UNDERSTAND WHY ETH CAN'T BREAK THE $4000 PEAK YET?DO YOU UNDERSTAND WHY ETH CAN'T BREAK THE $4000 PEAK YET?
Are you still DCA'ing ETHUSDT?
Are you still holding ETHUSDT?
Are you still hoping for an altcoin season?
Good luck.

ETHUSD: Different asser, same pattern, same ending.Ethereum remains bearish on its 1D technical outlook (RSI = 40.440, MACD = -154.200, ADX = 29.206) but sits at the bottom of its 1 year Megaphone. This is the same pattern that Bitcoin traded on last year and Gold during its most recent Bear Cycle. In all instances, when the price found support on the MA50 and broke over the Megaphone, it reached the 2.0 Fibonacci. According to this, it won't be surprising if we see ETH at 9,000 by the end of the year.
## If you like our free content follow our profile to get more daily ideas. ##
## Comments and likes are greatly appreciated. ##

ETH will retest uptend line soonPossible ETH long setup—yeah, the ETH chart looks brutal after last month’s chaos, but let’s take a sober look at the structure and spot some long opportunities. Here’s the deal: ETH broke its uptrend from summer 2022, smashed through the 200-day EMA, and liquidated most longs—even those with low leverage. End of the bull cycle or just a breather? We’ll see, but I’m leaning toward the latter. Still, in this macro mess, risky assets are struggling—new highs are unlikely until a fresh liquidity wave hits or the Fed keeps easing with rate cuts.
Right now, selling seems to be fading. On the 3D chart, we’ve got a Doji forming in oversold territory (same level as the June 2022 bottom), MACD shows selling momentum dropping, and on lower timeframes, a descending wedge is shaping up. All signs point to a correction after the last 2 months’ drop. Worth noting: we broke that key diagonal level but never retested the trendline. I expect us to hold above 2150$ soon. After some consolidation, price could retest the uptrend line—either to reclaim it or confirm it as resistance. Target: 2700-2800$. That’s where the 200 3D EMA and a big liquidity sweep level at 2860$ sit.

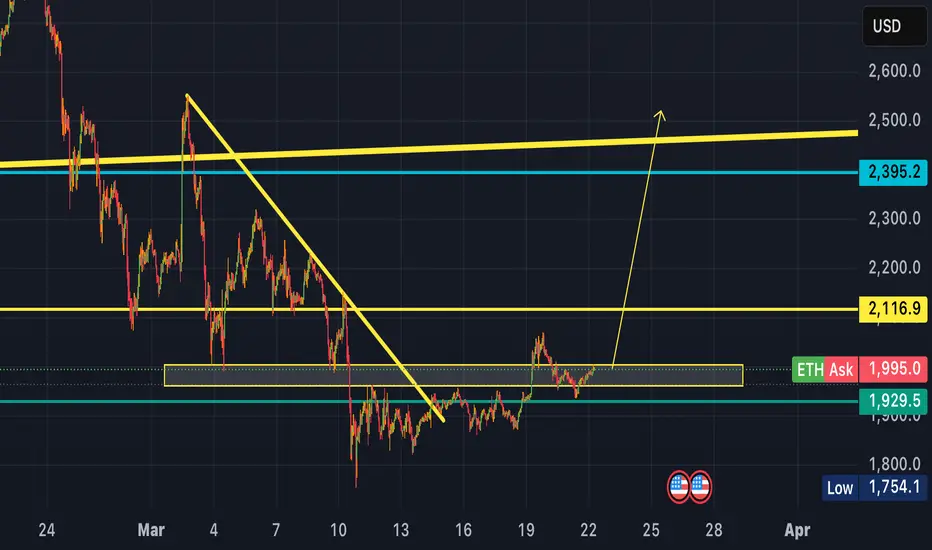
Ethereum (ETH/USD) - Potential Breakout from RangeEthereum (ETH/USD) - Potential Breakout from Range
Chart Overview:
The price of Ethereum (ETH/USD) has been consolidating within a range after breaking out of a long-term downtrend channel.
A strong support level is identified around $1,852, which has been holding the price steady.
A resistance zone near $2,076 is acting as a short-term barrier for upward movement.
Trading Idea:
If ETH successfully breaks above the range, it may trigger a bullish move towards $2,539 and potentially $2,854.
Entry Strategy: Wait for a confirmed breakout above $2,076 with strong volume.
Stop-Loss: Below $1,852 to minimize risk.
Market Sentiment:
ETH/USD is showing signs of accumulation, and a breakout could signal a new bullish trend.
