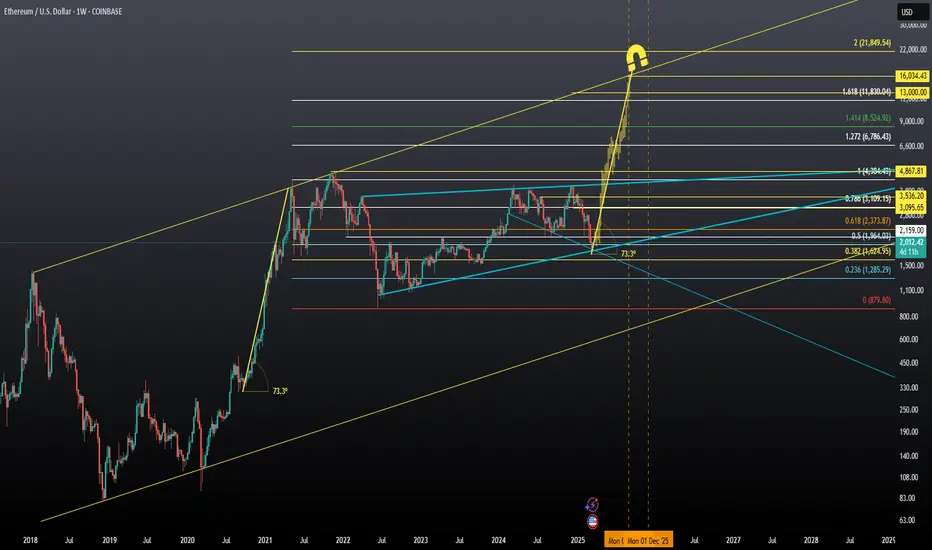
$ETH Mission to $15k in 2025The CRYPTOCAP:ETH chart reeks of market maker meddling—erratic swings and volume surges that defy natural flow. On the macro, I’m targeting the 3.618 Fibonacci, projecting $15.3K (±5%). The fingerprints of an orchestrated push are everywhere, yet the Fibs hold firm. Some might nitpick my 4th wave breaking Elliott Wave rules, but anyone tracking ETH this cycle knows manipulation has been the real driver.
Market makers play a critical role in financial markets, including crypto like CRYPTOCAP:ETH , by providing liquidity and facilitating trades. However, their tactics can sometimes tilt the game in their favor, especially in less-regulated spaces. Here’s a breakdown of common strategies they might use to manipulate price action, potentially aligning with the CRYPTOCAP:ETH chart behavior you’re observing:
Spoofing: Market makers place large buy or sell orders with no intention of filling them, creating fake walls of supply or demand. This tricks retail traders into buying or selling prematurely. On CRYPTOCAP:ETH , you might see sudden order book depth vanish as price approaches key levels, like a Fibonacci retracement, only for it to reverse abruptly.
Wash Trading: They execute rapid buy-sell trades with themselves to inflate volume, signaling artificial momentum. This can lure traders into chasing a “breakout” on CRYPTOCAP:ETH , only for the price to stall—say, short of your 3.618 Fib target around $15.3K—leaving late entrants holding the bag.
Stop Hunting: Market makers often push prices just past common stop-loss zones (e.g., below a support like $2K or above resistance) to trigger liquidations. In CRYPTOCAP:ETH ’s case, a dip below a psychological level followed by a quick recovery could signal this, padding their pockets with liquidated positions.
Momentum Ignition: By placing strategic trades, they kickstart a trend—up toward your $15.3K target, for instance—drawing in FOMO-driven retail. Once the herd piles in, they dump their positions, capping the move before it hits the levels you’re watching.
Order Book Fading: They thin out liquidity at key price points, making it easier for CRYPTOCAP:ETH to swing wildly. If the chart shows low-volume pumps or dumps around strong indicators, then it’s a sign they’re controlling the pace to shake out weak hands before the real move.
ETHBULLUSD trade ideas

Which way market?? ETH up?Looking like a good short term swing trade. Looks like a completed ABCD pattern. Looks like it’s breaking trend lines. A good trend reversal pattern after the wedge. With FIB 50% as the neckline for rising wedge. Symmetrical triangle.
I’m looking for it to reverse to the 200ma on 4hr chart
$2200 likely
$2700 potentially
Long term trend reversal possible.

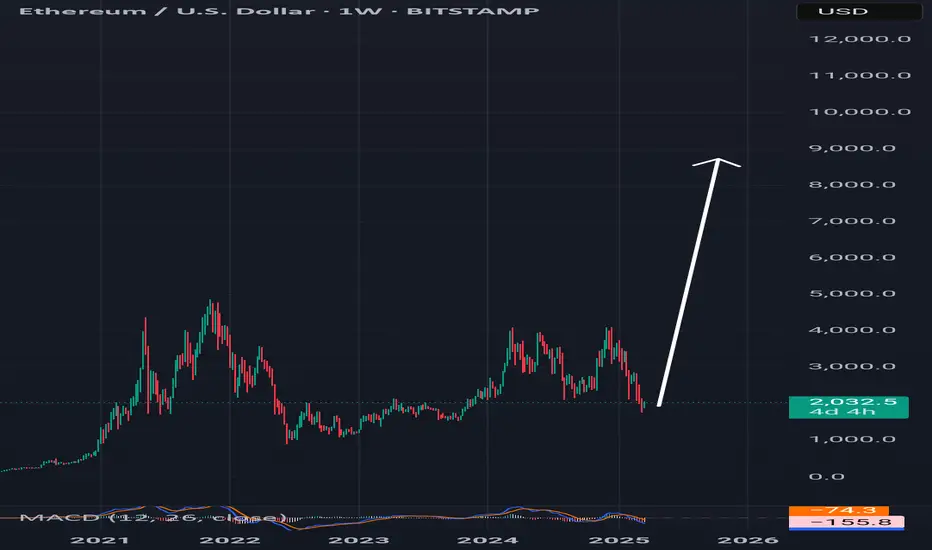
buying@Eth ...Ethereum's correction structure is complete, and this could lead to a strong upward push toward $8,000 or $9,000.
This is just an analysis, not financial advice.
ETHEREUM -Weekly forecast,Technical Analysis & Trading IdeasMidterm forecast:
While the price is above the support 1521.00, beginning of uptrend is expected.
We make sure when the resistance at 2090.33 breaks.
If the support at 1521.00 is broken, the short-term forecast -beginning of uptrend- will be invalid.
BITSTAMP:ETHUSD MARKETSCOM:ETHEREUM
Technical analysis:
A trough is formed in daily chart at 1750.30 on 03/11/2025, so more gains maximum to Major Resistance (2090.33) is expected.
Take Profits:
2362.31
2546.73
2801.10
3042.75
3516.43
3741.60
4107.80
4500.00
4868.00
__________________________________________________________________
❤️ If you find this helpful and want more FREE forecasts in TradingView,
. . . . . . . . Hit the 'BOOST' button 👍
. . . . . . . . . . . Drop some feedback in the comments below! (e.g., What did you find most useful? How can we improve?)
🙏 Your support is appreciated!
Now, it's your turn!
Be sure to leave a comment; let us know how you see this opportunity and forecast.
Have a successful week,
ForecastCity Support Team

Ethereum - Huge Pump in 2025Ethereum is in a bullish wedge pattern! It is pretty undervalued now at $2000! I believe ETH will pump hard in 2025, with the ambitious targets on the chart projected to be reached between September and December 2025.
Also, remember now ETH is the largest holding of World Liberty Financial the invest group of the trump family!
Ethereum (ETH/USD) Breakout – Next Targets $2,328 & Beyond!
Overview:
Ethereum has been in a downtrend, forming a descending channel, but it recently found strong support at $1,764 and has now broken out of a range-bound consolidation. This could be the beginning of a bullish move towards higher resistance levels.
Key Market Structure Analysis:
🔸 Previous Downtrend: ETH was trading within a bearish channel, creating lower highs and lower lows before bottoming out.
🔸 Accumulation Phase: A sideways consolidation range between $1,764 - $2,017 formed after the downtrend, signaling potential accumulation.
🔸 Breakout Confirmation: ETH has broken above the $2,017 resistance, suggesting that buyers are stepping in.
Potential Trade Setup:
✅ Bullish Scenario:
A successful breakout retest around $2,000 - $1,950 could provide an entry opportunity.
Upside targets:
🎯 $2,328.95 – Major resistance level from previous price action.
🎯 $2,559.17 – Next key resistance if momentum continues.
⚠️ Bearish Scenario (Invalidation):
A drop below $1,950 - $1,900 could push ETH back into the previous range.
Losing the $1,764 support could lead to a retest of $1,600 or lower.
Final Thoughts:
Ethereum is showing strength after breaking out of a key consolidation range. If the breakout holds, ETH could be gearing up for a strong rally toward $2,328 - $2,559. However, a retest of the breakout zone may provide a better risk-to-reward entry.
What do you think? Will ETH push toward $2,328 next? Drop your thoughts below! 🔥📈

Swing Trade - Long for market reversal?Watch ETH closely at $1800, this is a good risk to reward trade for the bounce. Stop loss in place in case the golden pocket Fibonacci ratio doesn’t hold. I have this has the final 5th wave correction. I’m also seeing signs of support on the Nasdaq on the 0.382 fib and somewhat of a bounce on the 15 min chart.
Not financial advice, purely for educational purposes.

ETHEREUM Megaphone bottom like March 2020Ethereum (ETHUSD) is currently on the first week of rebound after 3 straight red weeks when it was unable to break above the 1W MA50 (blue trend-line). This is taking place on a Lower Lows trend-line, technically the bottom of a 1-year Megaphone since the March 11 2024 High.
The market is no stranger to long-term Megaphone consolidation periods like that as last time we saw this was on the June 2019 - March 2020 Megaphone, which eventually broke upwards after the brutal COVID crash Bearish Leg that touched bottom. This is quite similar to the current Bearish since late December. Notice how perfectly aligned the Fibonacci retracement levels are.
Based on this, we expect at least a 1.5 Fibonacci extension test at $6000 before this Cycle tops at the end of the year.
-------------------------------------------------------------------------------
** Please LIKE 👍, FOLLOW ✅, SHARE 🙌 and COMMENT ✍ if you enjoy this idea! Also share your ideas and charts in the comments section below! This is best way to keep it relevant, support us, keep the content here free and allow the idea to reach as many people as possible. **
-------------------------------------------------------------------------------
💸💸💸💸💸💸
👇 👇 👇 👇 👇 👇

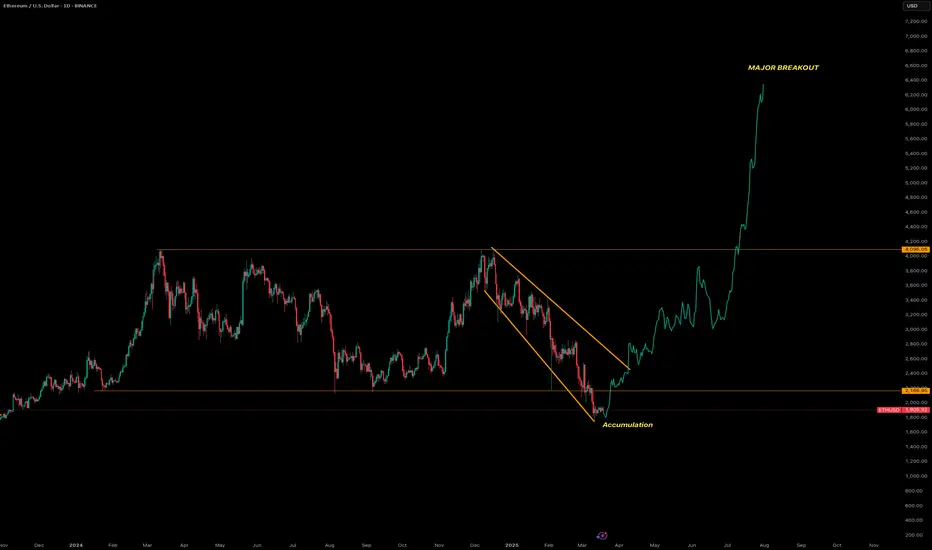
Ethereum will make a major Breakoutanalysis the chart
Let’s analyze the provided Ethereum (ETH/USD) chart on a daily timeframe from TradingView, focusing on the key technical elements and trends:
1. Overall Trend
The chart displays a significant bullish trend for Ethereum, with the price rising from around $2,200 in early 2024 to approximately $4,000 as of the latest data point (March 18, 2025).
The upward movement is marked by a sharp breakout, indicating a strong shift in momentum from consolidation to a rapid ascent.
2. Price Levels and Targets
Current Price: Approximately $4,000, with a previous support/resistance zone around $2,200.
The chart highlights a major breakout above the descending triangle pattern, suggesting potential for further upside, though no specific price target is explicitly labeled beyond the current level.
3. Technical Patterns
Descending Triangle: The chart features a descending triangle pattern, typically considered a bearish continuation pattern. However, the recent price action has broken out upward through the upper resistance line (around $2,200-$2,500), invalidating the bearish outlook and turning it into a bullish reversal signal.
Accumulation Phase: A clear accumulation zone is marked near the lower boundary of the triangle (around $2,200), where the price consolidated before the breakout. This suggests strong buying interest built up at this level, supporting the subsequent rally.
4. Support and Resistance
Support: The $2,200 level, which acted as the lower boundary of the triangle, now serves as a potential support zone if the price pulls back. This level could be retested as new support following the breakout.
Resistance: The next resistance is not explicitly marked, but the rapid upward move suggests the price may face selling pressure around previous highs (e.g., $4,500-$5,000) or psychological levels like $5,000, based on Ethereum’s historical behavior.
5. Volume and Momentum
Volume data isn’t shown, but the steep upward slope post-breakout indicates significant buying pressure and momentum. A breakout with high volume would further confirm the strength of this move.
6. Timeframe and Projection
The chart spans from late 2023 to mid-2025, with the major breakout occurring around early 2025. The sharp rise suggests this bullish momentum could continue in the short to medium term, potentially pushing Ethereum toward new all-time highs (above $4,800, its previous peak).
7. Key Observations
The upward breakout from the descending triangle is a powerful bullish signal, often indicating a reversal of prior bearish pressure and the start of a new uptrend.
The accumulation phase near $2,200 reflects a period where buyers absorbed selling pressure, setting the stage for the breakout.
Potential risks include a pullback to retest the broken resistance (now support) at $2,200-$2,500, or overextension if the rally lacks consolidation. Monitoring for overbought conditions (e.g., via RSI or other indicators) could be prudent.
ETHEREUM I Daily CLS within Monthly CLS I OB, Model 1Hey Traders!!
Feel free to share your thoughts, charts, and questions in the comments below—I'm about fostering constructive, positive discussions!
🧩 What is CLS?
CLS represents the "smart money" across all markets. It brings together the capital from the largest investment and central banks, boasting a daily volume of over 6.5 trillion.
✅By understanding how CLS operates—its specific modes and timings—you gain a powerful edge with more precise entries and well-defined targets.
🛡️Follow me and take a closer look at Models 1 and 2.
These models are key to unlocking the market's potential and can guide you toward smarter trading decisions.
📍Remember, no strategy offers a 100%-win rate—trading is a journey of constant learning and improvement. While our approaches often yield strong profits, occasional setbacks are part of the process. Embrace every experience as an opportunity to refine your skills and grow.
Wishing you continued success on your trading journey. May this educational post inspire you to become an even better trader!
“Adapt what is useful, reject what is useless, and add what is specifically your own.”
David Perk ⚔

JUST IN: Ethereum ($ETH) reclaims $2,000The price of the first altcoin (I.e alternative coins) Ethereum ( CRYPTOCAP:ETH ) surged 5% to $2030 price levels reclaiminng the $2k price point. Albeit the general crypto landscape is facing consolidation CRYPTOCAP:ETH seems to break the nuance. This move by Ethereum is tandem with the incoming Ethereum upgrades called "Pectra Upgrade""
The Pectra upgrade is bringing faster transactions, lower fees, & better staking to ETH! With account abstraction (EIP-7702) & higher staking limits (EIP-7251), Ethereum is stepping up its game against Solana!
Technical Outlook
As of the time of writing, CRYPTOCAP:ETH is up 5.12% with a bullish Relative strength index (RSI) of 69 hinting at a continuous rising trend. The 38.2% Fibonacci retracement level is serving as pivot point a move to the $2300 zone would catalyse a bullish spree for Ethereum.
Ethereum Price Live Data
The live Ethereum price today is $2,027.90 USD with a 24-hour trading volume of $13,340,876,260 USD. Ethereum is up 7.20% in the last 24 hours. The current CoinMarketCap ranking is #2, with a live market cap of $244,618,878,972 USD. It has a circulating supply of 120,626,703 ETH coins and the max. supply is not available as per data from CMC.

Bullish ETH theories I think this could be a possible scenario for ETH's next breakout. I think it's possible because of the ETH ETFs that will most likely gain some traction over time, and retail will have to play "catch up" due to the price consolidation over these past years. The winds will turn, and I think everything will play out quite quickly when it happens.
I also think the FED will announce the end of QT today at the FOMC, which COULD trigger the next ETH bull run.
Looking at the ETH/BTC chart, I think this will trigger the next leg up and complete the pattern when looking at the weekly chart, testing the previous highs.
When I look at ETH relative to SOL/USD, it also looks bullish in the short term. I think this is quite reliable, but we will see over time. Although I think ETH will outperform both BTC and SOL and play catch-up with them both.
Conclusion: I have deployed most of my crypto portfolio to ETH now, believing ETH will give me the most beta in this bull run over the coming months. I know the sentiment looks quite bad at the moment for ETH, but I believe there is a saying: "Buy when others are fearful, sell when everybody is greedy." I think this is quite similar to value investing, and I believe there is a lot of value in BTC, ETH, and SOL.
Good luck! And share your thoughts, I like to discuss things like this. =)

Alts Showing Strong Sign of Trend FailureA common retracement level for a pullback is the 76 retracement fib. On the first rip off this ETH looked good for trend cont but this failed a long time ago with the failed new high.
Now we have further development of the failure of the uptrend with the 76 breaking again.
Here's a similar point where the doge trend failed.
Most alts failed to make new highs and if they did they made nominally higher once that ended in wicks - classic early tells of trend failure.
Most of them formed in harmonics. A known trend reversal pattern.
Others were even more underwhelming, failing to break the local downtrend structure.
Most of the ones that made new highs ended up looking like this.
Classic blow off pattern.
All of these are already or very close to showing signs of advanced bear trend development - that would be predicted to go on for a considerable amount of time.
We'd only be in the first real failure of the uptrends. The reality of the downtrend not yet really kicking in.

ETH March 2025All currencies appearing in this post are fictitious. Any resemblance to real currencies, existing or dead, is purely coincidental.

Ethereum wooing toward 2022 lowsEthereum's momentum has been underwhelming to say the least. WIth network upgrades and future developments not showing a whole lot of pizzaz, Ethereum looks as it is heading toward 2022 lows near the $1,200 level. Is it a buy from there?

ETHUSD INTRADAY another consolidation rangeThe ETH/USD pair is exhibiting a bearish sentiment, reinforced by the ongoing downtrend. The key trading level to watch is at 2,220, which represents the current intraday swing high and the falling resistance trendline level.
In the short term, an oversold rally from current levels, followed by a bearish rejection at the 2,220 resistance, could lead to a downside move targeting support at 1,723, with further potential declines to 1,545 and 1,375 over a longer timeframe.
On the other hand, a confirmed breakout above the 2,220 resistance level and a daily close above that mark would invalidate the bearish outlook. This scenario could pave the way for a continuation of the rally, aiming to retest the 2,400 resistance, with a potential extension to 2,620.
Conclusion:
Currently, the ETH/USD sentiment remains bearish, with the 2,220 level acting as a pivotal resistance. Traders should watch for either a bearish rejection at this level or a breakout and daily close above it to determine the next directional move. Caution is advised until the price action confirms a clear break or rejection.
This communication is for informational purposes only and should not be viewed as any form of recommendation as to a particular course of action or as investment advice. It is not intended as an offer or solicitation for the purchase or sale of any financial instrument or as an official confirmation of any transaction. Opinions, estimates and assumptions expressed herein are made as of the date of this communication and are subject to change without notice. This communication has been prepared based upon information, including market prices, data and other information, believed to be reliable; however, Trade Nation does not warrant its completeness or accuracy. All market prices and market data contained in or attached to this communication are indicative and subject to change without notice.

ETH/USDT: Testing Key Support with Potential for ReboundThe ETH/USDT pair continues to decline, approaching a key support level last tested in October 2023. Historically, similar price movements were observed in 2021, when the price dropped from the 4,300 level before rebounding from the 1,700 support zone, ultimately leading to new all-time highs.
Currently, the price has broken above a downward trendline that had served as a resistance throughout the month. Looking ahead, the market may remain in a sideways phase over the coming weeks, with a potential upward push if buying pressure emerges from the support level. The next key target is the resistance zone around 2,190

Ethereum trading around good supportOn Linear scale chart, ETHUSD is around the support zone working since 2020. there is another parallel channel working.

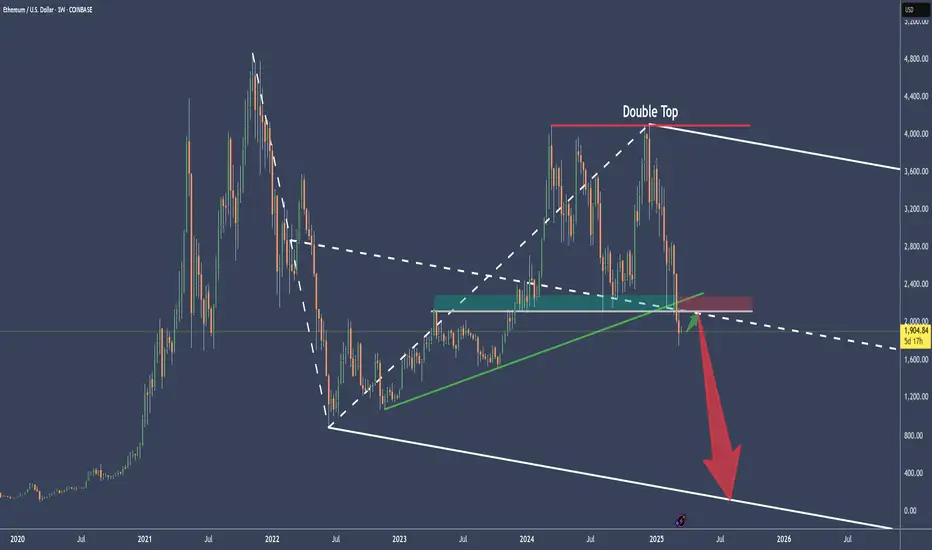
ETHUSD Cracked the longterm supportFirst there was the Double-Top.
Then there was no higher close above the last 2 highs, pressing ETHUSD brutally down to fullfill the Medianlines Rule to reach the Center-Line over 80% of times.
Then price not only reached the Center-Line by breaking through the slanted green support, but also cracked through the weekly horizontal Base (grey) which acted as the last support Bastion.
There are two scenarios possible.
a) a pullback, jump above the CL and we will see a moonshot.
or
b) price is retracing the Center-Line as it does most of the time after it's break, and then continues to the downside. Target would be the Lower-Medianline-Parallel.
ETHUSDETHUSD
After a fake breakout once it has breakout the Lower Trend Line of the Consolidation Phase. It has completed the Impulsive Waves " 12345 " will make its Corrective Waves " ABC " and retracement for the Breakout
Note :
This is only the Technical Analysis for Ethereum Next Possible move , It is not the Proper Signal

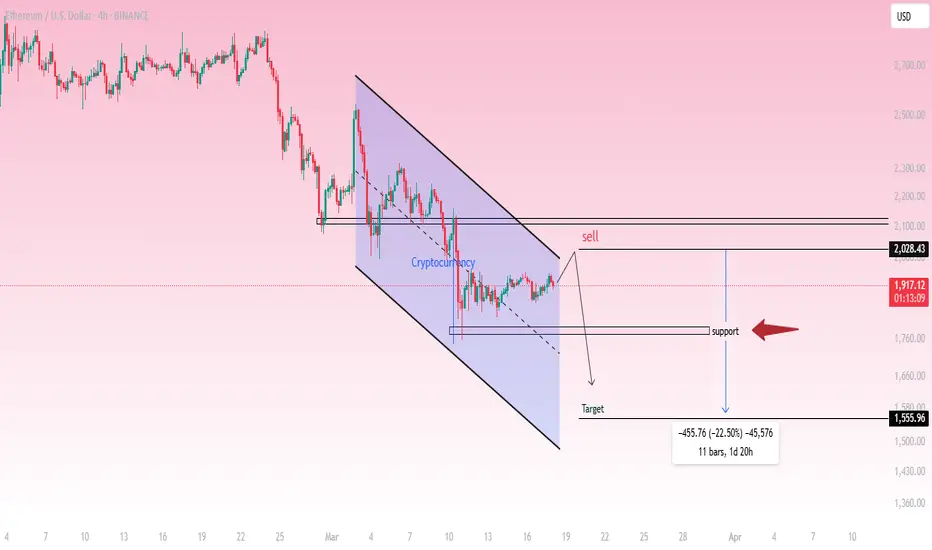
Ethereum (ETH/USD) - 4H Analysis & Trade Setup
Market Overview:
ETH/USD is in a downtrend, forming a descending channel.
Price is currently trading around $1,915.23, showing signs of consolidation near resistance.
Technical Analysis:
Trend: Bearish
Resistance Level: $2,028.43
Support Level: $1,760
Target: $1,555.96
Pattern: Descending Channel
Trade Idea (Short Setup):
🔴 Sell Zone: Around $2,028.43 (Resistance)
✅ Target: $1,555.96 (-22.50%)
⛔ Invalidation: A breakout above $2,028
Conclusion:
Ethereum is respecting the downward channel structure.
A rejection from resistance at $2,028 could confirm further downside.
Traders may consider short positions targeting $1,555.96, provided the trend remains bearish.
📉 Bearish bias remains intact unless price breaks above resistance.
The current ETH chart, incorporating my 'flash-crash' thesisThis chart illustrates the current ETH pattern, with my 'April flash crash thesis.'
I believe we will see another thrust lower into the marked lower ranges before a spring into the fifth wave. However, the fifth wave will be a "false breakout," as a flash crash in mid to late April is likely to occur, intentionally designed to sweep liquidity by liquidating overleveraged positions and triggering stop losses—only for the market to recover shortly thereafter and continue its breakout to the upside. This breakout will likely push beyond the pattern and take out the "Trump Election Pump" highs.
There could be some opportunities in the next 4 to 6 weeks, but with opportunity comes risk. Always use a proper risk management strategy suited to your skill level and wallet size.
Good luck, and always use a stop loss!

Selling ETH for a quick Short term drop to 1910 Levels Looking for some profit taking on this retrace in ETH .Selling at 1945
Stop at 1980 Target 1910
Testing format , any ideas for style greatly appreciated . Thanks
