ETHEREUM SHORT TO $786! (UPDATE)ETH buyers can't find enough momentum!
That's the power of EW Theory strategy. We can see ETH remains within a 3 Sub-Wave (A,B,C) correction channel. From pure price action we can see that price remains bearish. Wave C target still remains around $786🩸
ETHBULLUSD trade ideas

Ethereum logarithmic cyclesEthereum monthly chart logarithmic cycles shows us sideways movement is ending soon and direction will be found.
Highest probability -> Bull market until April 2026.
Lowest Probability -> Bear market until April 2026.

ETHEREUM SHORT TO $786! (UPDATE)ETH keeps on dumping😉
That's the power of Elliott Wave. We can see from our analysis that ETH remains within a 3 Sub-Wave (A,B,C) corrective channel. From naked price action we can still see that price remains bearish. Wave C target still remains around $786🩸

Ethereum - Watch This Massive Support!Ethereum ( CRYPTO:ETHUSD ) is weak but testing strong support:
Click chart above to see the detailed analysis👆🏻
The entire crypto market is currently not able to stop the bleeding and also Ethereum just dropped another -20% over the past three days. It might seem like a horrible scenario but overall Ethereum is still in a bullish market. Just watch the final confluence of support now.
Levels to watch: $2.000, $4.000
Keep your long term vision,
Philip (BasicTrading)

ETHUSD | 13.03.2025BUY 1900.00 | STOP 1740.00 | TAKE 2100.00 | After a smooth and prolonged decline, we expect a local increase in prices to the levels of 2100.00 - 2150.00.

PRICE SETTTING UP FOR THE NEXT EXPANSION (PREPARE TO BUY)We had a previous post about the price levels above 4878, we also found the time and price subdivisions that connect the significant tops and bottoms in the past and what to expect forward. We also marked the 965 and 1545 levels as the variance of 1.0 and 1.618 expansion from the primary bottom.
We made a top projection at 4106 level forward from the 1545 level which is the current top where the sharp correction commenced from. With the correction in progress we expect the range between 965 and 1545 to be a strong range to park up long term buy entries.
We also see the current correction making a bottom that will be the base for the new advance pass the 4869.47 high. This expected bottom is closely tied with BITCOIN reaching 52000 price level as the 50% expected correction.
Below 1545 every decline is a chance to add more buy entries, however, margin trades should use strict stoploss rules to manage risk. Trade safe.

ETH is in accumulation phaseETH is range-bound, once it breaks its accumulation phase, it will show you a bull run.

ETHUSD must buyDo not take a long position unless it closes above the trend line, which is a strong Support.

Ethereum - Bottom Test Ethereum is attempting to find a bottom before attempting its next leg of the bull run
This touch is shown along the yellow dotted line which I have shown in the green circles
Bulls will have there day when this line is tested
This also aligns with the 0.618 fib
Weekly timeframe

Scenario for ETHWorst case scenario for eth. Have the bulls lost...? This is not trading advice. DYOR

ETH/USD "Ethereum vs U.S Dollar" Crypto Market Heist Plan🌟Hi! Hola! Ola! Bonjour! Hallo! Marhaba!🌟
Dear Money Makers & Thieves, 🤑 💰🐱👤
Based on 🔥Thief Trading style technical and fundamental analysis🔥, here is our master plan to heist the ETH/USD "Ethereum vs U.S Dollar" Crypto market. Please adhere to the strategy I've outlined in the chart, which emphasizes long entry. Our aim is the high-risk Red Zone. Risky level, overbought market, consolidation, trend reversal, trap at the level where traders and bearish robbers are stronger. 🏆💸Book Profits wealthy and safe trade.💪🏆🎉
Entry 📈 : "The vault is wide open! Swipe the Bullish loot at any price - the heist is on!
however I advise to Place Buy stop orders above the Moving average (or) Place buy limit orders within a 15 or 30 minute timeframe most recent or swing, low or high level.
Stop Loss 🛑:
Thief SL placed at the recent / swing low level Using the 1H timeframe (2250) swing trade basis.
SL is based on your risk of the trade, lot size and how many multiple orders you have to take.
Target 🎯: 3000 (or) Escape Before the Target
🧲Scalpers, take note 👀 : only scalp on the Long side. If you have a lot of money, you can go straight away; if not, you can join swing traders and carry out the robbery plan. Use trailing SL to safeguard your money 💰.
📰🗞️Fundamental, Macro, COT, Sentimental Outlook:
ETH/USD "Ethereum vs U.S Dollar" Crypto Market is currently experiencing a bullish trend,., driven by several key factors.
Fundamental Analysis
Network Congestion: Ethereum's network congestion has decreased, with an average block time of 12 seconds.
Transaction Volume: The transaction volume for Ethereum has increased by 15% in the last 24 hours.
Mining Difficulty: The mining difficulty for Ethereum has decreased by 2% in the last adjustment.
Macro Economics
Inflation Rate: The global inflation rate is expected to decrease to 3.2% in 2025, which could lead to increased demand for cryptocurrencies like Ethereum.
Interest Rates: The US Federal Reserve has maintained its hawkish stance, keeping interest rates at 5.25% to combat inflation.
Global Trade: The ongoing trade tensions between the US and China are expected to have a minimal impact on the cryptocurrency market.
Global Market Analysis
Cryptocurrency Market: The global cryptocurrency market capitalization has increased by 2% in the last 24 hours.
Bitcoin Dominance: Bitcoin's dominance has decreased to 40.2%, which could lead to increased demand for altcoins like Ethereum.
Altcoin Market: The altcoin market has increased by 3% in the last 24 hours.
On-Chain Analysis
Transaction Count: The transaction count for Ethereum has increased by 10% in the last 24 hours.
Active Addresses: The number of active addresses for Ethereum has increased by 5% in the last 24 hours.
Hash Rate: The hash rate for Ethereum has increased by 1% in the last 24 hours.
Market Sentiment Analysis
The overall sentiment for ETH/USD is bullish, with a mix of positive and neutral predictions.
58% of client accounts are long on this market, indicating a bullish sentiment.
Positioning
The long/short ratio for ETH/USD is currently 1.4.
The open interest for ETH/USD is approximately 2.5 million contracts.
Next Trend Move
Bullish Prediction: Some analysts predict a potential bullish move, targeting $2,600 and $2,800, due to the increased demand for cryptocurrencies and the decreased mining difficulty.
Bearish Prediction: Others predict a potential bearish move, targeting $2,200 and $2,000, due to the increased competition from other altcoins and the potential decrease in global cryptocurrency demand.
Overall Summary Outlook
The overall outlook for ETH/USD is bullish, with a mix of positive and neutral predictions.
The market is expected to experience a moderate increase, with some analysts predicting a potential bullish move targeting $2,600 and $2,800.
Real-Time Market Feed
As of the current time, ETH/USD is trading at $2,400, with a 2.0% increase in the last 24 hours.
Future Prediction
Short-Term: Bullish: $2,500-$2,600, Bearish: $2,300-$2,200
Medium-Term: Bullish: $2,800-$3,000, Bearish: $2,000-$1,800
Long-Term: Bullish: $3,200-$3,500, Bearish: $1,800-$1,600
⚠️Trading Alert : News Releases and Position Management 📰 🗞️ 🚫🚏
As a reminder, news releases can have a significant impact on market prices and volatility. To minimize potential losses and protect your running positions,
we recommend the following:
Avoid taking new trades during news releases
Use trailing stop-loss orders to protect your running positions and lock in profits
💖Supporting our robbery plan will enable us to effortlessly make and steal money 💰💵 Tell your friends, Colleagues and family to follow, like, and share. Boost the strength of our robbery team. Every day in this market make money with ease by using the Thief Trading Style.🏆💪🤝❤️🎉🚀
I'll see you soon with another heist plan, so stay tuned 🤑🐱👤🤗🤩

ETHUSD afternoon analysisETHUSD technical analysis.
Bears targeting median line (red line) of larger pitchfork by the end of August 2025.
Median line of smaller, bullish pitchfork never tagged, Hagopian line acted as support at blue arrows, now breached and acting as resistance.
Key levels/support at 1071.11 and 879.80, as well as parallel channel support.

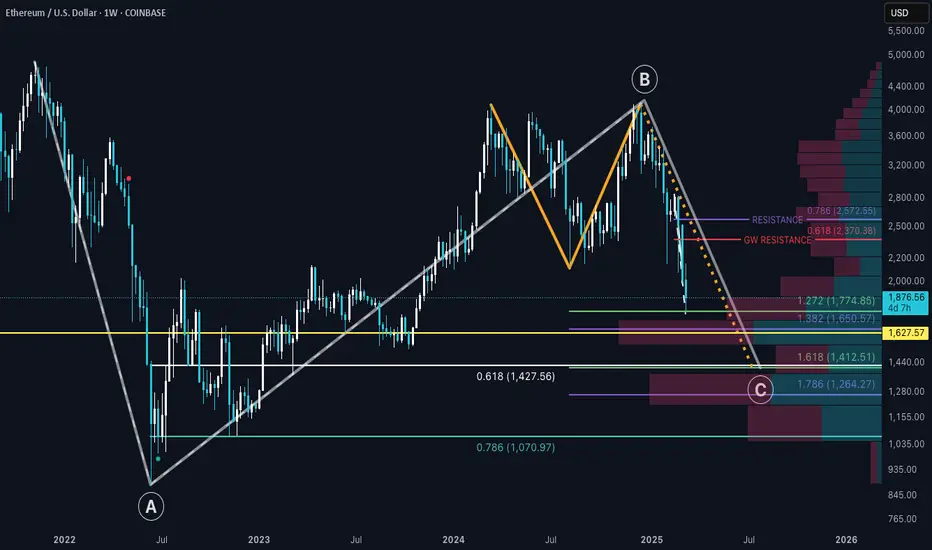
Will ETH Show Signs of Strength?ETH tagged the 1:1.272 pocket recently and bounced right off. This pocket is a major support area; given the HVN (High Volume Node) that rests in that zone.
This asset may start to show signs of strength compared to Bitcoin as we come closer to alt coin season (yes, I highly favor an alt coin season). But the question is when?
That transition could start during this correctional phase or shortly after. So trying to pinpoint the correctional bottom for ETH may be challenging.
As USDT.T has the potential to form higher local highs, I would imagine that ETH would print a lower low. There is a POC (Point of Control: Yellow Horizontal Line) that the lower low could hit @ $1627.57. If that is the case, this would suggest that ETH is indeed starting to show signs of strength compared to BTC.
If support breaks in that area, the next stop is the 1:1.618 pocket @ $1412.51. If this happens, I believe that anything lower than that support window (ending at the 1.786; $1264.27) would not be up for grabs. I'm going to label this scenario as "worst case"; The 1:1.618 GW correction.
When considering higher time frame 3 wave corrections (The gray ABC wave structure) a noticeably potential point of support is at the 1:0.618 of that larger ABC wave structure @ $1427.56.
So with these combined support structures in mind; I'm going to favor this area as the potential correctional bottom for ETH. I could be wrong, and ETH finds support at the POC horizontal ray, but only time can tell.
Good Luck Traders!
This chart for long term, not for short term!As you can see
We are in the bottom
I'm using the monthly RSI
see the monthly bottom on the RSI 2019 then 2020 was awesome, the RSI of 2023 looks ugly like the 2019, but we had our high at 2024
Everything is described on the chart
The huge pump in the end of 2025 or in the middle of 2026 (10k or 4k if it don't break out the ATH)
Good luck

ETH at Key Support - Prime Buying Opportunity ?Ethereum has just bounced off a major trendline support, and the MFI indicator is oversold 📉—a strong signal that buyers might step in! This could be a high-reward long setup if the support holds.
Will ETH regain momentum and push higher from here? 👀🔥


Pullback Soon Ethereum is eager to onboard as many passengers as possible before the rocket takes off, but this won’t last long as there’s still room for a correction in the long term. We can reassess the trade later this year once targets are reached, ideally filling the gap on the volume profile. That’s where I plan to load up on alts.
Disclaimer: Not financial advice! 🚨 Do your own research. Markets are risky—trade at your own discretion. I’m just sharing ideas, not guarantees. 📉📈

This could be a bitter end for Ethereum or an opportunity !!!This could be a bitter end for Ethereum or an opportunity. If the triangle is broken from below, the price will drop to $1300.
Give me some energy !!
✨We spend hours finding potential opportunities and writing useful ideas, we would be happy if you support us.
Best regards CobraVanguard.💚
_ _ _ _ __ _ _ _ _ _ _ _ _ _ _ _ _ _ _ _ _ _ _ _ _ _ _ _ _ _ _ _
✅Thank you, and for more ideas, hit ❤️Like❤️ and 🌟Follow🌟!
⚠️Things can change...
The markets are always changing and even with all these signals, the market changes tend to be strong and fast!!

ETH plan📈 Bullish Divergence on the Daily tf, combined with the expected cold CPI today, could give a good impulse (be careful with leverage today!), which I hope will give us a confirmed trend reversal (CHoCH) on Ethereum. 🟢
After that, we just need to wait for a good entry point in the discount zone area, and potentially a 5RR in our pocket. 👀
Plan the trade. Trade the plan.

Instability, BTC’s Downtrend & ETH at a Critical Level!The crypto market has been highly unstable over the past few weeks, largely due to the Federal Reserve’s stance on monetary policy. With no signs of quantitative easing, the market has reacted negatively, triggering a broader downtrend—especially for Bitcoin.
On Sunday, we witnessed a dramatic price surge, with BTC skyrocketing from $84K to $94K, only to see all gains wiped out within a single day. This price action is eerily similar to the 2019 “China Pump,” when BTC spiked from $7K to $10K before retracing completely within days. Such volatility suggests that sentiment remains fragile, and sellers continue to dominate.
Ethereum (ETH): A Sign of Weakness?
ETH isn’t looking strong either. It’s currently hovering around the $2,100 level, sitting right on a critical support zone. As I’ve highlighted in my chart, ETH has already broken below its support trendline—a bearish signal that suggests further downside risk. If this key support level fails to hold, we could see ETH drop to around $1,500 in the coming weeks.
Implications for the Altcoin Market
If ETH loses its support zone, it could trigger a major sell-off across the entire altcoin market. Historically, ETH acts as a leading indicator for altcoins, and a breakdown here could push Bitcoin dominance up to 66%-70% before altcoins find a bottom. This means we could be in for another phase of altcoin underperformance while BTC consolidates.
Final Thoughts: Watch ETH Closely!
Given the current market structure, my suggestion is to monitor ETH closely at these levels. If it fails to hold, expect a significant downward move in the altcoins market. Bitcoin dominance rising would confirm that altcoins are in for a rough period ahead. Stay cautious and trade accordingly!
Stock Market Struggles Add to Bearish Sentiment
It’s not just crypto feeling the pressure—the stock market isn’t looking good either. Both the S&P 500 and NVIDIA are down significantly today, adding to the overall negative sentiment. When traditional markets struggle, risk assets like crypto tend to follow suit.
That said, I’m expecting one final leg down before we see a shift. Once the Federal Reserve signals quantitative easing (QE), we can start anticipating a return to bullish momentum across both stocks and crypto. Until then, caution is key!

ethereum eth #ethethereum showing good dumping as small time frame demand broken focus on rise move for fresh entry.

EthereumETHUSD ( Ethereum / U.S Dollar )
Key Points :
1. Point of Interest
2. RSI - Divergence
3. S / R Level
4. Rising Wedge
5. Elliot Waves
ETHEREUM Stock Chart Fibonacci Analysis 031125Trading Idea
1) Find a FIBO slingshot
2) Check FIBO 61.80% level
3) Entry Point > 1800/61.80%
Chart time frame: D
A) 15 min(1W-3M)
B) 1 hr(3M-6M)
C) 4 hr(6M-1year)
D) 1 day(1-3years)
Stock progress: C
A) Keep rising over 61.80% resistance
B) 61.80% resistance
C) 61.80% support
D) Hit the bottom
E) Hit the top
Stocks rise as they rise from support and fall from resistance. Our goal is to find a low support point and enter. It can be referred to as buying at the pullback point. The pullback point can be found with a Fibonacci extension of 61.80%. This is a step to find entry level. 1) Find a triangle (Fibonacci Speed Fan Line) that connects the high (resistance) and low (support) points of the stock in progress, where it is continuously expressed as a Slingshot, 2) and create a Fibonacci extension level for the first rising wave from the start point of slingshot pattern.
When the current price goes over 61.80% level , that can be a good entry point, especially if the SMA 100 and 200 curves are gathered together at 61.80%, it is a very good entry point.
As a great help, tradingview provides these Fibonacci speed fan lines and extension levels with ease. So if you use the Fibonacci fan line, the extension level, and the SMA 100/200 curve well, you can find an entry point for the stock market. At least you have to enter at this low point to avoid trading failure, and if you are skilled at entering this low point, with fibonacci6180 technique, your reading skill to chart will be greatly improved.
If you want to do day trading, please set the time frame to 5 minutes or 15 minutes, and you will see many of the low point of rising stocks.
If want to prefer long term range trading, you can set the time frame to 1 hr or 1 day.
