Ethereum will make a Breakout Ethereum is forming a correction before making a big upward movement. Whales are accumulating it while creating panic across the market to scare people out.
ETHBULLUSD trade ideas

Enough for ETHIf ETH holds this level, a reversal to $2250 is expected this week with around a 10% return from the current price levels.

EthusdtIf you want investment in the market you should invest in eth at 1800$ this best opportunity for investors in this year 2025 just buy and hold
I saw many bear market and bullish market believe me for long term always bullish guys win 🏆
This is not for trade this is for investment

No Mans Land for ETHWe are in the middle of the ranger here.
A weekly close above $2,150 and I will be optimistic for Bulls.
However, a weekly close below $1,950 and I think the Bears will be dining some beef.


What is the future for $ETH ? We have a strong outcome of CRYPTOCAP:ETH going around $1000. We can see a nice push up after that and it’s 99% possible.
What do you think? Comment bellow.

$ETH #Ethereum AnalysisCRYPTO:ETHUSD is currently testing a significant 5 years old lower wedge around ~$2000. Violating this wedge will drive the price down to ~$1600 and ~$1100. A bounce will push the price back to test ~$2500 and ~$2800.
DYOR before reacting to the market.
#AhmedMesbah

LONG ON ETHEREUMEthereum is starting to rise from a key demand area after providing a nice pullback off a change of character from down to up.
I expect Ethereum to rise to $2700
I am buying eth and actually holding it long term as I feel crypto is ready to rise again and break new highs.

Ethereum at a Key Level! ¿Rebound or More Drop?Hi traders! 🚀 I'm entering ETH/USD at a key zone. The price is testing support at $2,098, and while the trend is still weak, the RSI at 30 suggests we're in oversold territory. 👀
Trade Details:
🔸 Entry:$2,098 ✨
🔸 SMA 200:$2,213 → strong resistance.
🔸 SMA 20:$2,167 → could act as a barrier.
🔸 TP:$2,256 🟢
🔸 SL:$1,912 🔴
Clear risk management in place—let's see if we get the bounce! What do you think? 📉📈🔥
⚠️ Disclaimer: This is not financial advice. I'm just sharing my analysis and personal experience. Every trader should do their own research and manage their risk. 📢


ETHUSD The Week Ahead 10th March '25
Ethereum (ETH/USD) remains in a bearish trend, aligned with the longer-term prevailing downtrend. The price action suggests continued selling pressure, with critical resistance and support levels defining the next move.
Key Technical Levels
Immediate Resistance: $2,490 (previous support, now acting as resistance)
Major Resistance Levels:
$2,634
$2,785
Key Support Levels:
$2,100
$2,016
$1,906
Bearish Scenario: Rejection at $2,490
If ETH fails to break above $2,490, it would confirm the resistance level’s strength.
A bearish rejection from this zone could lead to renewed selling pressure.
Downside targets include $2,100, followed by deeper support at $2,016 and $1,906 over the longer timeframe.
Bullish Alternative: Breakout Confirmation
A daily close above $2,490 would invalidate the immediate bearish outlook.
A sustained breakout could trigger an upward move toward $2,634 as the next resistance level.
A continuation of buying momentum could lead to a rally toward $2,785, reinforcing a potential shift in market sentiment.
Conclusion
ETH/USD remains bearish unless it can reclaim and hold $2,490 as support. A rejection from this level could extend the downtrend, while a breakout above resistance would signal a potential trend reversal. Traders should monitor price action closely around these levels for confirmation of the next move
This communication is for informational purposes only and should not be viewed as any form of recommendation as to a particular course of action or as investment advice. It is not intended as an offer or solicitation for the purchase or sale of any financial instrument or as an official confirmation of any transaction. Opinions, estimates and assumptions expressed herein are made as of the date of this communication and are subject to change without notice. This communication has been prepared based upon information, including market prices, data and other information, believed to be reliable; however, Trade Nation does not warrant its completeness or accuracy. All market prices and market data contained in or attached to this communication are indicative and subject to change without notice.

Eth day trade short Conclusion to first post. Full tp hit and more. Entry 2185, exit 2150. Entered off 2 min chart, abc amd pattern with top down analysis of htf ivfg, bouncing off hour bearish gap during session and LTF same patterns as htf.

Weekend daytrade Shorting ETH entry 2185Entered on 2 min chart. Top down analysis and HTF 8hr chart showed retests of inverse fair value gap after taking buy side. 1hr bearish gap got tapped in during session. Also same pattern top down of AMD ABC type of pattern. A degenerate type of trade but stops are already at breakeven.

Buy EthereumAltcoin season has been delayed, with prices seeing a sharp decline over the past couple of months.
However, Ethereum is flashing a potential buy signal with:
1. Increasing trading volume
2. RSI dropping below 40, indicating oversold conditions
These factors suggest a possible rebound ahead.

ETH Monthly Massive Trianglejust noticed this and ETH on the monthly just retested it's previous high before the base of the run up, this is common but tested once as a wick earlier. Measured move and I used the fib extension tool 6.18s are yellowed, the base is blue, so a buy are is now, and then the triangle time line is 75 bars measured from the first wick from base trend line to upper trend line. dates back to last bull run on the monthly. Most triangles break out at about 66% so that's 50 bars July 1 from either the top or bottom that's the vertical red line. With RWAs on ETH built projects, some elsewhere but evm and Solana AVAX a front run 9K ETH is really not out or the question
almost forgot important
indicators
rsi trying to turn up
volatility hearing up
but stich and jewel heading downward
some more down may be in store
waiting on Hash ribbon BTC indicator on daily to flash a buy middle month new moon maybe crazy but bull full moon is the illuminati of Bitcoin Bat Signal to buy world wide now that's deep lol

ETHEREUM BUY strongly hold patarn I think ignoring 1. Rejection at $2,200-$2,250 Zone
If ETH fails to break above this level, it may struggle to reach $2,530, leading to a retest of support.
2. Weak Volume on Uptrend
If the price rises without strong volume confirmation, the move could be a bull trap, leading to a reversal.
3. Breakdown Below $2,160
A loss of $2,160 support could trigger a deeper drop, invalidating the bullish outlook.
4. Market-Wide Sentiment
If Bitcoin or the broader crypto market faces selling pressure, ETH might fail to sustain the bullish momentum.
5. Liquidity & Whales' Activity
Large sell orders around resistance levels could lead to a sharp pullback before reaching $2,530 or $2,800.

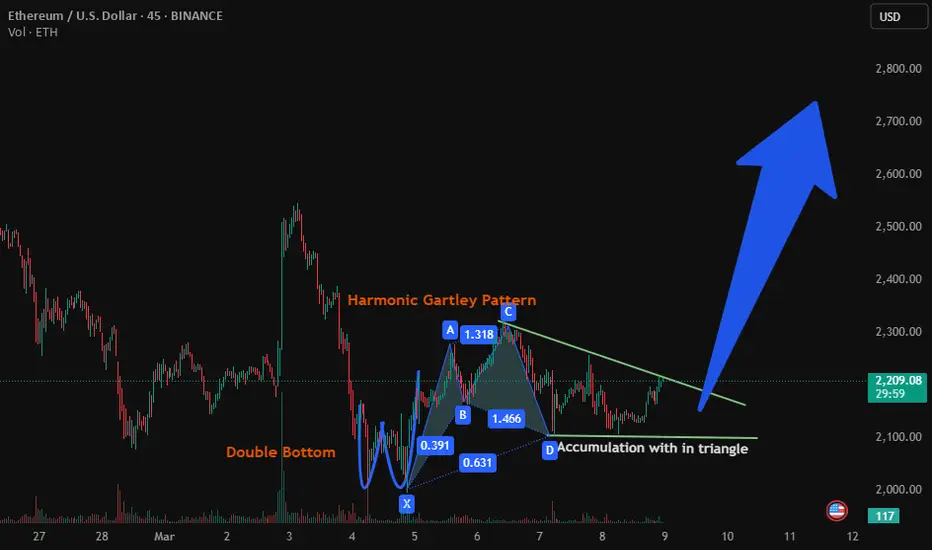
ETHUSD - Ready for Break outETHUSD seems all ready for breaking out of triangle pattern. Here is why:
Price had broken out from double bottom formation earlier.
Harmonic Gartley pattern seems to be in play.
We had impulsive bullish move earlier that caused ChoCH.
We had liquidity raid below the low that caused ChoCH.
Accumulation with in triangle in underway after break out from double bottom.
Long positions may be considered after break out from triangle.
ETH$USDTAs per trend made on ETH of 16 bar of range 01 jun23 to 1 oct 23 it will be follows 01 mar 25 to 01 July 25 at touch level around 3334.66

ETH 4h + GlobalThe correction in wave 2 WXY is complete, I think, but there is a final C that will not go below the stretched wave

ETHUSD BUYThis analysis is based on the provided image and must not be taken as financial advice. Trading involves risks, so conducting your own research and consulting with a financial advisor before making any trading decisions is crucial.

ETHEREUM: Simple Bullish ABCD PatternABCD patterns usually have a high probability in predicting reversal zones, right now ETH has completed this pattern.
Expecting a reversal and the dawn of a bull market for ETH and Alt Coins.
Let me know what you think.
Good luck!

eth rising trend CRYPTOCAP:ETH Major Reversal Is Closer Than We Expected!
The rising trend line that started in March 2020 continues to serve as strong support.

ETHUSD Energy build up capped by 2,236Sentiment: Neutral, Price action is consolidating in a tight trading range.
Resistance: Key Resistance is at 2236, followed by 2296 and 2380.
Support : Key support is at 2153 followed by 2090 and 2000.
This communication is for informational purposes only and should not be viewed as any form of recommendation as to a particular course of action or as investment advice. It is not intended as an offer or solicitation for the purchase or sale of any financial instrument or as an official confirmation of any transaction. Opinions, estimates and assumptions expressed herein are made as of the date of this communication and are subject to change without notice. This communication has been prepared based upon information, including market prices, data and other information, believed to be reliable; however, Trade Nation does not warrant its completeness or accuracy. All market prices and market data contained in or attached to this communication are indicative and subject to change without notice.
